| Why is US Oil Consumption Lower? Better Gasoline Mileage? | The Oil Drum | Lessons From Past Natural Gas Import Fiascos Suggest A Cautious Approach to Natural Gas Exports |
Tech Talk - Future Bakken Production and Hydrofracking
Posted by Heading Out on February 15, 2013 - 5:48am
Before there were refrigerators folks kept drinks cool by putting them into clay jars that had been soaked in water. The evaporation of the water from the clay cooled the container and its contents, which today includes wine bottles. On the other hand, for many years artisans have taken clay in a slightly different form, shaped it and baked it and provided the teacups which keep the liquid inside until we drink it.
Two different forms of the same basic geological material, with two different behaviors and uses. Why bring this up? Well, there is a growing series of articles which continue to laud the volumes of oil and natural gas that the world can expect from the artificial fracturing of the layers of shale in which these hydrocarbons have been trapped for the past few million years. It has been suggested that there is no difference between this “unconventional” oil and the “conventional” oil that has been produced over the past century to power the global economy. And yet, despite the scientific detail which some of these critics discuss other issues, they seem unable to grasp the relatively simple geologic and temporal facts that make the reserves in such locations as the Marcellus Shale of Pennsylvania and the Bakken of North Dakota both unconventional and temporally transient. Let me therefore try again to explain why, despite the fact that the oil itself may be relatively similar, the recovery and economics of that oil are quite different from those economics involved in extracting conventional deposits.
But before getting to that, let’s first look at the current situation in North Dakota, using the information from the Department of Mineral Resources (DMR). According to the January Director’s Cut the rig count in the state has varied from 188 in October, through 186 in November, and 184 in December, to 181 at the time of the report. Why is this number important? Well, as I will explain in more detail later, the decline rate of an individual well in the region is very high, and thus the industry has to continue to drill wells at a rapid rate, just to replace the decline. (This is the “Red Queen” scenario that Rune Likvern has explained so well.) The DMR recognize this by showing the effect of several different scenarios as the number of rigs changes.
For example, they project that 170 rigs will be able to drill around 2,000 wells a year. At that level, and with some assumptions about the productivity of individual wells that I am not going to address here, but which Rune discussed, I would suggest that it is irrational to expect that new wells will continue to sustain existing first year levels as the wells move away from formation sweet spots. Yet, accepting their assumptions for now, DMR project that the 170 rigs will generate the following production from the state:
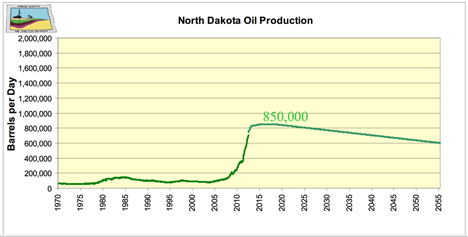
The DMR plot also assumes that the wells are developed and brought into production in a timely manner. In October the state produced an average of 749 kbd of oil, which was through mid-January, the current peak level of production. Currently it is estimated to cost $2 million to frack a well, and in January there were 410 wells waiting on that service.
In order to reach a higher level of production (and bear in mind that OPEC has been projecting significant further increases in production to make their anticipated supply and demand levels balance) the DMR looked at estimates of production if there were 225-250 rigs, and contrasted that with what would happen if the rig count fell almost immediately to 60.
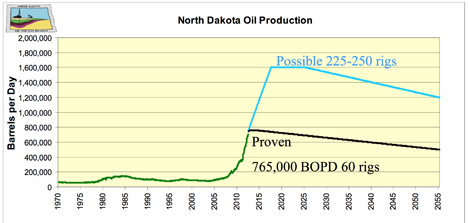
Note that at 60 rigs, the state production goes into an immediate decline. Somewhere in between those two extremes lies the likely future, but with the Director noting a December price of $77.09 that future may be at the lower, rather than higher end of the scale. (Though in January it popped back up to $87.25).
To illustrate the sensitivity of these numbers consider that if the rig count fell from 170 to 100, then production would decline to 800 kbd but would still fall into decline in 2020, while at 200 rigs the production would rise to a peak of 1 mbd, although the peak interval might only be four years from the 2,400 new wells added each year.
The ferocity of the decline rates of these wells is part of the reason that they are called unconventional, since they do not behave in the same manner as a conventional well, nor can they be developed in a similar way.
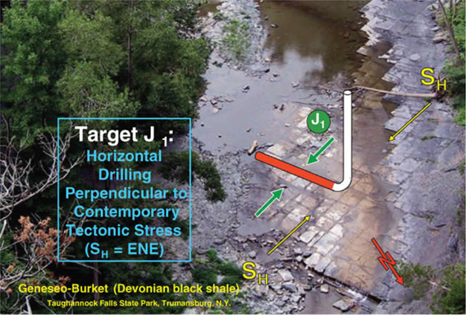
To return to the geology of the deposits (and shale is a consolidated clay) the middle Bakken formation is made up of a combination of layers of shale, sandstone, siltstone and limestone. These are, in general, rocks that have a very low permeability, and that property was explained in more detail in an earlier post. Simplistically it is a measure of how easy it is for fluid to flow through the rock, and for most of the Bakken rock it is not easy at all. If it were then there would be no need to put in the crack paths that the oil uses to reach the well. Let me repeat a figure from that post:

I have been on a site where my hosts (a federal agency) had injected fluid that they were hoping would penetrate a layer of ground so that it would form an impermeable barrier. It had not, even though the ground was relatively easy for the fluid to penetrate. Instead it had all flowed into a crack no bigger than the one shown in the picture above, and the attempt was a failure.
Put that into reverse where you are trying to pull fluid out of the ground. There are two places where the fluid (oil or gas) is located, in the natural cracks and joints of the rock – which the hydrofrack is designed to cut across. And in the much lower permeability of the blocks of rock that are edged by these fractures, bedding planes and joints.
Over the millennia the oil/gas has migrated to those bedding planes and natural joints and fractures in the rock. When the well is first put in place, that fluid is more easily available to flow through the intersecting crack pattern to the well. But as those interstices empty out it is much more difficult to move the oil from the rock surrounding the natural cracks into that crack and thence to the well.
Most illustrations of hydraulic fracturing show a network of artificially induced cracks getting more numerous as they move away from the well. That actually is not the way it normally happens. The majority of the cracks that open are already there, and these are much easier to develop – as my unfortunate hosts learned – that it is to try and generate a multiplicity of new fractures, as I have previously explained here and here. The production, to go back to my initial metaphor, begins to move over that first year of production and then dramatically fall in yield, from relying on the permeability of the wine cooler part of the rock, to that of the teacup.
Contact
- Content: editors at theoildrum dot com
- Tech support: support at theoildrum dot com
License

This work is licensed under a Creative Commons Attribution-Share Alike 3.0 United States License.
Yair . . .Could anyone give a description of the fracking process that an old(ish)'dozer hand could understand.
I see talk of 500,000 hp and more with I asume turbine engines? . . . I can't get my head around what kind of pumps would be used and reduction boxes and what all to soak up all those revs.
Cheers.
Here is a few frac trucks for sale, with their specs. Basically a 3 or 5 cylinder piston pump, rated to 15,000psi and driven by a 2000 plus hp diesel engine.
If you need more volume and horse power, you hook several, anything up to around 20, in parallel.
http://www.stewartandstevenson.com/equipment/market/oil-gas/frac-well-st...
http://www.industrialdieselmfg.com/catalog/frac-pump-units-well-stimulat...
http://www.jereh-pe.com/english/products/09091010271082.shtm#
http://www.nov.com/Well_Service_and_Completion/Stimulation_Equipment/Fra...
Shale oil is no threat to oil producers World’s future will be shaped by scarcity of oil, not abundance
This article is published by Gulf News, so they are pro OPEC, but they get it right in this case.
BP is blowing smoke with those numbers. Shale production will never reach 6.5 mb/d in the US, not even by 2030. But Gulf News is right, shale numbers are not sufficient to counter the decline from the world's currently producing fields.
Ron P.
Darwinian quoted:
In spite of thousands of oil wells drilled in shale plays, production has increased from few thousand barrels a day in 2005 to just about 1.5 mbd now. Further increases are expected such that production of shale and tight oil supply is estimated by BP to reach 6.5 mbd in the US and 9 mbd worldwide in 2030. As good as these numbers are, they are not sufficient to counter the decline from currently producing conventional oil fields in the world.It is a matter of whose decline rates for conventional crude one wants to accept. CERA is saying 4.7%, Exxon said 4-6%, and Schlumberger, stated that an accurate average decline rate is hard to estimate, but an overall figure of 8% is not an unreasonable assumption.
If Robelius is correct in estimating that the giants will come off their plateaus about 2018 (and we think that he is) decline rates will probably exceed 10%. In that scenario no amount of drilling in the shale deposits could ever make up the difference.
Well only if you accept any of the figures except those of Leonardo Maugeri who says:
All others, including CERA and Exxon, estimate declines that would be far greater than anything shale oil could possibly offset.
By the way, the article you quoted from makes for some very good reading about decline rates. I had to google it but finally found it: Giant oil field decline rates and their influence on world oil production
Ron P.
Darwinian said:
Playing a little devil's advocate here but; assuming CERA's 4.7% decline rate and world production of conventional crude at 70Mb/d (which is probably a little high) gives a decline of 3.3 Mb/d per year. If all the world's shale deposits were worked equally that loss could be compensated for. Of course the the rest of world doesn't appear to have as many "sucker" investors as the US, but if it did, shale could cut a hell of a swath of a few years.
The shale industry is backed by big money, with good PR, and they are not "quit" telling a complete lie. They also work in a geographical area, that fortunately for them, has a lot of people with more money than brains. But all in all - you are probably correct.
No, that's not it at all. Those companies who are investing in shale oil in the US are making money, so they are not suckers. The shale crude (tight oil) deposits in the rest of the world are not really all that great. And there are other problems, both economic and political, that mean very little tight oil will be produced anywhere but in North America. At least that is the opinion of the IEA and on this one I agree with them.
Ron P.
Darwinian said:
I said investors, not companies. With 55 to 85% yearly decline rates how are those investors going to look in five years; especially in places like the Bakken's which have $10 million wells. In the Eagle Ford, which has lower cost wells, and dismal production (143 b/d), they are looking at $40/barrel just to cover drilling costs.
Chesapeake got into the shale gas game early, and is now selling everything the company has to stay out of receivership. Decline rates were much higher than originally projected. The rest of the shale industry will find the same thing happening to them. The 0.1 Darcy relative permeability of the strata they are working declines very rapidly. Fracking has been used extensively in conventional wells for more than forty years, and is very well understood. The fractures are not permanent features of the rock. In conventional wells were the injector is fracked the fractures propagate to the producer and the well waters out in a few years. In these low permeability rocks the fractures silt up and undergo mineralization.
The fact that some of these companies are making money is like saying because the man that started the chain letter made $100,000 proves everyone should buy into a chain letter. Its called a Ponzi scheme!
maybe, but oil ain't gas. Gas is essentially sold in local markets. If the Cushing bottleneck disappears with the completion of the oil pipeline from there to the Gulf Bakken oil will be sold at world market prices. Quite a difference between US shale gas and US shale oil in that respect.
I do not follow shale oil co.'s stock prices and have no idea how its valuation compares to likely long term pay out--I'd hazard a guess money is made/lost in playing its swings and that will be the case for the foreseeable
For anyone interested in learning a little more about frac'ing here is a good introduction by Dr. Mukul M. Sharma at U Tex at Austin. He discusses the process in the latter part of the report.
http://www.rpsea.org/forums/produced_sharma.pdf
Those are pretty huge shale gas resources. How much of that is extractable ?
circa 2005 does anyone know what was the perceived projection of US shale/tight oil production?
I'd hadzard a guess that at $55 a barrel is wasn't worth extracting , and to add that most thought the USA economy would tank at anything over $100 lead to the belief that again nobody would be getting the stuff out of the ground and these higher prices, Turns out the USA is a little bit tougher than imagined.
Well the US economy is staggering along , you cant trust any official figures on growth or inflation and what the current oil price is doing to the economy . But I admit I was surprised at the modest amounts garnered at historically high prices from these shales and other un-conventional oil - I just think this will lead to a shark-fin decline on top of the conventional decline predictions.
shark-fin lite if you like .
Well we might have terminal bleeding and staggering along but nobody is convinced these are normal times except Faux News and MCM ( and the BBC at times ) -but the prognosis is still poor for growth and good times !
I not sure this can be repeated if we have oil at $140-150 for a few years - Does anyone have a handle of what is reserves that become a resource and extractable at these prices ? If its significant we may have a longer more drawn out affair .....
Forbin
"Turns out the USA is a little bit tougher than imagined."
Yeah, injecting a few $trillion into an economy may make it seem that way, along with a few tens of billions each month as a maintenance dose. It doesn't mean the patient isn't terminal. Just keep'em as comfortable as possible, as long as as you can. Makes it easy to ignore a bit of tingling and numbness growing in the extremities, a sharp pain now and then. That dizziness you experience may become permanent, but most become accustomed to it. A vague sense of forboding is to be expected, but no reason one can't go about one's usual activities, albeit, at a slowing rate. When the inevitable arrives, the patient has little memory of their former self and is at least apathetic about their fate, if not welcoming it.
So it goes. The world isn't what it was.... BEEP! "This is your Fed Pharmacy reminding you that your prescriptions are due to be refilled at the end of the month".
http://en.wikipedia.org/wiki/File:USDebt.png
Tough comes in the form of a deep hole.
Add on to that other ways people are stretching things - particularly the increasing age of cars on the road. I would hazard a guess that it extends to other "durable" goods as well...appliances, furniture, and whatnot.
The US may look "tough" but there are things which seem to indicate that the toughness is fed by the seed corn. One of these seasons there's going to nothing to plant and nothing to harvest.
Isn't it possible that the inflation figures are fudged sufficiently that oil prices as a proportion of economic production overall is about the same as it was in 2005? And that more than just a few folks with sufficient resources are keeping things going by filling the gaps between reality and 'officiality'? At least for the moment, perhaps as they wait for some technological super cure to come along?
Just wondering since if something like that is not occurring it leaves me perplexed.
Craig
The average Brent price in 2005 was about $54.50. Brent closed Friday at $118.90. No, it is not possible that inflation figures have been fudged that much.
Ron P.
Ron,
I think that the US inflation numbers are pretty much correct, so we agree on the point that Brent prices are much higher now than they were in 2005.
For those that think that the "true" inflation is more like that found at Shadowstats, we can construct a "real" oil price series based on the inflation index found at Shadowstats.
Over the period from 1986 to 2000 the average real price of imported crude was about $29/barrel in 2012 $ based on the CPI inflation index. Using Shadowstat indices the average price of imported crude over the same period (using 2012 $ based on Shadowstat's numbers) was about 89 dollars/barrel. In fact, if we believe Shadowstats the average 2006 real crude oil price was $106 and in 2012 it had declined to $100.
If you believe that the Shadowstat numbers are correct (which I do not), then you would also need to believe that current crude prices are only a little higher than the 1986 to 2000 period ($100 average for 2012 vs $89 in the 1986 to 2000 period.
I used the following website to construct the "Shadowstat Price index" from 1969 to 2012 (pick shadowstats using the options button, use 1983 as the starting year and change the target year from 1969 to 2012 to create a price index which parallels the CPI used by the EIA, they are similar from 1969 to 1984 and then diverge, CPI=2.30 and Shadowstat=8.52 in 2012):
http://www.halfhill.com/inflation.html
For an alternative to Shadowstats check:
http://bpp.mit.edu/usa/
DC
Thanks for those links. I have become so tired of having to "believe" what others tell me inflation is, be it from the cooked official government stats, or from Shadowstats. The problem with Shadowstats is that it simply takes the government data and supposedly subtracts out all the alleged fudge factors the government applies over the years to massage inflation lower. But it's still based on government data and what the government deems to be important in quantifying "cost to live", or whatever you'd like to call it. If the data formulation is flawed from the beginning, then trying to "unfudge" it isn't going to be much more useful.
I have endeavored to come up with my own set of inflation statistics since I refuse to believe that it needs to be that difficult. Seriously, anyone with access to historical charts for prices can come up with their own stats; why do we need to accept what economists tell us at face value? I have little confidence that 1) what the government is measuring, and 2) then assimilating into one catch-all inflation number of say 2% (what the hell does THAT mean?) is applicable to any meaningful analysis of economic performance over the years, nor of the resources we are taxing of the planet.
Through my initial investigations based on principles of thermo-economics, it seems that this whole concept of "inflation" is really touchy-feely and arbitrary to begin with, and that attempting to generate one single be-all, end-all inflation number has little usefulness besides providing some figure for the investor herds to obsess over, and divert their attention away from investigating things in more detail. So, it seems that any inflation number is, more than anything, just another gimmick to keep people from understanding what's going on, to confuse and obfuscate the real issues under some single, mysterious number coming from the authority of officialdom. Furthermore, I have not much more than zero regard for anything any economist says anyways.
I really want to develop these stats myself but this 40 hour-a-week work gig really cuts into fun time!
Hi Null,
Some economists are better than others, I personally like Krugman ( http://krugman.blogs.nytimes.com/ ) but I lean a little to the left so I tend to agree with his views. The government CPI data is not perfect, but if you compare it with the billion prices project, it is not too far of the mark IMO.
People love to poke fun at economists for not getting things right, but a large problem with social science in general is that controlled experiments are not possible. A second problem is that once people think that an economic theory is valid, that knowledge affects behavior which affects the social system and often invalidates the original theory (due to the change in behavior.
One example of this is that Keynsian Theory was dominant from about 1950 to 1975, and this dominance led to a pretty decent ability of governments to moderate business cycles. By 1985 economics was becoming all about free market ideology and rational expectations because the business cycle was no longer a problem, the government was the problem and any interference with the market was deemed unacceptable. This led to deregulation of banking, the housing bubble and a worldwide financial crisis. Krugman and many other economists get this so don't paint economists with too broad a brush, there are some economists further to the left of Krugman that also get the idea that there are limits to growth. For example James Boyce at U Mass Amherst http://www.umass.edu/economics/boyce.html . See also the following paper on climate policy:
http://www.peri.umass.edu/236/hash/fb91544e83eee767c313513fbcf60ea5/publ...
DC
I pay very little attention to anything mainstream, including 'The Newspaper of Record', but given what bleeds through my filter I'm a bit surprised to hear you say this: I personally like Krugman. Given what bits I've heard from him, he seems really not to grok our predicament - of course few do. A quick search turned up this: http://www.declineoftheempire.com/2012/05/understanding-paul-krugmans-vi... wherein he says this: If only we had "appropriate" pricing of fossil fuels, it would be "remarkably easy" to replace them.
I don't think so, really.
I wonder are you familiar with Steve Keen? Here are a couple of his links: http://debunkingeconomics.com/
http://www.debtdeflation.com/blogs/
I'm only familiar with him from having heard him interviewed on The C-Realm Podcast, Radio Ecoshock and perhaps The ExtraEnvironmentalist as well. He seems to have a full appreciation of resource limits.
If only we had "appropriate" pricing of fossil fuels, it would be "remarkably easy" to replace them.
That's exactly right. When oil went from $20 to $100, US oil imports dropped in half. $2/liter fuel in Europe has been the primary reason (geology and history the 2nd) that personal fuel consumption is only 18% of the US and Canada.
If fuel were properly priced in the US at, say, $7/gallon, the US would reduce fuel consumption very quickly.
Hi Nick,
I agree that higher prices will help, but I don't agree it will be easy. I like Krugman better than most economists, I think James Boyce (who is not well known, compared to Krugman) has a better handle on resource limits
(http://www.peri.umass.edu/236/hash/fb91544e83eee767c313513fbcf60ea5/publ... ).
Note that imports decreased by half, but oil consumption only decreased from 20.8 million barrels per day (mbpd) in 2005 to 18.66 mbpd in the most recent 12 months, this is the response to prices more than tripling from 2002 to 2012 ($30 to $100). When prices triple again maybe we can get another 11 % decrease to 16.74 mbpd by 2020. I hope the response to a rise in oil prices to $300/ barrel will be stronger than an 11% decrease in petroleum demand.
A rise in carbon taxes would be a big help, if we don't do that then in 2025 people will look back on the cheap prices of 2020 as peak oil is recognized as a "proven" theory. At some point oil prices will rise enough that substitutes will take over, I don't know what price level that is, maybe $500/ barrel will do it, at that price it may be "remarkably easy" to get people to buy more fuel efficient cars, use public transportation (and demand more of it), move to more transit oriented development, etc.
I am not sure what magic is in a price of $7/ gallon for gasoline, real gasoline prices were $1.61/ gallon in 2001 and $3.11 in 2011 (both are in 2005 $) the nominal price in 2011 was $3.53, so if we assume another doubling of gas prices we might see a similar reduction in gasoline usage. From 2001 to 2011 gasoline consumption decreased from a peak of 9.3 mbpd in 2007 to 8.7 mbpd in the most recent 12 months ( a 7 % decrease). It may take $15/gallon to see a quick reduction of gasoline use in the US.
DC
DC,
Do you have a study of Boyce's that's more illustrative of his understanding of resource limits? This study seems to argue that climate change is no more important than traditional pollutants, and that policies to limit CC should include emphasis on the traditional pollutants for the sake of equity for minorities. This doesn't suggest a strong sense of urgency about CC.
I agree that carbon taxes are extremely important.
oil consumption only decreased from 20.8 million barrels per day (mbpd) in 2005 to 18.66 mbpd in the most recent 12 months, this is the response to prices more than tripling from 2002 to 2012 ($30 to $100). When prices triple again maybe we can get another 11 %
Percentage increases aren't important. What's important is absolute increases, and their level compared to the substitutes. Below about $60/bbl there are no economic substitutes for oil, but as oil gets farther and farther above $60 substitutes become more and more obvious and pressing. In other words, this is not a linear function.
There's no way oil prices will stay above $200 for very long, unless the Persian gulf goes up in flames.
Nick,
Typically whan looking at consumer responses to a change in prices, one uses the percent change. Why? If we are talking only about absolute changes in price, then the price itself doesn't matter. So if we say the price of X went up by 1000 dollars, it sounds like a lot, but not if X is a Boeing 787.
You can claim that you know at above $60 per barrel substitutes become more attractive, but the evidence suggests that the response is quite slow. The average annual real imported crude price (2012 $) has been above $58 since 2005
( http://www.eia.gov/forecasts/steo/realprices/ ). At some point, you are correct that substitutes will become competitive, but to get people to change their preferences those substitutes must be both cheaper and more convenient.
I don't have your confidence that the price must be X in order for those changes to occur, I think that if we both guessed at X, my guess would be higher than yours, but only the future can answer the question of what X actually is.
You are confident that at $200 per barrel, oil would be so expensive that substitutes will take off, time will tell. I think that increased demand form China, India, Brazil, and other rapidly growing economies will outstrip the ability to increase supply by 2016 to 2020 and that increased prices will be needed to allocate the available oil. I think that $200 oil will be easy to achieve under those conditions, at that point prices may be high enough to cause demand to fall as substitutes become popular, if not prices will continue to rise.
Did you read the paper or just the abstract? The point of the Boyce paper is that in the process of addressing CO2 emissions, that one should address other externalities at the same time. As a simple example consider two sites that emit the similar levels of CO2 per year say a coal fired power plant vs several natural gas fired power plants (in the Western US Natural Gas power plants emit about 43 % of the CO2 per MWh as coal power plants). To maximize the overall benefit to society it makes sense to consider all emissions from these power plants, both CO2 and other harmful emissions as well. If we don't do that and consider ONLY CO2 emissions then reducing CO2 emissions from the coal fired plant would be considered exactly the same as reducing the same quantity of CO2 from natural gas fired power plants. In fact most coal power plants emit a number of other harmful pollutants and if we ignore these then we are leaving potential societal benefits "on the table", by treating the two as equivalent.
To me it makes sense to devise a policy that maximizes the benefits to society.
Boyce is not saying that CO2 is not as important as other pollutants, he is saying that when choosing which CO2 emissions to reduce, design a policy that reduces CO2 from the dirtiest plants first.
What does this have to do with resource limits? There are many resources besides fossil fuels, two which are addressed in this paper are clean air and an atmosphere with appropriate levels of carbon dioxide (less than 450 ppm).
More Boyce papers:
http://www.peri.umass.edu/193?tx_peripubs_pi1%5Bauthor_id%5D=2
put Boyce in under author
in particular, the following focuses on policy to address climate change
http://www.peri.umass.edu/236/hash/a53e6e14d91f22614b1ebe5fdd33cd0a/publ...
and to a lesser extent
http://www.peri.umass.edu/236/hash/928ccab881f907b53f0ba22a1bf978c7/publ...
DC
DC,
I think we agree that Boyce is a good source on environmental economics. At the moment, it looks to me like Climate Change is more important than either "criteria" pollutants, or equity/racial justice issues, but that's a quibble.
Typically whan looking at consumer responses to a change in prices, one uses the percent change.
Sure, and that's just fine most of the time. My point: that assumes a constant relationship: e.g., "10% increase in price causes 3% decline in consumption". I'm arguing that doesn't apply here. A doubling in price of oil from $20 to $40 is pretty trivial. A doubling from $100 to $200 is a very big deal. A doubling from $200 to $400 just won't happen unless the Persian Gulf is in flames, and even then it wouldn't last that long.
Why the difference? Several reasons.
1st, $40 oil is small relative to income.
2nd, $40 oil is small relative to other costs, including oil production-related costs like refining, distribution, profit and taxes; and small relative to other consumer costs, such as vehicle depreciation.
3rd, $40 oil is cheaper than substitutes such as hybrids, plug-ins, carpooling, ethanol, CNG, online shopping, etc. As long as prices are below the price of substitutes, there will be no substitution.
Now, why haven't we seen more substitution since prices rose above $60?
1st, short term elasticity is much smaller than long-term. Oil prices haven't been high for very long, and Peak-Lite is something that didn't exist in the history of the oil industry until about 2005.
2nd Many consumers, such as long-distance truckers, don't have good "visibility". Many are *still* waiting to see if, say, natural gas prices stay low, and oil prices stay high. They have good reason, given historic volatility. Others have only recently decided that high prices are here to stay, and are still in the transition - taxis, for instance, will take several years to move fully to hybrids.
3rd, the oil industry has fought viciously to confuse the public about this issue. It has succeeded pretty well. Only prices staying high for a long time will break through that, and that delays the transition.
4th, R&D, and capital investments, take a while. Plug-ins (pure and EREV), for instance, only really took off in 2012, 7 years since 2005.
5th, change has many costs, including new infrastructure, new maintenance procedures, training of everyone involved, etc. As long as the savings from substitution are small, change won't happen. As the difference between oil prices and substitutes rises, the incentive gets larger until it breaks through. That's a non-linear relationship.
Still, you have to realize that things would change quickly if prices rose above about $150. For instance, the last time prices rose above $125 container ships started slowing down: they can reduce fuel consumption by 50% by only slowing down by 20%. For another example, when oil prices rose in the 1970's Industrial consumers switched away from oil for process heat essentially overnight. There would be many short-term changes like that. There would also be sharp medium term changes: in the 70's the US got 20% of it's electricity from oil - that went to 5% relatively quickly, and now is about .7%.
That's the nice thing about decentralized markets: they are very flexible, and they can change things around in a million ways to optimize costs. Of course, markets are inhabited by humans who can make mistakes, as noted above, but when they get moving, don't get in their way or you'll be run down.
Hi Nick,
I agree that climate change is more important than other pollutants, but I will restate that your impression that Boyce thinks any differently is mistaken, he believes that one can kill two birds with one stone and while attacking the problem of climate change a smart policy reduces both climate change and other pollution by prioritizing the carbon emissions that emit other dangerous pollution as well.
How long do prices need to be high? Remember Keynes quote, "In the long run we are all dead."
Again you think an oil price of $150/barrel will cause things to change quickly, such a price would lead to gasoline prices of about $4.60/gallon. I disagree that such a price would cause rapid change, though it would help move things in the right direction. If prices rose to $300/barrel gasoline would be around $8.20/gallon (I am assuming gasoline taxes do not rise). This would be similar to European levels and would help even more, but keep in mind that Europe still uses a lot of oil, half of US levels per capita. As the BRIC countries and other rapidly growing countries aspire to European levels of petroleum consumption, much more reduction of petroleum use will be needed and prices will need to rise even higher without tax policies to reduce petroleum consumption.
We are mostly in agreement, many of your points support the notion that a rise in prices doesn't lead to rapid change. I agree that the process is both non-linear and unpredictable. You are optimistic that at $150/barrel oil we will reach a "tipping point" where everything will change rapidly. I think this notion is speculative and I think your price point for where this might occur is low by a factor of 2 to 3.
DC
Hi DC,
Well, I have no problem with Boyce's analysis. My point is that CC is not only more important, but it's also badly neglected by comparison, and it's facing fierce resistance from legacy industries. Those industries will use any delaying tactic possible, and it seems unwise to me to burden any kind of CC policy initiative with attempts to take care of any other problems. Perhaps its not his job to point out that practical problem with his theoretical arguments (although I kind've think it is), but we need to keep it firmly in mind.
For instance, the very best initiative to deal with CC would be a carbon tax. It's simple and effective (which is why it's been murdered in the political process). Adding anything that related to other pollutants would make it far more complex to both legislate and to regulate.
you think an oil price of $150/barrel will cause things to change quickly
When prices rose above $125 five years ago, things did indeed start to change very quickly. Keep in mind that prices were above that level for 3 or four months only. Industrial/commercial users starting cutting back quite sharply, which is part of why oil prices dropped to $40 briefly, before KSA could cut back on production.
Europe still uses a lot of oil, half of US levels per capita.
Yes, because European I/C users aren't taxed as much as consumers. Consumers use 18% as much, while I/C actually uses more than the US.
As the BRIC countries and other rapidly growing countries aspire to European levels of petroleum consumption, much more reduction of petroleum use will be needed
Substitutes work as well for them as they do for OECD countries. The economics of batteries, for instance, are the same. Above about $80, electric transportation starts to be cheaper. When oil prices are at $100, the difference is only $20, which isn't enough to overcome the "friction" of change. But prices at $120 double that incentive, and prices at $160 quadruple it.
Just as importantly, BRIC countries still have some price controls/subsidies for fuel consumption, and those are on the edge of bankrupting the government or quasi-government entities that bear the burden of those subsidies. Those subsidies would have to be abandoned in the face of $200 oil, which would be dramatically raise consumer and I/C fuel costs For instance, India has recently had to abandon gasoline subsidies, and is on the precipice with diesel.
I think your price point for where this might occur is low by a factor of 2 to 3.
I think if you look at the details of these various markets, you'll come to a different conclusion.
Have you looked at the billion prices project? http://bpp.mit.edu
Yes the link was in my first comment in this thread.
DC
You state that in January there were 410 wells waiting to be fracked. As I recall from a previous link, which I cannot seem to locate right now, that is up from 350 wells waiting to be fracked in December. The point is that fracking is the delay, not the rig count.
Even if they did increase the rig count to 225 or 250, it would make no difference. All that would do would be to increase the backlog of wells waiting to be fracked. Is this not the case? If not, why not?
Ron P.
Is there a seasonality to either drilling or fracking? I.e. are the average number of wells drilled or fracked different in winter than summer? Be it due to weather or e.g. annual revision cycles of equipment or regulatory constraints?
No but they are subject to really bad weather. The decline they had in November they blamed on a snow storm. And the last decline they had before that was in April 2011. They blamed that on a snow storm also.
North Dakota experiences first crude oil production decline in 19 months
Ron P.
No but they are subject to really bad weather. The decline they had in November they blamed on a snow storm. And the last decline they had before that was in April 2011. They blamed that on a snow storm also.
Don't know if you've worked in tough winter conditions much, but they slow overall man-hour productivity considerably, so if frac trucks availability is setting a limit on non-winter production most certainly that limit is choked down further in the winter even after a blizzard has passed and been dug out--though if new snow falls often enough in ND eastern MT there is no end to the snowdrift hassle.
I've worked more than a shift or two in subzero blows--it slows all you do. Working in the heavy gear is a bit like dragging anchor. Guaranteed none of the hookups go better when its -15°F blowing 30mph--hardly rare weather in Bakken country.
A guy working on my crew put it rather simply one subarctic 'long season.' The way he put it: if management wants a good comparison between what a hand can do in deep winter and moderate weather they should stand outside the porta potty and time the guys going in to take a leak. No one stays in those stinkin' booths longer than needed, but no doubt dealing with all the heavy clothing keeps a guy there way longer in the dead of winter--and some of the booths can be 'exceptional.' One time way out on the road system when we were using the 'local' underequipped potty contractor we had to keep stacking 2x4s around the seat to stay above the quickly rising rock solid mountain peak in the center. Winter work has all kinds of fun twists...of course break up follows winter...a whole fresh set of challenges that can mire things to a crawl for a spell.
The question was: are the average number of wells drilled or fracked different in winter than summer?
And my answer was: No but they are subject to really bad weather.
And looking at the actual data, that is the case. The Bakken data found at ND Monthly Bakken* Oil Production Statistics no discernable seasonal pattern can be detected in new wells put on line. Except of course the two months, April 2011 and November 2012 in which they had severe snowstorms.
That was my point. Of course winter weather is a lot harder on the workers but they seem to be drilling and fracking just as many wells in the winter as they do in the summer... except in the case of snowstorms of course.
Ron P.
April is break up, which can really bog the trucks down.
I calculated the monthly well additions (my math results always suspect these days, feel free to recheck and go back farther, I stopped after three flattish good weather months) for the Aug 2011- Nov 2012 from the data in your linked page.
wells added:
Aug 2011--128
Sep 2011--118
Oct 2011--115
Nov 2011--142
Dec 2011--151
Jan 2012--115
Feb 2012--105
Mar 2012--193
Apr 2012--125
May 2012--193
Jun 2012--157
Jul 2012--166
Aug 2012--132
Sep 2012--174
Oct 2012--161
Nov 2012--115
So what explains Jan & Feb 2012???
Except for August drop (did oil price dip that month???) looks like deep winter slowdown in Jan and Feb opened onto a rock and roll March followed by blizzard/break up mired April.
If you recall last winter, the US had a mild winter. ND was no exception.
One thing to remember about these fractured reserviors versus old conventional reserviors:
Old fields are using enhansed oil recovery (EOR) methods, from California's Kern county using steam injection to some in Texas using CO2 to KSA using infill drilling of injection wells (combined with max reservior contact) to other OPEC producers using seawater combined with surfectants.
The problem with trying any of these methods is that once a reservior is fractured, the later injection of some fluid or gas to force out more oil will have little effect as the fluid will simply follow the fracture path that the previously produced oil followed. Maybe some fractured wells can be fractured again after production drops, but this is not economical at current oil prices, IMO.
Once Bakken has hit its peak and is in decline, it will not see a resurgence like many conventional fields using EOR. I question the gentle decline forcast by the North Dakota DMR, slope of decline curve will be much steeper, IMO.
Don't they drill new horizontals and frac along the new parallel line? Or would a perpendicular strike be more likely to enhance recovery?
In any event, I don't think they would try to frac the same line... for the reasons noted.
Craig
As H.O. pointed out above the most productive drilling is for lateral bore to be perpendicular to natural fractures. Not sure if going down same vertical bore then drilling new lateral out through formation (radially from vert. bore) would achieve this.
I have heard that simply refracturing with higher pressure and more fluid can produce increased flow.
Any comments ROCKMAN?
Mb – lateral orientation: a very old debate. First let’s remember that virtually all the producible oil/NG is found in the existing natural fractures. Due to the extremely low permeability of the shale matrix man-induced new fractures will contribute very little FROM THE MATRIX. The goal of a frac job is to intersect natural fractures the lateral didn’t intersect.
So in one theory you may want the lateral to transverse perpendicular to the natural fractures. Predicting the orientation of the natural fracture pattern isn’t always easy but you take your best guess. But there’s a subset of debates: are the natural fractures oriented more vertical or horizontal? Typically a vert orientation makes more sense but the argument can still rage.
Next debate: OK you’re drilling perpendicular to near vert fractures. When you frac what is the orientation on those new fractures? Many engineers will draw pictures showing the induced fractures radiating outwards at right angle to the lateral. But that would mean the induced fractures grow parallel to the natural fractures the lateral was intended to cut at 90 degrees and thus will have a small probability of cutting the natural fractures. Which goes against the primary reason you frac the well.
So the reality. First, just because an engineer/geologist draws the induced fracs moving at right angles to the lateral doesn’t mean that’s how the really grow. There are methods to actually map the orientation of induced fractures and often they don’t grow in a manner anywhere close to the theory. Mother Earth decides which way the induced fracture goes…not us. I’ve seen post frac mapping that not only showed the fracture didn’t go the predicted way but actually didn’t go into the formation they intended to go into but one immediately above or below the intended reservoir. Mother can be very cruel. LOL.
Second, some will argue it’s better to spilt the difference so instead of drilling perpendicular to how they THINK the natural fractures run we should drill at a 45 degree angle to the fracture orientation. Might not cut as many fractures but then when we frac those new induced fractures (growing IN THEORY) at right angles to the lateral will hit more natural fractures.
Third, the practical side. A company’s lease position may not allow a lateral orientation they would normally drill. There are typically state regs that not only determine how close wells can be drilled to each other but also how each well's PRODUCING UNIT is shaped. Too complicated for all the details but here’s one example: the state allowed unit size is 320 acres. But in Texas I can’t draw a unit that’s 10X as long as it is wide. The units don’t have to be square but just not so biased in one direction. Thus a company might be forced to drill in an orientation to meet unit rules that conflict with their engineering preferences.
Fourth, there’s management. I’ve seen more than one manage argue against a proposed lateral orientation because that’s not how Company X is doing it and they seem to be making acceptable wells. Engineers/geologists seldom win against such logic regardless of how much tech support their ideas have. I drilled my first offshore hz well into a shallow sandstone reservoir with a 1,000’ lateral length. Why? Because Pogo had made great wells that were 1,000’ long. Not knowing how to model the potential productivity we went with that recommendation. After testing my well we discovered we could have made just as good a well with a 300’ lateral. Live and learn. LOL.
And lastly, fracture orientations change not only over longer distances but sometimes very short ones. Faulting can completely alter the natural fracture orientation. But even when the seismic shows those potentially altering faults the debates can still rage over which way to orient the lateral with respect to the faulting.
Refrac'ng: Yes some history of making a few more bucks by refrac'ng the Barnett Shale. Not huge increases but profitable because it's a small incremental cost compared to what is spent initially.
In order to make a material difference in the global supply situation, especially in regard to net exports, it seems to me that not only do oil companies have to continue to offset the underlying decline rates from conventional production, they have to offset the overall increase in decline rates from existing wellbores, as an increasing percentage of production comes from shale/tight sources, and they also have to offset the post-2005 decline in Global* and Available Net Exports.
Normalized liquids consumption for (2005) Top 33 Net Oil Exporters, China, India and the US, from 2002 to 2011 (2002 consumption = 100%, BP data), versus annual Brent crude oil prices (in red):
I think that it is likely that these consumption trends will more or less continue. As I have occasionally noted, at the 2005 to 2011 rate of decline in the ratio of Global Net Exports of oil (GNE*) to Chindia's Net Imports (CNI), in 18 years the Chindia region alone would theoretically consume 100% of GNE.
Unless a given American consumer directly or indirectly benefits from oil and gas activity, rising US crude oil production, to a level well below our 1970 peak rate, is pretty much irrelevant to them. I suspect that they are far more focused on the price at the pump.
*Top 33 net exporters in 2005, BP + EIA data, total petroleum liquids
Unless a given American consumer directly or indirectly benefits from oil and gas activity
Any idea about how much of the recent uptick or at least treading water by US manufacturing is directly or indirectly a result of oil and gas activity? Tricky figuring overall effect as higher oil prices cause a drag of varying degree in many sectors of the economy.
I can’t put a number to it but here’s some qualitative idea of what it has done for Texas. Someone reported the other day that Texas accounted for 25% of last year’s GDP. Sounds too high but that’s what was posted. The state’s rainy day fund is so fat ($13 billion) they are thinking about putting $3 billion into drought relief. The gov also plans to create a mechanism whereby the state can start rebating taxes. And there’s that old stat that about 2 out of every 3 jobs created in the country happened in Texas. Yeah…lots of lower paying jobs but better than no jobs for your state, right?
There’s also the downside: we keep throwing more and more money at road construction and not mass transit.
Someone reported the other day that Texas accounted for 25% of last year’s GDP. Sounds too high but that’s what was posted
Possibly that is supposed to read 25% of last year's GDP growth--which might or might not sound high depending on the growth number--not something I keep track of.
I personally have shied away from places with low wage job growth, but that has stuck me way out in the corner (I've been avoiding the big cities as well) with imminent closure of the AFB wing about to hit us in the shorts really hard.
There’s also the downside: we keep throwing more and more money at road construction and not mass transit
We do the same thing up here, get a couple bucks extra from oil and build a bunch of stuff we will have to maintain with less of those bucks coming in later...and later looks to be upon us right now.
Oh and by the way, California has created more new jobs than the next 10 fastest growing states combined in recent months.
Time to hang up that old canard, Rock.
"California contributed more than 15 percent of the nation’s new jobs between October 2011 and October 2012 - adding more jobs in 12 months than Texas and the rest of the other top-10 fastest-growing states combined"
from:
http://www.bizjournals.com/sacramento/blog/sanford-nax/2012/12/californi...
http://www.bloomberg.com/news/2012-08-29/california-defies-lower-tax-tex...
http://www.cbsnews.com/8301-18563_162-57562186/california-leads-nation-i...
g2s – From your reference: “California added 365,100 nonfarm jobs in the year ending in July, a 2.6 percent increase and the state’s largest 12-month gain since 2000. Texas picked up 222,500, or 2.1 percent, according to U.S. Labor Department statistics. California also outpaced Texas the prior month.” Yep…beat Texas…by a whole 0.5%.
And from your same reference: “To be sure, California is the only state where three cities have filed for bankruptcy in the past two months. The state’s unemployment rate of 10.7 percent in July was the third-highest in the U.S., trailing only Nevada and Rhode Island. Texas ranked 30th with a jobless rate of 7.2 percent, beating the national average of 8.3 percent.”
Nice that CA added more jobs than Texas for a few months. Drop me a line when the CA unemployment rate isn’t more than 40% greater than the Texas unemployment rate. Or least no worse than 29% greater than the national average. Sorry but my old carard still whips your new canard's butt. LOL.
Just to clarify: California added 64% more jobs than Texas, 365,000 vs. 222,000.
California added 2.6% more jobs to their total number of existing jobs. Texas added 2.1% more jobs on top of existing jobs. So yes when adding 142,000 more jobs than Texas, they added 2.6% vs. Texas' 2.1%, 0.5% more.
The unemployment rate in California, in the last year, has dropped more than that in Texas. Granted it is starting from a higher place.
I have no desire to argue politics. Or Texas vs. California (except maybe for best surf spots!). I am cheered to notice that things in California are getting better with a democratic governor and legislature that has changed the rules to diminish the obstructionist role of the minority republicans. I've been a green for years as both parties make me ill.
The fracking debate is getting hot and heavy here in CA. Lots of hysteria.
g2s - Didn't think we were arguing politics...just tossing some relatively meaningless change in stats. LOL. And I do wish CA the best as well as enjoying your gov hitting ours with the fart line. Keep us up to date on frac'ng in CA. I've already seen some of the hype being spewed out about the Monterey Shale.
I don't think there is anything special about predicting the flow from a fractured volume. Certain properties are the same (invariant) across the scientific disciplines and use the same basic conservation laws. The simplest approach is to apply a diffusional mass balance argument to a volume and see what the mathematical solution tells us.
If the oil is making its way out via random channels by diffusion, the minds-eye model is one of a random walk. Consider what happens when the fracturing first takes place. In an instant, many fractured pathways will present themselves. Various volumes of liquid will start to move in one direction or another, looking like the classic Brownian motion characteristic of a random walk.
With a minimal number of assumptions concerning the geometry, the rate of collection of the bits that randomly walk towards a sink is straightforward to derive mathematically. The constraint on the solution is that the enclosing collection volume is not infinite. We also assume an effective diffusion coefficient that scales the rate at which the liquid can flow. This is related to the average permeability of the substrate.
A full derivation here:
http://theoilconundrum.blogspot.com/2012/07/bakken-dispersive-diffusion-...
If you want to play around with the diffusion formulation, here is the cumulative of a diffusional flow as a Wolfram Alpha plot
The bottom line of these types of diffusional flows is that the initial flow is fast, and then it starts to slow down rather quickly as many of the random walkers start to move in the wrong direction. Once they move far enough away from the sink, it will take them that much longer to get back.
The only thing that would force them to move toward the intended sink is if some force was applied, either through a gravity head or other kind of pressure. This would change the characteristic diffusional flow into a hyperbolic flow, which is well known to reservoir engineers. Hyperbolic flow is more efficient and doesn't have as long a tail as the diffusional flow.
Not all wells will follow perfectly this behavior, but in aggregate they will, which is seen with every cumulative Bakken profile that I have seen posted or published so far.
It would be so easy to verify the behavior if the NoDak agency that archives the data would make it all available, instead of the rolled up behavior that they provide.
https://www.dmr.nd.gov/oilgas/stats/historicalbakkenoilstats.pdf
Rune Likvern has data that he was able to scrape off of PDF pages. Look at Figure 4 in this post and one can see the characteristic cumulative profile
http://fractionalflow.wordpress.com/2012/09/05/er-skiferolje-en-game-cha...
Another analyst James Mason was able to get a start with the data, using a modified hyperbolic heuristic:
http://solarplan.org/Research/Mason_Oil%20Production%20Potential%20of%20...
DCoyne who also posts here is picking up the analysis as well, showing that something between a diffusional flow leaning toward a heuristic hyperbolic flow is occurring.
http://oilpeakclimate.blogspot.com/
Another view is by Brackett who had some data that I analyzed here
http://theoilconundrum.blogspot.com/2012/09/bakken-approaching-diffusion...
The bottom-line is that given just a little more data, we should be able to characterize the declines fairly well. There are so many of these wells that the statistical aggregate should be good enough to make some long term predictions. The actual data doesn't lie and probability and statistics will fill in any gaps.
The only thing that would force them to move toward the intended sink is if some force was applied, either through a gravity head or other kind of pressure. This would change the characteristic diffusional flow into a hyperbolic flow, which is well known to reservoir engineers. Hyperbolic flow is more efficient and doesn't have as long a tail as the diffusional flow.
Don't know how you'd get gravity not to play some role, but no doubt gas is providing other kind of pressure considering they can only flare a well for one year and the size of the bright spot on ND/MT in the satellite night earth composite
Gravity could make the net flow go either way, in that it can cause the oil to go deeper through new cracks, or go upward due to higher overpressure. The net is the drift flow that would ride on top of the random walk.
The analogy to this is if you opened up a perfume bottle in one end of a room. If there was no steady air flow, the time it would take to reach the other side is determined completely by diffusion. If there was a draft that could assist the perfume, it could get there faster or slower depending on the prevailing direction of the gradient. This is just Darcy's law.
or go upward due to higher overpressure
Not quite following you here. Propant will keep the fractures from being closed by rock pressure if I understand correctly so overpressure from the overburden wouldn't seem to be be factor if the flow channels were being propped open. I might be looking at this too simple mindedly--what training I have in this field I've received on this site ?-)
No doubt gravity forces oil up when the oil floats on denser water pulled beneath it but from what I've heard this is not heavily in play in the Bakken region--though again I might have misunderstood that as well.
The Bakken oil production is gas pressure driven from what I've been told, the flare is just a handy if crude indicator of the pressence of the gas drive.
Either way, the gas pressure could force the oil deeper as much as it can force it out. Which way it goes is essentially described as a random walk.
Here is an analogy that just occurred to me. Think in terms of a leaf blower and how inefficient that contraption is on grass unless it is pointed perfectly at a leaf. The leaves essentially move in random directions.
I also realize that in conventional reservoirs, the concept of fractional flow is important, but how it fits in here I am not sure.
Mind you, I don't have any special training in this field either, but I have been herding electrons and holes in the electronics world for years, and I consider this analysis like child's play compared to the complexity of diffusional and drift flow in a semiconductor. Diffusion is diffusion and it hasn't changed much since Einstein worked on Brownian motion. It seems that we should be able to get a simple formulation for an average decline of a Bakken field.
It's possible that the companies have all this considered as tacit knowledge, bit I am not seeing them reveal any secrets in public.
I am not a geologist but have worked on flow problems as an engineer. A liquid such as oil will flow from high pressure location to low pressure location. As the gas trapped with the oil moves to the well bore it expands, reducing in density due to lower pressure. Once the expanding gas is part of the vertical fluid column it will help move the oil out since the pressure continually declines up the column, not just due to the well bore being open to atmosphere or collection tank, but due to lower density of the liquid top to bottom. I would guess that as the gas content declines, so does the oil flow.
Another comment about the gas being flared: the ND DMR will tax the gas coming out of any well after one year, thus giving the producer an incentive to capture the gas. But, the producer can apply for a variance beyond the one year grace period, thus allowing flaring to continue longer at no cost to the producer. The state legislature this year will probably change this law on gas production, disallowing any variance for flaring beyond one year of production. Then the producers will be taxed after one year regardless of what happens to the gas.
THE AVERAGE BAKKEN(ND) 2011 WELL
More and updated full time series with production data from NDIC for wells with first reported flow January 2010 or later and minimum 12 months of reported production has been added from NDIC and to my databases.
Around 200 wells started as from June 2011 and through December 2011 (min 12 months production history) out of 873 wells reported added by NDIC during said period, were used to define the “Average Bakken ND 2011 well”.
“Average Bakken ND 2011 well” was found to have a total flow for the first 12 months of reported production of 84 000 Bbls (crude oil). The decline from year 1 to year 2 (using data for wells started from January 2010 was found to average 46% (the declines are all over the place, but the 46% decline from year 1 to year 2 was derived through linear correlation with data from close to 150 wells with at least 24 months full time production history.
The total flow for the first 12 months (84 000 Bbls) for the “Average Bakken ND 2011 well” contrasts the NDIC typical well that has been used in various presentations and which suggests that the typical well in Bakken North Dakota has a total flow of 169 000 Bbls during the first 12 months.
The chart above shows the moving average of total crude oil flow the first 12 months and with first reported production January 2010 or later (yellow circles connected by black line).
The dark red line shows the moving average of the 50 recent wells (12 months full time production history) in sequence as from January 2010 and as of December 2011.
The number of wells (presently at more than 400) is close to doubled since last time the figure was shown, and the trend remains, the well productivity has declined since the summer of 2010 and appears now to have stabilized at around 84 000 Bbls for newer wells.
- Rune
BAKKEN (ND) PLATEAU OF 700 kb/d WITH THE BAKKEN(ND) 2011 WELL
The chart below is from a simulation to get an estimate of how many producing wells that need to be added during 2013 and 2014 to get to a plateau of 700 kb/d by January 2013 for crude oil production from Bakken in North Dakota, and maintain that plateau through 2014 using the “Average Bakken ND 2011 well” described further up.
(The Bakken field stretches into Montana and Canada, and here it is looked at Bakken in North Dakota.)
To maintain the plateau of 700 kb/d with the “Average Bakken ND 2011 well” it was estimated to require an additional 1 200 - 1 300 producing wells through 2013 and another 1 000 - 1 100 additional producing wells through 2014.
The chart above shows the results from the simulation using the “Average Bakken ND 2011 well” as from January 2010 and through December 2014. The colored areas are production by month, year. The transparent colors are from the simulation from January 2013 and through December 2014, stronger colors actual.
The thick red line shows actual production as reported by NDIC.
For the period January 2011 and through November 2012 the model was on average within 2% of actual reported NDIC data.
The gap between actual and simulated during 2010 is due to wells with higher productivity than the “Average Bakken ND 2011 well” started to flow during 2010.
The red dots with black circles are added producing wells by month reported by NDIC (right y-axis).
- Rune
Rune finds that the average decline from year 1 to year 2 is 46%.
For a pure diffusional flow, the theoretical result should be 58%.
Diffusion is one of those scalable processes that once you know the rate decrease in the first year, you can calculate the rate for the second year.
I would guess that these are like 70% diffusive flow, just from looking at year 1 to year 2.
If we can get year 2 to year 3 numbers, that would show the evolution more accurately. The first year always shows noise because of uncertainty in start time. For example, a January start versus a June start, where the end of the calendar year represents a year. This is one of the bureaucratic bookkeeping decisions that can screw up the statistics.
If DCoyne is reading this, I think he knows what I am talking about.
WHT,
For what it is worth the chart below shows how decline for year 1 to year 2 for wells started from January 2010 and as of December 2010 (24 months of full flow as from December 2011 and as of November 2012).
The chart represents 144 out of the 732 wells started to flow as from January 2010 and through December 2010 in Bakken (ND).
Apparently the decline from year 1 to year 2 is all over the palace, the simple average is 48%, but decline rates from year 1 to year 2 appears to correlate with first year flow, the higher flow the higher decline, and again the decline rates are all over the place.
WHT, what is it you are trying to say….in English?
- Rune
Take a look at the average cumulative data for Bakken wells (from Mason) as the dashed blue line.
I added green arrows at the 1 year and 2 year cumulative points. The trend is that the cumulative at the two year point is diminished from the 1 year point by around 50% (just by eyeballing it).
Next to the dashed blue line is a dashed red line which is the expected diffusional decline which best fits the data.
Notice how the trend continues to decline year-over-year beyond that point, and matches to what Mason sees in his data. In his paper, he calls it a hyperbolic decline formula modified by selected power-law exponent.
You have a point about variability in the data, and that will always exist, if only because the data is collected in different ways. However, there is an average decline for these wells and I contend that it is close to a diffusional decline.
BTW, the diffusional decline curve is
C(t) = C0/(1+1/sqrt(D*t))
where C0 is the asymptotic limit, and D is the diffusional flow.
Okay, for a non-mathematician, just what the hell does that mean? And can that be translated into an average percent decline for the first year? For the second year?
Ron P.
Ron, If the production is measured as some value the end of the first year, pure diffusion would knock that down to sqrt(2)-1 of its value at the end of the second year. That is the the 58% decline I mentioned. Rune had an average of 46% in his collected data, with a whole lot of variation from well-to-well.
The square root comes about from the basic Fick's Law of diffusion, which has been renamed by hydrology and reservoir engineers as the Darcy's law variation. (Every discipline of science and engineering has a diffusional law that they get to rename)
WHT,
This is very interesting and it very well may be that the decline follows the pattern you describe.
I think that as of now, as there are little hard data available on tight oil wells on decline over several years, any projections on future declines are just that, projections.
Most oil companies are aware of this and circumvent this (issue) by looking at Net Present Value (NPV) which is nothing else but discounting the flow (disguised as discounting the cash flow).
NPV is a method to evaluate if a project adds value for the company.
Using NPV, the rate of late life decline rates impacts the NPV in a small way. Physical flow is of course affected by decline.
Oil companies are motivated by NPV.
- Rune
It's kind of coincidental that the hyperbolic discounting that investors apply is similar to the hyperbolic decline that these reservoirs go through. Both of these show long tails in the rate of return. Maybe it's not a coincidence.
I agree that when they decide to pull the plug will have an effect on the cumulative total, that is fairly obvious.
The stabilized first-year well-productivity numbers (84,000) may indicate that the "sweet spot" area of Bakken (ND) is larger than some at TOD have been estimating. Alternatively, it may indicate that the drilling itself is becoming more productive even if the well-area is somewhat less "sweet".
Is that a possible conclusion?
I have never tried to estimate the area of the “sweet” spots like Alger, Sanish, Parshall, Reunion Bay, Van Hook (other around here are better at that) etc., but there are still large areas left to be drilled in the sweet spots and judging by data from NDIC it appears that companies have been drilling more in the sweet spots during the recent year and drilled/completed less in the less prolific areas in Bakken (ND).
The results from the simulation so far suggests that the 2011 well productivity has continued into 2012 and perhaps through 2012 (too early to say for sure).
There could be a combination of strategies resulting in a stabilization of the well productivity; technological improvements; more focus of activity to the sweet spots as better mapping and understanding of the trend develop with time, new emerging “sweet spots”…..we will know more as more data become available.
- Rune
"The total flow for the first 12 months (84 000 Bbls) for the “Average Bakken ND 2011 well” contrasts the NDIC typical well that has been used in various presentations and which suggests that the typical well in Bakken North Dakota has a total flow of 169 000 Bbls during the first 12 months."
This appears to be a tremendous discrepency. If you are Darwinian and don't believe in conspiracies, then you believe the ND numbers ("Why would they lie?"). On the other hand, if Rune is anywhere close, then why would ND continue to promote those high average well production numbers, since by now they must know they are wrong?
Right now, since all the recent independant estimates of "average" Bakken well production (for instance, by Hughes, etc.) are all much lower than the ND-promoted averages (and closer to Rune's numbers), then right now I have to assume that ND's numbers are more about promotion than reality, and one begins to wonder about any of the numbers they put out.
Elmo,
More on NDIC numbers for typical Bakken well;
https://www.dmr.nd.gov/oilgas/presentations/WBPC2011Activity.pdf (big pdf document)
Link above to a NDIC document, slide no 10, shows 427 Bbls/d (average per calendar day, 156 kb for year 1) for Year 1 for typical Bakken well
https://www.dmr.nd.gov/oilgas/presentations/presentations.asp (big pdf document)
Link above to another NDIC document slide no 10, 486 Bbls/d (average per calendar day, 177 kb for year 1) for Year 1 for typical Bakken well
I got my numbers from a different public document (“Oil and Gas Production Tax Comparison, Montana and North Dakota") showing 467 Bbls/d (average per calendar day, 170 kb for year 1) for Year 1 for typical Bakken well.
- Rune
Rune, where am I wrong? the graph on page 10 of the first link shows the “typical” Bakken well starting Year 1 at 923 b/d and ending the year at 486 b/d, for an average of 705 b/d rather than 427. Times 365 makes it slightly more than 257,000 barrels for the first year, rather than 156,000 barrels.
In any case, any hunches how the NDIC results can be so far off from the independent analysis of yourself, Hughes, and Bernstein? Your estimate of 84,000 barrels/yr. comes in at 230/d for the first year. Bernstein’s graph suggested about 238/d. Hughes' graph suggested about 325/d.
The first number is the IP (Initial Production, 923 bbl/d) number, the second number (427 bbl/d) is average daily flow for year 1. Then follows average daily flow for year 2...etc.
Deviation from Bernstein may be due to number and actual wells used, cut off for the analysis (data as of October 2011 versus December 2011) etc.. A deviation should be expected, but not a a big one.
Hughes I am not sure of, but there it could be selection of individual wells and/or looking at "fields" also including wells in Montana.
Did this help?
Rune
Well, if you somehow know from someplace other than the graph or the link that the other numbers are averages for the year but the 923 is instead the start of production at time zero, than I will have to take your word for it. Because even you have to admit that there is no way anyone could discern this from the graph and it is not explained in the link.
You are pretty sure the other numbers are not production at the end of each year, right?
Elmo, if you download one of the presentations and look at the production/well profile you will find that the first number starts at year 0, the second at year 1, then the numbers follows the years, apart from that I have it from reliable sources as well.
Rune
I understand exactly what Elmo is talking about. There has to be some sort of average for the initial production value. Depending on whether this is averaged over a day, a week, or a month, you will likely see different numbers.
Even though there is noise in this measure, from a modeling perspective it is important. What happens with diffusional models, is that you can see a singularity at delta time. But this quickly dissipates, and if you know the time the initial production is averaged over, you can use the averaged value in the analysis. Otherwise it is not used.
WHT,
The IP number is not a reliable indicator for future production. I have seen data on wells with high IP and fast declining flow and wells with low IP and turning out to be very good wells.
And I agree, the presentations should have specified what the numbers are, I have seen presentations doing just that. Normally IP is over one day (these are specified in the NDIC data for each well), and yes there are great variations in the IP numbers.
After discussing the best approach to handle this it was found that looking at full time series data over at least 12 months of reported production was the most reliable (and time consuming) method.
I am leading Elmo to the data sources and explaining how to read them (or he may seek clarifications from other professionals). Elmo is capable of understanding the data and also starts asking the right questions...which is good and I wish more people would do that.
What I have seen is that as people get access to the data source and read them by themselves they may form an independent opinion from them...thing with hard data is, they do not lie.
Yes, there will be some noise, but if several studies arrives to numbers in the same area then it is possible to reduce the influence from noise. Elmo referred to Bernstein that had arrived to similar numbers as me (some deviation should be expected, I have not included dry wells and wells with tiny and erratic flows).
- Rune
Rune,
This is a diffusion model fit to the "typical well". It is a bit different than the diffusion model that I have used in the past because it uses what is called an Ornstein-Uhlenbeck (O-U) process random walk.
The O-U process places a "drag" on the random walkers causing a reversion-to-the-mean, which describes a flow that can't get to far from its starting point.
What is interesting about an O-U process is that it has a steep drop and then it transitions to what looks like a fat-tail before it goes into a thin-tail exponential decline. Note that the Initial Production value I used in the model was an average over the first 3 months. That is how I got it to match to the IP data point.
This particular fit gives a cumulative of 600,000 barrels for the typical well, which is probably about double the amount that you are getting with your analysis.
I think Bob Brackett from Bernstein Research is also suggesting 250,000 barrels cumulative for the average well. OTOH Mason's analysis is saying 600,000 barrels or above.
I believe your point is that the "typical well" is an inflated number in comparison to what you are seeing. Are you saying that it is inflated by a factor of two?
WHT,
First, thanks for sharing. I think it is difficult to predict the decline (call it average decline) several years out in time. It becomes educated guesses. The "typical" Bakken well you used (from NDIC/DMR I take) would have an EUR in the area of 600 kb (crude oil) after 40 years.
The "average 2011 well" that I used was defined from around 200 unique wells from all over Bakken starting to flow in the period June 2011 - December 2011 (12 months of reported flow or more).
If I apply the decline rate as used by NDIC/DMR as from year 2 and on wards I get an EUR of around 450 kb (crude oil) after 40 years, but again it is difficult to predict future decline rates.
I used a decline rate of 46% from year 1 to year 2 for the well that was derived from actual data.
The typical Bakken well by NDIC/DMR has a decline rate of 65% from Year 1 to year 2.
The differences in the decline rates (around 20% from Year 1 to Year 2) works out to a big difference as it is compounded over several years.
So if I apply NDIC/DMR decline rate from year 1 to year 2, the EUR for the "average 2011 well" becomes far less.
The "average 2011 well" (derived from actual data as described above) has a flow for Year 1 that is 50 - 55 % of what has recently been shown in NDIC/DMR presentations, so that suggests as you point out that the typical NDIC/DMR well, as far as it also represents the average well, is inflated by 80 - 100% (for the first year flow).
Hope this brings us further.
- Rune
Rune,
I have a comment concerning the huge statistical variation that you are seeing.
The model that I use for diffusion depends on uncertainty. I use a maximum entropy prior on a diffusion coefficient and on the spatial volume that the well is drawing from. This produces a stochastic mix of all possible wells that have some sort of "average" value. This approach was pioneered by Jaynes as a way to deal with having no knowledge (or being ignorant of) any higher moments in a distribution of values. I call this variation dispersion, and it essentially will result in a variation of well declines that are observed.
In a previous comment, I mentioned that 58% was the decline expected from a diffusion-limited flow. The average of 46% and 65% is 55.5%, which is getting close to 58%. Did I say that Bayesian estimation is part of this? Well now I said it.
I think we are getting closer. DCoyne has been doing a lot of work in this area and I hope to see him chip in and compare his results from http://oilpeakclimate.blogspot.com
Hi WHT and Rune,
I don't have a whole lot to add. My most recent update on Bakken output is based on the average well (this is a weighted mean as Rockman talks about below) having a first year output of about 100,000 barrels and about 30,000 barrels the second year (this is a much steeper decline of 70 %). I assume that the "average well" will be less productive in the future as the sweet spots become more scarce. Starting in Feb 2013 I assume new wells drilled will be 0.5 % less productive than the wells from the previous month, I create cumulative curves for each month from Jan 2013 to Dec 2024 (144 curves in total). I have selected five curves on the following diagram (Jan 2013, Dec 2014, Dec 2016, Dec 2018, and Dec 2024) because 144 would be a little unwieldy.
Using the Jan 2008 to Jan 2013 curve (I assume the average well remains the same over this period) and the data from North Dakata on the number of producing wells and crude output we get the following:
The fit is fairly good. (Note that wells starting production from Dec 2004 to Dec 2007 use a well profile similar to the Dec 2024 profile shown in the previous figure, there was likley a more gradual improvement in well productivity over this period, but this step up in productivity did not affect the results drastically).
Lastly I have created several scenarios of how Bakken output might change in the future, all scenarios assume that real oil prices will rise gradually (5 % per year at least) in the future.
The pessimistic and plateau scenarios assume new wells are added at a rate of 125/month until at least December of 2015, the total number of wells reaches about 11500 in the pessimistic scenario. In the plateau scenario 125 wells/month are added until Dec 2021 and then decline gradually with the total number of wells reaching 21500. A medium scenario sees the new wells added accelerating from 150/ month in Dec 2012 to 248/month by Dec 2016 remaining at 248 new wells per month for 18 months and then declining with the total wells drilled reaching 24400. The optimistic scenario ramps up in a similar fashion to the medium scenario, but goes a little further to 260 new wells per month by Dec 2017 stays at that level of increase for 3 years (Dec 2020) then gradually declines with total wells drilled reaching 36000. See Figure below:
That's all I have for now.
DC
DC,
Thanks a lot for taking time and sharing.
I find your simulations very interesting.
The shale developments has some interesting dynamics created by the interactions from; developments in well productivity, decline rates, infrastructure (gas processing and transport, roads, electricity, water etc.), access to capacity to bring in new wells, access to capital/debt, NPV considerations, economic risk management by the managers/boards of the oil companies, price developments/expectations, companies may also be motivated from different strategies....this just to name a few.
- Rune
That is rather impressive. The interesting thing is that the math is not too difficult, but it is just a matter of doing the bookkeeping. And in particular, the importance of what DC and Rune do in terms of back-checking the run-up to today's date so that the projection is calibrated to historical data.
Fit general decline curve --> Calibrate run-up --> Project future growth
Thank-you for refining and updating your simulations.
By your model if the rate of producing new wells in the Bakken decreases from the current level of about 150 new wells/month (1,800 wells/year) to about 125 new wells/month (1,500 wells/year), then the production from the Bakken plateaus.
Bluetwilight,
Thank you for the concise summary, I would add that the oil price is a key ingredient (along with other factors mentioned by Rune above) to how things will progress. If prices stay where they are, a plateau is more likely, if they fall the pessimistic scenario (or lower) is more likely. If oil prices follow the exponential trend from 2002 to 2012 they will rise to $300/barrel by mid 2018, if they follow a linear trend prices will rise to about $160 in mid 2018, reality will fluctuate above and below some unknown future trendline.
My guess is that prices will follow an exponential trend at first, but then substitutes for oil will moderate this trend so that prices will level off at 250 to 300 dollars per barrel around 2020.
In the following chart I have used data from the EIA:
http://tonto.eia.gov/dnav/pet/hist/LeafHandler.ashx?n=PET&s=RBRTE&f=W
and calculated a 13 week centered moving average for nominal Brent spot prices from 2002 to 2012, linear and exponential trendlines projected foward 10 years are shown.
If prices follow the exponential trendline and the economy does not crash as a result, then the Medium or even the optimistic scenarios might play out, I think reality will fall somewhere between the medium and plateau scenarios and that prices will fall between the exponential and linear trendlines.
DC
WHT, (and others interested)
Below is a chart showing the decline rate from Year 1 to year 2 for 144 (in my databases) out of 732 wells that had 24 months of reported flow (as reported by NDIC per November 2012) or more and that started to flow as from January 2010 or later versus total flow for the first 12 months of flow.
The linear correlation is shown for what it is worth.
As the chart illustrates the decline rates are all over the place, but a general trend is that the higher the total flow for the first year (first 12 months) the higher the decline rate from Year 1 to year 2 is.
- Rune
Rune,
Using all of your data for Bakken North Dakota, what is the average 1st year cumulative crude output/well and what is the average 2nd year cumulative crude output/well for all of the wells that have at least 24 months of data?
Thanks.
DC
DC,
I am now giving cumulative data on the wells I studied that have both 1 and 2 year production data from NDIC, these (144 in total) are all started as from January 2010 and through December 2010 (numbers rounded to nearest 100).
Year 1; 104 100 Bbls
Year 2; 155 500 Bbls
Note: wells started during 2010 had a higher first 12 months flow than wells started in 2011.
Was this of any help?
- Rune
Rune,
We are getting a little closer, I am trying to get at a "weighted average" decline rate. From this data it looks to be about a 50 % decline from year one to year two, but I am unsure if you have 24 months of data on all 144 wells because as far as I can tell the December 2012 data is not out yet. Maybe these wells started production between Jan 2010 and Nov 2010?
Another question is where does the 84000 barrel estimate for 12 months come from? Is that the number for wells which started production between Jan 2011 and Nov 2011 (and how many wells in that sample)?
I am thinking of harmonizing my model with your data, from your moving average chart for first 12 months of production I would put 1st year at 90000 barrels and year 2 at 45000, I may try a hyperbolic model which matches those two data points, and I may play with WebHubbleTelescope's O-U Diffusion Model to see if I can pull all three lines of thinking together. Thanks for sharing your research.
DC
DC,
A well reported with start of flow in January 2010 will have 12 months with reported flow by December 2010, 24 months by December 2011. A well started in December 2010 would have 12 months of reported flow in November 2011, 24 months by November 2012.
NDIC data from November 2012 was the most recent used when I did my updating/expansion of the databases.
Yes, all those 144 wells have 24 months or more with reported production.(Dry wells and poor performing erratic flow wells are not included by me.) Wells that had a few days of flowing in the first month that were less than the flow of the 13. month were shifted to the right, in other words my model assumes then the first month to be month 2, thus month 13 becomes month 12.
The 84 kb well is from 197 (out of a total 873 reported by NDIC) wells started as from June 2011 and through December 2011 (by November 2012 these had 12 months or more with reported flow). Further dry wells and poor flowing/erratic wells are not included in my number of 84 kb.
(I have good reason to believe, based on my own and similar research by other companies (operating in Bakken) that the 84 kb number is now likely in the high end.)
It will be interesting to learn about the outcome from your model, that is, if you are willing to share.
Best
Rune
Sorry Rune, my counting skills need work. I was thinking a well started in december would report in Jan, but was forgetting that the production was for december so month 1 is Dec and month 12 is Nov.
You do an interesting most recent 50 well moving average (red line) on one of your charts, it would be interesting to see a similar line for the most recent 200 wells to see how that 84000 barrel number has changed over time, the most recent 50 wells have climbed up to around 90000. Another possible way to look at it would be to look at 12 month cumulative in 7 month bins so we could compare wells starting Nov 2010 to May 2011 with the June 2011 to Dec 2011 data you have (84000 barrels for 12 months), this would give us some idea of how rapidly the average well is declining. I am also unsure why you chose only the last 7 months of 2011 to define the average 2011 well rather than using Jan 2011 to Dec 2011, maybe so the well count was similar to the Jan 2010 to Dec 2010 period?
I am absolutely willing to share what I have learned. I suggested 90000 barrels for year 1 and 45000 barrels for year two, but I do not have access to your data. My current model used the well profiles found https://sites.google.com/site/dc78image/files-1 and named "bakken decline curves" available in excel ond open document formats click on arrow at right to download.
Basically the model is about 100000 barrels year 1 and 30000 year 2 and then assumes about a 6 % decline every year in the average well profile fom 2013 to 2024.
Do you have an alternative suggestion? I am trying to incorporate the hard data you have to define an average well for the 2008 to 2012 period, but at this point my picture is still a little fuzzy.
For the 144 wells which started between Jan 2010 and Dec 2010 the average 12 month output was 104100 and the 2 year output was 155500 barrels. For the 197 wells starting production from June 2011 to Dec 2011 the 12 month total was 84000 barrels. Taking the midpoints of June 30 2010 and Sept 15 2011 this would be 14.5 months and a 19 % decline over that period, or roughly a 16 % decline per year.
It occurs to me that to match my model to your data (as I understand it) it might be best to use the 2010 data as my average well from 2008 to 2010 and then start a decline process of 6 % per year so that at year end 2013 the well profile would be for a one year output of 86380. Comments? I appreciate your patience.
DC
DC,
let me for a starter answer with the data I have available, and then move from there.
I have a 50 MA for the 2011 wells (as from Jan 2011 through Dec 2011) and this wobbles between 65 000 and 95 800. The average for wells (studied) for 2011 is 83 400.
As I went through the NDIC data I observed that (some) companies had reduced activity, few or no added wells during the recent 6- 8 months, in less productive areas, while increasing (adding new wells like there would be no tomorrow) activity in sweeter spots. As of now this may suggest that future well composition could be more biased towards sweeter spots than previous ones. That was some of the reasoning for narrowing the selection down to more recent wells (as from June 2011). If I used the average for all for 2011 it would not have made much difference (83.4 kb vs 84 kb). (I looked at other combinations as well, and most came out around 84 kb +/- 1 kb).
The average well is not a static number.
If I had made a selection starting October or November 2011 the average may have increased to 88 kb, but then this would have been from a population of fewer wells.
The Bakken formation is still a testing ground.
Honestly and going forward I think it becomes important to also note what pools newer wells comes from, if newer wells are dominantly in sweeter pools/spots, the average may temporarily move higher, while the total number of wells added may decline as companies decide not to consent (which has happened) to drill wells in areas/pools where the productivity makes it uncertain for the economics to work and give priority to areas that are "proven"...if there is any such thing in a tight oil play (this is all about informed expectations).
Going through the data I observed that several “marginal” wells had changed ownership, and it is here it is important to understand the NPV chart (for the well) I posted somewhere in this thread. Weaker players with weak wells risks to see some of their capital destroyed. Stronger players, who understand the NPV dynamics for the wells, will try to identify these weaker players and give them an offer that limits their losses (this is also a game of understanding the time value of money). The strong will eat the weak.
The typical NDIC well has a decline profile of, 65%, 35%, 14%, 10%, 10%, 10%, 10%, 8%, 7%, then followed by 6% (year 1 to year 2, then year 2 to year 3 etc.).
The data on actual decline rates for Bakken wells beyond year 3 is still very limited and decline rates, especially the first 4-5 years influences the EUR and the total production profile.
I think we need more data from actual wells beyond year 3 before a more confident curve fit is possible, in other words the decline rates beyond year 2 or 3 are now basically educated guesses.
Was the above of any help to your questions?
- Rune
Rune,
Thank you, your comments have been very helpful. I am well aware that "the average well" is a moving target and changes monthly (or daily if we had the data to track it). You have spent a lot of time digging into the data and thus can offer much more insight into how the "average well" has been changing over time, I am trying to guess at future trends and your input helps a lot.
Ron comments below that of course the future wells will have lower output than current or older wells, I believe that he is correct, my question is how much are they declining, your data points to about 20 % per year, that is the first year cumulative output has declined about 20 % from 2010 to 2011 (from 104 kb to 84 kb). I would point out that from 2005 to 2009 this first year output was rising in the Bakken as fracking plus horizontal drilling was being ramped up. Also where the drilling occurs makes a difference, it is possible that the decline from 2010 to 2011 was due to drilling in less productive areas in order to hold onto leases. My understanding is that a lot of this drilling to hold leases has been completed for now and companies are focusing on sweet spots and bringing down drilling costs by utilizing more pad drilling.
DC
This is what that typical percentage decline looks like, where year 2 is the point at which one can calculate a decline from the previous year:
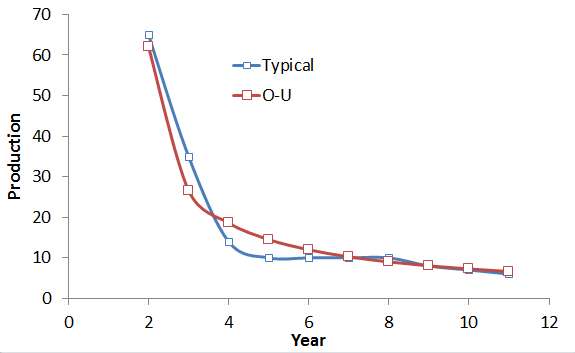
The model fit is the O-U diffusion profile.
That makes perfect sense. And I would bet that wells started in 2011 will follow the same pattern, they will have a higher first 12 months flow than wells started n 2012. They have to move further and further from the sweet spots.
Ron P.
Rune – I appreciate all the effort you and the guys are doing trying to quantify the situation. But I have a bit of confusion such as what is meant by a “typical Bakken well”? It doesn’t appear to mean average especially a weighted average. It doesn’t appear to mean anything close to the medium. And a point about the “IP” or initial production rate. My DrillingInfo data base list the IP rates for every Eagle Ford well as reported to the TRRC. We have to submit a detailed initial test report that includes an “IP” number. Rarely does a well begin production at the IP rate. Companies, especially public companies, will test a well at the max rate possible rate so they can report the highest IP number. In reality during the first month or two of production rates tend to be increased slowly. Pull a well too hard and too fast and you can damage the frac.
Your plot seems to show exactly what we know about all trends unconventional and otherwise: there is no “typical well”. At best you can come up with a weighted average. But then there’s the risk of using even that number in a projection: will future wells be drilled into areas with similar production potential? That argues the sweet spot concept. Will future wells be completed the same as the statistical base? Seems we already seen that assumption destroyed as companies have drilled longer laterals with many more frac stages. I can’t speak to specifics of the Bakken but in the Eagle Ford Shale companies have moved from 1,500’ laterals with 3 or 4 frac stages to 5,000’+ laterals with more than 20 frac stages. Any statistical analysis of this population is breaking one of the cardinal rules: population consistency. Which is unavoidable IMHO unless one can access all those details and a lot of spare time. And I mean a lot. I’ve just spent 2 weeks studying such details on a small conventional field with just 20 wells and I’m only half way there to an answer.
As far as predicting future EUR for a particular well it isn’t that difficult after you’ve produced it for several years. Trying to predict it after just 1 or 2 years will be always be somewhat inaccurate. But then there’s the practical side of the oil patch. Companies have little concern about the flow rate of any well much further than 6 or 8 years out. And thus the cumulative production from those distant years is also of minor importance to a company. The drilling economics are dominated by Net Present Value which is dominated by the production during the first several years. Simple example: Well A will cum 600,000 bo but has a NPV significantly less than Well B which will cum 400,000 bo. Thus Well B represents a much better rate of return. But then there’s the added complication of which well will allow a greater proved reserve value. Well A might be preferred if the company can get a third party to book that entire 600,000 bo. But that can be a big IF.
And that leads to even more difficulty predicting future outcomes based on a rather speculative data base. Companies will make drilling decisions based on factors other than those statistics. One company may choose to drill many marginal wells because that’s all they have in inventory and are being pressured by Wall Street to add reserves regardless of their economic value. OTOH another company may have an inventory of very good prospects it decides to slowly develop dues to lower oil prices at that time. Or maybe they are capex short at the time. And then what if ND changes the rules on flaring (an increase or a decrease)…how would that change predictions?
All of which adds up to why I’m very appreciative of the efforts everyone is putting in. Besides being a very difficult analysis there’s the added difficulty of insufficient detail in the data base. Just consider the currently discussion and what appears to be a simple question: of all the Bakken wells drilled during 2011 what is the average of each of those wells during their first 12 months of production? Is that a different number for wells brought on in January 2011 than those brought on in December 2011? If so what stat do you to make forward projections: the Jan avg, the Dec avg, the 2011 avg. And is the average significantly different that the median? And what does that number imply about wells drilled during 2013? Wells drilled in different areas and by different companies (not all companies produce the same outcomes) and completed differently than those drilled in 2011? Or do you forget all those numbers and use the average for wells drilled during the second half of 2012? But we don’t have good stats on those wells yet, do we?
It is a good fight. Keep it up, good luck and again, thank y’all.
ROCKMAN,
Thanks for good questions, thoughtful remarks and clarifications.
NDIC/DMR in their presentations uses the word/description typical when showing a well profile.
If their use of the word typical also can be interpreted to mean average, I have seen no clarification about. Normally I would assume typical also to mean average.
When I use the word average it is the arithmetic average of several, but here again by applying more sophisticated statistics the average will take on a different meaning.
My observation is also that what is referred to as the “typical/average” well is NOT a fixed number and will change over time for several reasons, both below ground and above ground.
This makes forecasting for a tight oil/gas trend difficult because also of above ground factors primarily economics, Net Present Value (NPV), you may run into a discontinuity.
This because if a company finds that wells proposed for drilling are expected to not meet their return requirements, they will simply not drill it or not consent to drill it.
Northern Oil and Gas, Inc. Provides Fourth Quarter 2012 Production and Operations Update
Presently the general trend observed for Bakken in North Dakota is that this “average” in general is declining. This should be expected given the history of picking the lowest hanging fruits first.
As can be observed from the (my) first chart in this thread this average (50 wells moving average) for wells (more than 20% of the total) studied and started as from January 2011 and through December 2011 and their first 12 months totals wobbled between 70 kb and 100 kb.
What I also observed when updating and expanding my datasets with actual production data from NDIC, was that some companies during 2012 had slowed down (or deferred) drilling in areas with below “average” wells and ramped up drilling in proven sweet spots. This may be one of many factors explaining the apparent stabilization of the “average” well productivity. Length of laterals and fracking stages may be factors as well.
Sorting the wells according to length of laterals and number of fracking stages is a valid and good point, but takes time. In general longer laterals and more fracking stages also has a considerable cost effect and wells are decided based upon informed expectations (or consent) so here it will take some time to know if this improves profitability.
If what I observed is a general trend, then it should be expected more drilling in/around the sweet spots and less in the peripheral areas. In other words and for the short term, the average well productivity may come up while the number of wells added declines.
After all the oil companies are in this to generate a financial profit from producing oil and natural gas.
THE PRACTICAL SIDE OF THE OIL PATCH
ROCKMAN,
Here you move into an area that average people outside the oil business have little insights.
Oil companies produce oil and gas to make a financial profit. To get an idea if a project (well) adds value they use Net Present Value (NPV) estimates. NPV is discounting the net cash flows over the expected lifetime of the project. NPV thus discounts the oil and gas flow, so one short cut is just to discount the expected flow.
The chart above shows how portion of the NPV for the NDIC/DMR typical tight oil well is earned at some discount rates as a function of time and also shown is how the physical flow (thick grey line) is earned versus time.
The chart above is the only one a person really needs to understand to get some insights into the dynamics of tight oil/gas. It is charts like the one above that make discussions about decline rates 10+ years out in time an academic luxury from an oil company’s standpoint. That is, the discussion is important as the oil company always will have to hold an understanding of how a potential buyer would evaluate the NPV for a well/field at any given point in time.
A company would strive for a well design that allowed it to earn say 80% of the NPV (financial) within 3 years. That would be a fantastic well.
This also explains the rush to test out various configurations of laterals and fracking stages. In other words, the well design is very much influenced from economic considerations.
Note in the chart above that 80% of the NPV is earned within 5-7 years (depending on the discount rate applied), while only 53 - 60% of the EUR is earned (recovered). This is why it is the flow during the first 4-6 years that has most interests with companies.
There is one method (of several) to get an idea about how newer wells develop, and that is using, call it an average/typical well, and see how total production over some time develops by newly added wells (number of wells added by month multiplied by the average/typical well).
If the model with the average well undershoots actual reported production, this could suggest newer wells are better and vice versa. This information would also have to be evaluated with the locations of the newer wells, like did they come in “sweet spots”, all over the trend etc..
- Rune
Rune: “Normally I would assume typical also to mean average.” Some advice buddy: don’t ever go to potential investor show & tell on a drilling project. LOL. In the vast majority of cases I’ve observed when a presenter says this profile is for a “typical well” they mean a typical economic success. Every one of us knows exactly what “average” and “median” mean so if we don’t use those terms there’s a very good reason. I’ve never seen anyone include dry holes and marginal wells is their number crunching. Why would they: they’re not proposing to drill a bad well but a very good well. So they use good well stats in their projections. I’ve always ignored any numbers a prospect generator supplies…even the ones that worked with my company. I always research the numbers myself...every time. a great deal the time I find the poorer end of the population ignored. A common explantion given: "Company X didn't really know how to drill/frac properly. That's why our well will do much better." I've heard that rationale more than 100 times in my career. Imagine how easy that would be to offer in a fractured shale trend when you can't know how a well might have produced had a different operator drilled it. There have been a few operators I'll watch because I know they have a habit of screwing up potentially good wells. When it comes to interpreting statements from any portion of the oil patch you make assumptions at your own risk.
“This because if a company finds that wells proposed for drilling are expected to not meet their return requirements, they will simply not drill it or not consent to drill it.” Remember my tale about a company intentionally losing around $12 million in NPV so they could up there companywide production rate to drive their stock price up? A rather extreme example but real none the less. I’ve also witnessed companies intentionally drill sub-marginal ROR projects for a variety of reasons such as not losing book reserves due to non-development. If they drill those wells they keep full book value. The well may eventually prove that book value was too high to begin with. But if management can find new reserves to replace them they can hide the facts. Also management may already have their exit strategy in place and don’t care what eventually surfaces to be the truth after they’ve checked out.
When it comes to naïve/inexperienced investors the oil patch pros will skin them alive and leave their carcasses rotting in the ditch. This is not a gentleman’s game. LOL.
ROCKMAN,
I hold what you describe to be reality.
ROCKMAN; what if we teamed up and attended these investor shows and asked for some clarifications to some of the slides presented during the presentations? And also brought our own data and research.
I sense the word “party trasher” would come to take on a completely new meaning. So if the word got around we could agree to stay away, if compensated handsomely. LOL
Yes, I have also seen claims that Company X in Bakken does not know how to drill and frack their wells and should adopt the experiences and technologies of Company Y and reeducate their outdated engineers/geologists.
Strategies among companies may vary, often it is difficult to know what their goals are (apart from the obvious of making a financial profit), and boosting the share price and hoping/praying someone will bite (buy them up)?
Honestly I have developed the same attitude, those who enters the oil/gas game based upon poor research/understandings (and primarily guided by greed) deserves to get divorced from some or all of their money.
As you know; Experience is something you get...... right after you needed it!
- Rune
Rune - there are a number of companies in Houston on my "Do not evaluate" list. When I consulted and a client asked to look at a deal from Company X I would tell them no because I had an extremely strong bias against that company. I wouldn't tell them why and would just leave it at that. About 10 years ago I walked into a reception area for a presentation with a prospect generator I didn't know. He walked out with his new partner...someone I knew and who knew me well. His partner looked like he was going to pee on himself. He was probably looking to see if there was a US marshal standing behind me with a warrant for his arrest. I kid you not: I’ve bumped into him socially and saw the same reaction. They mumbled about a scheduling conflict and cancelled the meeting. Meeting was never rescheduled for my client: told him they had already sold the deal.
Did I ever tell you about the time I helped the Texas Rangers arrest some crooks selling a bogus drilling deal? I’ve had a few very satisfying moments dealing with cheaters in the oil patch. LOL.
"to get divorced from some or all of their money." We actually have an official technical term for such projects: money disposal wells. Honest...it's short hand description of a deal that we all immediately understand.
WHT,
That model is awesome! Thanks.
https://sites.google.com/site/dc78image/files-1
At the link above are some spreadsheets (Excel and Open Document) with the name "bakken decline curves". If you would like to see how your model can be matched to the hyperbolic/exponential hybrid I used for the Bakken (based on what I saw in the Eagle Ford data). Or if you are patient I may try to do the same. I was hoping you had a post on this as I am not nearly as adept at mathematics as you. Doubtful that I could do this without it being laid out in a blog post.
DC
DC,
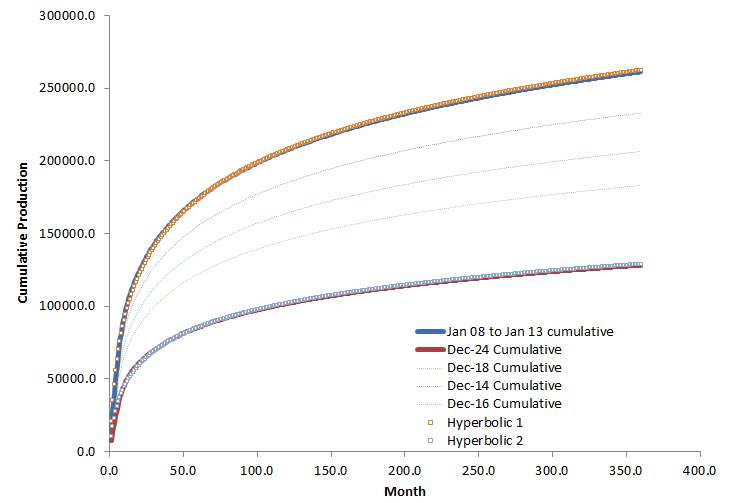
The first thing I did was to fit your data to a hyperbolic cumulative
This fits perfect so I assume I can match your hyperbolic model correctly. In other words, I am assuming this is model output and not the real data?
I also did an Ornstein-Uhlenbeck fit to your spreadsheet. This by definition won't fit as well, but since it has an extra parameter to fiddle with the fit is not too bad.
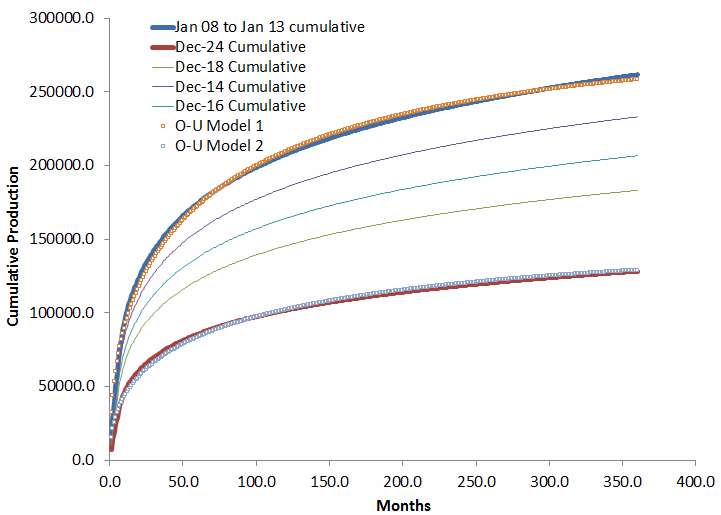
I assume that what we would want to do is find out which one fits the actual data better.
You are the best judge of how to proceed.
WHT,
Thank you for taking the time to do this. You are correct that the spreadsheet data is based on a hyperbolic decline model and not real data. Do you have a link to a speadsheet or equations for O-U Models 1 and 2 that I can use? Looking at how close the fit is I think the match to actual data will be similar to the hyperbolic decline model that I used. I would be willing to test it against the ND data if you are interested, but I am not yet clear on how to implement the O-U model (I don't have nearly the level of mathematical sophistication that you possess.)
DC
DC, I have a google docs account to so will place the modified spreadsheet on there later today.
Otherwise the Ornstein-Uhlenbeck model is straightforward
Keep time as is but create a decelerated time
T = (1-exp(-S t))/S
Use the transformed time in the diffusion cumulative
C(t) = C0/(1+1/sqrt(D T))
The three parameters are D=diffusivity, S=drag , C0 = volume scale
T substitutes for t in the OU variation.
Thanks, Web
I will see if I can reproduce your OU Chart independently using the equations you provided.
C(t)=C0/(1+1/sqrt(D*((1-exp(-St))/S))), I use * to denote multiplication.
The above equation would give the cumulative output at time t or C(t) at some given values of the parameters D,S, and C0 for an OU diffusion model.
DC
DC, You have the formulation correct, but just in case, here is the spreadsheet
https://docs.google.com/file/d/0B-ycoDmNCe6wc1NLak9Bb2Z2blU/edit?usp=sha...
Web, are you familiar with this guy's blog. His math is way over my head but I figure it would be right down your alley.
Mark Anthony's Instablog
Here he figures Bakken decline rates are .02% per day.
Mark Anthony's Instablog Bakken Decline Rates
That comes to about 52% per year the way I figured it.
Ron P.
Ron,
Good catch.
IMO, don't sweat the math as that's not really math, it's just an empirical fit to the data using the ARPS heuristic.
This is essentially the same formulation that I and DC have been calling a hyperbolic fit. DC is using a fit very close to a harmonic which is on the borderline between a hyperbolic and exponential decline.
What is most interesting is that the hyperbolic fit allows infinite EUR, albeit it is very slow in reaching that point.
From the article
I am trying to come up with a model that is more math physics oriented. Do this right and it shouldn't blow up to infinity. That's the problem with the ARPS heuristic in that allowing an infinite cumulative is not physically realistic.
The O-U Diffusion model I have been using has the fast initial decline and then a gradual leveling before it starts bending toward zero. No infinity because it is a real model based on diffusion within a volume.
The other interesting part is the speculation on what kind of chicanery is being done to the initial downslope, i.e. in the first several months. It should be really steep, and that's what the author claims is actually happening but someone is massaging the data so it doesn't appear quite as steep. This gives it a higher potential cumulative.
Thank you Web,
I will try to get something up soon.
A quick question on C0, from a physical perspective would this be equivalent to the original oil in place (OOIP) per well? For example if we estimate the Bakken holds 100 billion barrels and expect 30,000 wells to be drilled, would we expect C0=3.33 million barrels? I ask in part because there is no a priori reason that the hyperbolic profile that I used is correct and using a lower C0 of 550,000 barrels, seems that it doesn't match up with the physics, unless the OOIP is only 17 billion barrels.
DC
Hi WebHubbleTelescope,
I modified the parameters in an attempt to match some of Rune Likvern's data.
So C0=1,300,000 barrels, D=0.0005, and S=0.0005.
We get the following:
A pretty good match.
For the medium scenario with well profiles declining about 13 % each year (1 % each month) starting Jan 2013 to match up more closely with the 20 % decline from 2010 to 2011 in Rune's analysis.
DC
I have a feeling that the exact profile of the average decline curve doesn't matter much except for the long-tail behavior. So a hyperbolic versus the O-U diffusion model is similar in the bulk of the curve. Any difference will likely be more apparent after the decline hits in the out-years.
I think the intriguing aspect of this analysis is that we have a somewhat homogeneous environment (i.e. the Bakken region) with thousands of potential data points contributing, which allows us to perform a very comprehensive statistical model, certain to improve with a year or two more data.
As DC said in the adjoining comment, the estimate of Total = #wells * averageOil/well is critical for an ultimate projection. Either Total or #wells is needed.
DC - I may not be following correctly: are you assuming 100% recovery of the OOIP? I'm pretty sure you’re not because that's physically impossible. Also, Web’s plot of the cum vs. time as log-normal is pretty standard practice to give a good visual projection of an individual well and sometime an entire field. But such a plot, and its future projection, is not a natural data distribution…is it? IOW if all drilling stopped tomorrow the curve would immediately flatten out pretty quick and would increase very slowly. OTOH if the curve was flat and then there was a sudden uptick in drilling it would immediately begin to rise. But again no predictability of future cum unless one assumes a certain amount of drilling. And then only if those drilling results are similar to past efforts.
Am I interpreting incorrectly?
Hi Rockman,
I believe I misunderstood the C0 parameter in WebHubbleTelescope's O-U Diffusion model, I had thought it was related to OOIP, and you are correct that I do not expect 100 % of OOIP would be extracted, my guess for the Bakken would be about 5 % of OOIP might be extracted, under optimistic assumptions ($300/ barrel oil in 2020 and no crash of the economy as a result). Does that sound like a reasonable recovery factor for the Bakken under such optimistic assumptions?
In the case of Web's plot of cum vs time on log-normal coordinates, I think this is for "the typical well" presented by the NDIC, rather than for the entire field, so is not dependent on new drilling, though prices would influence when the well would be abandoned.
You are correct that the curves that I present depend on future drilling and I laid out my assumptions for those scenarios, if my guesses for future numbers of new wells brought online are incorrect, the model will be incorrect. What you describe is quite right, fewer new wells, the output curve will flatten, more new wells will lead to an upslope. My model also assumes that "the average well" will have lower cumulative output in future years (about 1 % less next month than this month and continuing in that fashion for 144 months, where my model assumes the Bakken is fully drilled up). Again this may over or underestimate the effect of running out of room in the sweet spots.
DC
DC - I resist putting a hard number for recovery % for a couple of reasons. First, a hundred years from now we couldn't do the calculation because we'll never have an accurate number of OOIP. Second, the temptation would be to start believing that the recoverable reserve number will be related to OOIP. You et al clearly point out how other factors will control the results. But I would readily agree that your low estimate of RF should be in the neighborhood. But that still requires further qualification: is a 5% RF economically recoverable or technically recoverable? Opens another can of worms, eh? LOL
Hi Rockman,
I am suggesting that under the assumptions I presented, does a 5% economically recoverable factor of OOIP sound reasonable. I know much less about geology than you, but I am aware that OOIP is a very rough estimate, I am saying if we did know the OOIP was X, for a field (or play) like the Bakken would a 5 % recovery factor (even technical) make sense? You seem to have great knowledge of the Austin chalk (and I know that the geology in that case was very different), what kinds of recovery factors were seen in that play? Thanks.
DC
DC – Still difficult for me to be strongly supportive of any model. Just had this discussion with my boss yesterday about a recovery model we’re running on one of my projects. All models are valid if the math is done correctly. But being valid doesn’t mean the projection is correct. As you point out this all hangs on the assumptions used in the model. And this is where it’s easy to pick apart any model. Bakken OOIP: that value varies significantly across the basin. Easy to assume X bo/acre and then multiply the areal extent of the Bakken. But to be at least reasonably accurate you have to do a weighted average. There are areas where probably 2 to 3 times X is valid and other areas where .2X is valid. In fact, in a recent drilled well X turned out to be zero because the Bakken formation wasn’t even present in that area.
You can see where I’m going: if one can’t document the accuracy of just the OOIP then the % recoverable becomes somewhat mute IMHO. But that doesn’t mean one can’t make an assumption in a model. So we do that. Now the next assumption: what will be the recovery efficiency? And that follows with a question: where? Depending of the drilling density, lateral lengths, number of frac stages, etc. two areas with identical OOIP metrics might yield vastly different recovery percentage. Consider that the more prospective areas were drilled first: that sweet spot thing. But earlier wells were drilled with less extensive methods because they weren’t required: a shorter lateral with fewer fracs resulted in a good well. There’s also the tendency to over drill sweet spots: if I’m making good wells in Area A I’ll concentrate there before going to Area B where results have proven to be of lesser economic value. But once I’ve drilled up Area A I have no place left to go but Area B. But to compensate for lower productivity I drill longer laterals and do many frac stages. In theory that should increase the recovery % for Area B.
My inclination is to assume that the OOIP estimate is too high. Such an estimate is based upon past results. The development of the Bakken has not been a statistically random process: that sweet spot thing again. Thus any assumption assuming undrilled areas will match the OOIP metric of previously drilling will be incorrect IMHO. OTOH because wells are being drilled in less productive areas longer laterals/more frac stages are deployed. This would potentially allow a higher recovery factor in an area that contains less OOIP per acre. But the economic value of those wells is decreased due to the higher drilling/frac’ng costs. And that adds another layer of variability: some companies will pursue such projects and others won’t. The scenario: same OOIP, same recovery % using identical technology yet Area A won’t be drilled as extensively as Area B because the company owning Area B finds the ROR insufficient. IOW a strong bias per company in areas where the OOIP and RF are very similar. But Company C will farm in Company B’s acreage and drill it up with investor monies. But they’ll use less extensive/expensive methods to develop the area and perhaps even have poorer economic results that Company A. This is not a farfetched scenario: this happens far more often than many outsiders would imagine. And yes: those investors are what we refer to a “stupid money”. A cruel but fairly accurate description. There is a significant subset of companies that focus strictly on stupid money. And plays like the shales draw a good bit out. Especially when the read reports like one we’ve been discussing elsewhere: “There’s a 99% chance that every new Bakken well will produce oil”. Heck, who would invest? LOL.
And that brings us back to the basic question: what is the goal of this model? I’ll assume it’s to predict future production from the Bakken. But as you point out even with a decent physical model of recovery the future will hinge upon the number of wells drilled which will depend of the future price of oil as much, or perhaps more, that the physical model. A complex model could certainly take into account all of these variables. But with so many assumptions layered on top of so many other assumptions I’m not sure any result is more valid just making a WAG. Of course, we can call it a SWAG if we like just to make ourselves feel better. LOL.
Remember I'm a geologist when evaluating someone's exploration prospect I don't bother to look at their economic projection. All exploration wells yield high returns...on paper. I simply determine if the concept makes sense. But "making sense" doesn't necessarially mean low risk. Early on most of the shale prospects I reviewed didn't make sense at least with respect to the returns my owner requires. Had we been a public company I can assure you we would have bought hundreds of $millions in shale leases. Then cashed out our stock options and went away to let others figure out how to make a profit. To this day Petrohawk has been THE most profitable Eagle Ford Shale player IMHO: put a huge acreage position together cheap, drilled a few "seed wells" and then sold themselve for $12 billion. That's how you make the really big ROR in boom plays. Back to the Austin Chalk play I had more exposure to: many of the most profitable companies in that boom never drilled a single well.
At this level, and IMO, models always win. Observed behaviors from various natural processes show similar characteristics and these can be described mathematically. Geologists should not believe that their specialty is somehow different or unique in this regard. This is not neuroscience or string theory we're talking about, just the statistics of counting things, what physicists refer to as statistical mechanics.
Statistics is a great leveler across anecdotes and describes the collected wisdom. Certainly at one time the black swan, the super-giant, etc could overshadow the statistical body of data. But with energy becoming more and more dispersed, the statistics become that much more important. This eventually leads to a situation where we may have to resort to sifting the sea-water for uranium or trying to harness the energy of fluctuating winds. The management of energy then becomes a completely mathematical exercise of modeling the stochastic behavior of nature.
If people are confused by the way various people view the big picture, I hope this helps.
Web - I've seen many models not win. I'm sure you have also. A model built on incorrect assumptions will always lose. And you know better than me that any statistic based upon one population won't be very applicable to a different population. And that's what I see as the prime problem in predicting future drill outcomes in the Bakken or any other resource play: future wells will not be drilled under the same geologic conditions as the earlier wells. Additionally, future wells may not be drilled in a similar fashion (lateral lengths, number of frac stage, etc.) as the earlier population. And to make it more complicated the price of oil will determine what areas get drilled and which won't.
If one can make reasonably correct assumptions on all those factors then it might be a winner. No one today can prove how many Bakken wells will be drilled between 2015 and 2020. Thus no one can prove how much oil the Bakken will be producing in 2020. Assumptions can certainly be made to create that estimate. But it will take about 7 years to find out which of those models will win and which ones lose.
BTW: In the oil patch "winning" means making a profit. LOL
Data built on no model will always lose. What happens if the data shows a level output over several years. Suddenly the output drops. You lose because you have no model to explain the drop.The guy with the model does.
A model is necessary even if it is just a dead reckoning model. Humans cannot truly operate without a model with which they try to filter reality.
Models always trump pure data. No one would know what to do with the raw data unless there was a model. The math is there because it is quantity that holds more importance than qualitative aspects.
So you bring up incompetance of the modeller. All you can say is that the odds are likely that someone is more competant than someone else.
Science proceeds by picking from the best and leaving the crud by the wayside.
These arguments always come up and get refuted each time.
DC,
The scaling factor C0 represents something akin to a collection volume. Something needs to scale with the breadth and reach of the well site, and this was intended to work as a calibration for the average site.
A good analogy for this is the diffusive growth of oxide on a Silicon wafer (for a computer chip). The oxide growth thickness is limited by diffusion but volume-wise the total oxide is greater for a 12" wafer than a 6" wafer since we get to gather the oxide over a bigger area. Same goes for a fracing well setup -- how big a collection area is it scaled for?
In addition to the scaling, in the diffusion model derivation, the actual extent of volume is not precisely fixed because diffusing material can arrive from a significant distance from the collection point. That is why the cumulative continues to grow for the classical diffusion, yet is limited by the O-U kinetics as this puts an exponential drag on the distance that material can travel.
That is a very good observation. If we go back to the oxide growth example, the amount of oxide that grows is on the order of microns, yet the chip thickness is in millimeters which can supply potentially a lot of material to grow a much thicker oxide. In other words, the potential for a very thick oxide is there, but because the diffusion has diminishing returns with time, the oxide thickness is limited. The actual wafer thickness does not matter.
So we have to ask where that 100 billion barrel number came from and what it describes:
(1) Is it the amount collected if one waits 1000's of years?
(2) Or is it the cut-off point where the diffusional oil flow starts showing diminishing returns.
In the former case (1) that may be close to the C0 value of 3.33 million barrels
in the latter case (2) that may be where the O-U limit hits, which is a fraction of that available.
In the models of the NDIC data, the C0 value is about 15 to 30 times the value of what it looks like the actual model asymptote is approaching.
We have to ask first the basis of the USGS estimate, is it an OOIP or is it a URR?
But what happens if the C0 was like 15 to 30 times higher than 550,000 barrels?
For 30,000 wells this would place the OOIP at between :
low end 15*30,000*550,000 ~ 250 billlion
high end 30*30,000*550,000 ~ 500 billion
But who knows if that original estimate they made was just a SWAG. They really don't know the efficiency of the collection process, do they?
[EDIT]
Found this
Price, Leigh. "Origins and Characteristics of the Basin-Centered Continuous Reservoir Unconventional Oil-Resource Base of the Bakken Source System, Williston Basin"
Hi Web,
It occurred to me while on a long car ride that C0 may be more like a URR for "the average well", in other words in the O-U model the cumulative output, C(t), approaches C0 asymptotically as t approaches infinity. So using the 1999 Price estimate for OOIP of 400 billion barrels and assuming Mason's estimate of 40,000 wells is correct the "average well" would have an OOIP of 10 million barrels, if the average recovery factor was 5 % for the North Dakota Bakken then URR for the average well would be 500,000 barrels and if there are 40,000 of these average wells the ND Bakken URR would be 20 billion barrels.
Note that the "average well" seems to be declining by 20 % per year by Rune Likvern's latest estimate, so the actual URR is likely to be much lower. For the Bakken Medium Scenario using O-U diffusion (chart in my previous post above) the cumulative output is 6 Billion from Dec 2004 to Sept 2041.
DC
DC, I agree with your numbers.
This is another interesting way to plot the cumulative production curves. What I did was place the time axis on a logarithmic scale. This allows one to see the short times and also the asymptotic trending beyond the current value.
The model fits are Ornstein-Uhlenbeck diffusion. The scale and diffusion coefficient govern the early shape of the profile, while the O-U drag coefficent pins the inflection point at where the well starts to show limited flow.
The red square NDIC data sets shows a larger drag according to the model fit.
Hi Rune,
I looked at that well profile from your first link as well and the way I read that profile, the average daily output for year 1 is 679.5 barrels per day or 248,000 barrels in the first year.
However, I believe that your first year estimate (84,000 barrels) is much closer to reality. In my model, I get about 100,000 barrels for the first year but show a steeper decline with about 30,000 barrels in the second year. If we add your first and second year(45,360 barrels) estimates I think we are in pretty close agreement on the first two years of cumulative output (around 130,000 barrels cumulative output over the first two years for the "average well").
DC
Hi DC,
The number of around 130 kb as cumulative for the first 2 years (for wells in Bakken, ND) is a very interesting one.
From looking at NDIC actual data (and as far these 20+ % represents a typical and significant portion of the total) the number 130 kb cumulative (and crude oil only) for the first two years (as the average cumulative) has been with me since I started to look at actual NDIC production data for wells in Bakken.
- Rune
Hi Rune,
My post above was incorrect with regard to the first year of output as I explain below. My apologies.
DC
Elmo and Rune,
I had thought that Elmo's interpretation was correct, but I was wrong. The way to check that Rune is indeed correct is to add up the cumulative production, in the presentation they say it is 540,000 barrels after 29 years (the next slide after the figure.) If we assume that we need to average the output at time zero and one to get the average for the first year (248,000 barrels for the entire year) and we do this for the whole 29 years we get 700,000 barrels for 29 years. If we do it the way Rune suggests (159,000 barrels for the first year) and add up 29 years, we get 536,000 barrels. Based on that analysis Rune's interpretation is correct.
DC
I did this in another fork of this thread, but it looks like you beat me to it by 14 minutes... Not only that, seeing your numbers were not very similar to mine even after rounding I re-checked, and found I'd skipped year 11 8-(
DC (and KODE and WHT below), thanks for using the practical methods for resolving the inconsistancies in that graph. Not that I doubted Rune, but it is always nice to see an inconsistancy resolved numberically too.
Elmo, Rune - The first presentation Rune links to shows 436 b/d for year 1; not 486 as Elmo writes (it's easy to misread the 3 for an 8, but notice the diamond is closer to 400 than 500), nor 427 as Rune writes (he must be thinking of some other source).
Slide 11 of same presentation says "approximately 540 000 barrels" over 29 years. If I multiply the daily values given in slide 10 by 365 and add them, I get cumulatives of 859 210 if I include year 0 and 522 315 if I don't. If I instead assume the values are end-of-year values and take the averages of year 0 and year 1, y 1 and y 2, etc., multiply each by 365 and add, I get 689 485 (i.e. barrels cumulative production).
This supports Rune's interpretation of that graph; that the year 0 value is initial prod. and the rest of the values are yearly averages (522 in 28 years is "approximately" 540 in 29, I guess).
--
Rune, your second link above goes to a list of "Recent Presentations" of the ND gov. Not obvious which one of them (if any) you wanted to link to?
I think you guys are right. With my model-based fit, I get 550,000, which is a straight cumulative integration of a continuous function. This is also close to the 540,000 quoted.
Incidentally, the model fit is 3 parameters for Ornstein-Uhlenbeck diffusion versus 2 parameters for classical diffusion.
What it does is one parameter for the overall strength of the flow, one parameter to quantify the diffusivity, and the third is the drag on diffusivity (a kind of viscosity) which sets the bend location on the curve that you see.
It's pretty clear that three parameters are required, one to set the overall scaling and one each to set the two regimes of the curve.
KODE,
Thanks! I had several parallel discussions going on about the same subject, so..
https://www.dmr.nd.gov/oilgas/presentations/EmmonsCoFB101512.pdf
Hopefully the above link should do it.
And yes, from several 2012 NDIC/DMR presentations I have seen several figures for the average daily first year flow, 486 b/d, 436 b/d and 427 b/d. Appears the decline comes with time, newer presentations 427 b/d.
- Rune
The PR battle for unconventional gas - in Australia coal seam gas companies have turned to a respected rugby player to present their case
http://www.aplng.com.au/darren-lockyers-journey
Note in those areas the farmers cannot stop drilling. However the search for new drill sites is running into resistance so the resource may never be fully developed.
Between the years 2013 and 2055 figure 1 projects that North Dakota will produce about 11 billion barrels of crude oil. That is several times larger than the amount of technically recoverable crude oil that the USGS estimates to be in the Bakken. Where else could the oil be located?
The USGS study is outdated.
Is this something you know for a fact? Has it been revised upward? If so, I must have missed it. The only USGS revisions I'm aware of have been downward revisions.
The USGS is already doing a new Bakken study which will be out sometime this year, if I'm not mistaken. The fact they're *already* doing a new study is, in effect, an admission the one they did in 2008 is already outdated.
The results should prove fascinating and controversial no matter what they report. If they revise downward, that would be consistent with other revisions they have done and could throw cold water on recent predictions of continued production growth. On the other hand, if they revise upward that will raise expectations of energy independence even higher than they are now. Yet as we see in this post the cost of just maintaining current production levels is quite substantial. I think the whole Bakken situation is playing out like a serial melodrama that will provide much more in entertainment value than it will in energy independence.
Well, when the total area under the production curve exceeds the total (theoretical) amount of technically recoverable oil, it means the scenario in Figure 1 can't happen regardless of price. It's just basic mathematics.
That leaves open the interesting question of, "What WILL happen?" In the oil industry, the usual scenario is the standard Hubbert curve - a steep rise followed by an equally steep decline. There are various reasons for this, but the usual result is some kind of bell shaped curve, or a variant on that.
The oil industry has been around for over 100 years, There have been a lot of wildly hyped oil plays, and people always argue, "This time it will be different!", usually people promoting oil company stock.
The question to ask is, "WHY should it be different?" There has to be a reason. What is different? Remember, hydraulic fracturing is over 50 years old, and horizontal drilling isn't much newer. What's new?
The article indicates a frack well cost in the order of $2M. I have seen quotes of well costs circa $10M (for shale gas).
Are there any reliable statistics on well costs for US? Or am I being too naive to ask this?
Any suggestion is appreciated!
I think Rockman commented on this a couple of drumbeats ago. As I read it, the drilling and the fraccing components of the well completion can be considered as separate operations: The well is drilled and the well bore cased. The rig is free to move on to drill another well. Wireline units are then brought in and used to isolate, perforate and frac stages of the well bore.
The drilling costs may be more or less consistent from well to well, but the frac costs will ramp up if you decide to have 10 or more stages fracced, hence the variation in the cost of fraccing you may see reported.
This would also be an interesting extension of Rune's observations above: is that 'average well' production obtained from a similar distribution of frac jobs, or are wells being fracced more intensively to obtain the same production? That's the 84,000 barrel question...
You peq..peeke.., made me curious. I understand that tools can be lowered down a well and pulled up (hopefully) with a wireline but how do they get around the horizontal bit without changing the rules of gravity?
NAOM
Wireline tractors, no, not John Deer tractors, but electric driven wheels to pull the wireline tools down hole.
http://www.youtube.com/watch?v=r_rzKjEPmI0
http://www.welltec.com/SPE-136535.aspx?ID=320
Ahh, thanks, just trying to imagine getting a JD down one of those holes. That video makes it clear.
NAOM
naom – Actually there’s an even more common way to log a hz well bore - LWD: Log While Drilling.
http://en.wikipedia.org/wiki/Logging_while_drilling
There are actually logging tools that connect right behind the drill bit. Even more spiffy is how that data in transmitted to the surface in real time: Morse code. Actually much more sophisticated but same principle. And not by a wire but transmitted by pulse variations transmitted in the drilling mud. A huge amount of complex data is transmitted this way. We can also attach the logging tools to the end of the drill pipe and log that way after the hole is drilled. Folks like to think frac’ng is some big game changing tech but it’s impact was tiny compared to LWD.
I’ve geosteered many wells. Doing so in a shale is no biggie. Now try keeping the drill bit in the top 3’ of a sandstone reservoir when you don’t exactly know where the top is. Enter LWD. I interpret the log data in real time and adjust the course of the well bore to stay in that sweet spot. I might adjust the hole angle from 90 degrees to 91 degrees to stay there. I once kept the drill bit in the top 5’ of a reservoir for along a 5,000’ long lateral. Geosteering is the most fun a geologist can have on a drill site. Amazing technology to say the least. And often done with 2 or 3 hands with me stuck in something like a shipping container that 6’X12’ sometime for up to 24 hours a clip. But sometimes the bit doesn’t go where you tell it to go. As often is the case Mother Earth has the last call.
Rockman,
I am not too familiar with how far your budgets go with land rig operations. Do you mainly use rotary steerable assemblies or mud motors. Offshore mud motors are really restricted to surface holes and kick offs to side tracking?
What sort of tools are you running in your BHAs, PWDs (pressure while drilling)? Really helps with a tight fracture pressure window. Stethoscopes (formation pressure)?, I realise you would be using the standard MWD/LWD package. You are correct wireline is getting less and less these days, but MDT (formation pressure & samples) and perfing (punching holes) are still widely used offshore with the use of tractors in deviated holes.
pusher - As far as BHA's go I try to keep it as simple as possible and avoid as much jewelry as possible. Use the high price spread when only absolutely necessary. I used the Stethoscope once in offshore Africa and that was truly amazing...it worked!!! I’ve seen the tractors at OTC but that’s as close as I’ve gotten. All my offshore horizontals were open-hole screen completions so I’ve never had to perf at 90 degrees.
I think you misread
Currently it is estimated to cost $2 million to frack a well, and in January there were 410 wells waiting on that service.
If a well completion is running ~$10 million that indicates the frac' job accounts for about 20% of that cost.
Thank you and the commenters above for the clarifications.
My question was indeed, whether there are reliable cost estimates for completed fracced wells.
Sgouris - What's your goal behind your question? That will make it easier to provide you with a meaningful answer. Not meaning to sound flippant but it's like asking what an automobile costs...a wide range for sure. I've seen drilled and frac'd Eagle Ford Shale well cost $4 million and another EFS well where the just frac alone cost $9 million.
Rune, do you have any sense of what the upper limit is on the number of producing wells that can be brought online in a year? 1,200 seems like a big number to me, but I don't know squat about what is possible. How does that number compare to recent years?
Also, it would be interesting to know how any new producing wells would need to be brought online in order to maintain the recent upward trend -- that's the trend that many seem to expect to continue.
One more thing, your well count doesn't include non-producing wells that are drilled during a year (exploratory wells, dry holes). Do you have any numbers on those?
Thanks for the great work.
Kingfish,
During 2011; 1 211 additional producing wells in Bakken (portion in North Dakota) were reported by NDIC.
Jan 2012 - Nov 2012; 1 635 additional producing wells in Bakken were reported by NDIC.
It should be possible to bring in a lot more wells by adding rigs, crews and scaling up other services that are needed to add producing wells.
However there are several other factors at play; weather, cost developments, oil companies budgets (some companies were reported to have spent their 2012 budgets by late fall 2012 thus not able to continue activities through the remaining of 2012), companies strategies (companies will normally deploy strategies that offers the prospects of the highest Net Present Value (NPV) for their projects, and this may be at odds with “drilling like there is no tomorrow” and provided they hold acreage by production), access to capital (debt), economic risk management (how much debt a company feels “comfortable” with, expectations to future price developments, etc.), infrastructure in general (roads, transport of oil and natural gas, natural gas processing, potential changes to regulations and taxations (like present discussions in ND about taxing natural gas that presently is flared), development in well productivity (which since 2010 has been in general decline).
I do not include exploratory wells.
Further (production) wells that are dry and wells with little or little and erratic production are not included in the data I used to define “The average 2011 Bakken well” with.
Dry, tiny flow and small, erratic flow wells is somewhere around 2% of the wells.
Did the above bring us any further?
- Rune
Dry, tiny flow and small, erratic flow wells is somewhere around 2% of the wells.
Thanks for that stat. That is why the Bakken has been attractive for smaller operators who cannot come up with the ante for something like a deep water play. That fact also seems to indicate some very reliable production/price point forecasts could be modelled.
And this is how they are shipping all the oil to market.
By train. Alan would be so happy, maybe they need some electric wires though.
With maps as well.
http://www.rbnenergy.com/crude-loves-rocking-rail-the-bakken-terminals
thanks for the link, the next installment should flesh things out quite a bit
In the next episode in this series we will provide more insight into the ownership of these Bakken terminals, the destinations that they can reach and the costs associated with loading and shipping crude out of North Dakota
One thing I don't have a handle on: are multiple pads pipelined to storage tanks and then those tanks piped to rail terminals or long distance pipelines or is there a lot of truck transport of crude from wellheads to centralized local storage/transport facilities? With the fast well decline rates it would seem some important trade offs exist in crude delivery logistics. These logistics might also make sweet spots look sweeter than they are (individual well production wise) as crude delivery infrastructure would favor production in areas better served pipe/rail bulk terminals.
It is interesting to speculate on what the result of the US Tight Oil uptick added to US demand destruction may lead to, especially if this does lead to a withdrawal or reduction of the US from major international oil markets as a customer.
In particular with the Middle East and especially if this boom in US production is as temporary as reports here argue. Is it not possible that the medium term outcome (2020s?) is the US being shut out of ME oil markets and influence because of the retreat that this short term boom affords?
Instead of a great 'independence' rather the ceding of influence and relationship with the US's previous suppliers to Chindia? By yielding this market to the new growing economies now it may be a great deal harder to break back into them when the unconventional oil declines and in the absence of any real moves of scale to shift the economy away from oil dependence....?
Add to that the possibility that the big conventional fields may well hit decline at around the same point that the US finds the Baaken dropping off sharply. Perfect storm built on the back of mischievous encouragement of infinite BAU as reported in the MSM...?
Big national security risk, much? Any sophisticated debate in policy circles that acknowledges the only answer is to use this resource to build permanent resilience in energy supply and use. Beyond 'Drill, Baby, Drill' of course.
Is it not possible that the medium term outcome (2020s?) is the US being shut out of ME oil markets and influence because of the retreat that this short term boom affords?
Well budget issues have us back to one carrier in the mideast. Is that the influence you are referring to?
Otherwise its 'who gots the money honey?' We do spread ours around when it comes to oil...so far dollars are good...
Currently we get about 20% of our foreign crude from the Persian Gulf--I'm betting quite a few countries with virtually no domestic production get a whole lot bigger percentage from that region. About 50% of US imports come from from Canada, Mexico and Venezuala. Of course the production from the latter two has be dropping for a while and their exports have been dropping even faster. The US uptick in production has just made it so that drop hasn't been felt as keenly in the world market...just yet
So I'd say you phrased you question a bit narrowly--hope you don't mind my 'little' edit.
Big
nationalglobal security risk, much?I'm just looking a little further ahead than you. Isn't it possible that the US may sometime this decade not buy even that 20% from the ME? Through continued demand destruction and growth in NA unconventional supply? Isn't that's what's meant by this idea of 'Energy Independence'?
That is the loss of influence I'm talking about; if you ain't buyin', they gonna be dealin' with others. What looks like a great thing, not having to deal with them Oil Sheiks for a few years, could become problematic later is all I'm thinking.
And no I'm not talking about carrier groups, over-spending on the military is the way every empire accelerates their decline..... And the US is more than following the textbook on that one.
Is it a global problem? Well not like Climate Change is looking. But a suddenly energy hungry US that's been told it has a divine right to 'independence' and still full of SUV 'burbs faced with a ME all tied up in long term contracts with Chinidia and declining Net Exports everywhere [a lá Westexas]:
Sure that's a global problem.
Especially as Gergor [gregor.us] argues despite US size, wealth, and power, its wasteful use of oil means that the more efficient new users are pricing it out of the market...?
But a suddenly energy hungry US
The word you used that I emphasized has been central to discussions on this site for years. At least a couple key posters here had that sudden hunger occurring well before Obama had a chance to deliver a second inaugural address--though one of the mainstays here yet had a complete financial meltdown happening first (that would be about two years past by now). 2020 is less than seven years out--wonder how many resets those predictions will get before then? I go back a bit, but the cry "the end is near" goes back a whole lot further. Still 'sh*t happens.'
Suddenly is possible--but that would most likely result from extended oil delivery disruption--you know the kind of thing that would happen when a whole lot of oil tankers quit leaving wakes overnight. War is always the wild card but the unprecedented interconnectivity and interdependence that defines the world economy makes a WWII type outbreak less likely than it used to be.
If the market more or less limps along functionally look for the patterns we have been seeing to rinse and repeat, slowly wringing US oil use into a more efficient state. But if exportable oil supplies start shrinking quite a bit faster look for lots of countries who may use oil more efficiently but produce very little to sell on the world market (or in their own markets for that matter) to be wrung out of the oil market before the US is. That could well create regional pressures that have a chance of completely upsetting global security if they cascade just wrong. That is how I meant my edit.
A little farther out, the water issue dwarfs our little discussions here about oil. Well maybe it's two water issues:
--too much water where and when our systems can't handle it
--not enough water where and when our systems depend on having it
Yeah, yeah, plenty of comfort in the rear-vision mirror.
But you seem to be wilfully ignoring the scenario I describe, and it is specific to the Tight Oil boom as generally discussed on this forum: A false sense of security founded on the appearance of a relatively short lived resource SUDDENLY declining in the minds of the public ['100 years of energy independence'] just as declines elsewhere in the global market can also no longer be denied. Added to the likelihood that those suppliers who used to have a continuous supply deal with the US having new more reliable relationships to the east.
Of course predictions are foolish but this looks like one possible outcome, an ironic result of the Tight Oil boomlet.
Anyway doesn't the ELM model also offer a surprise 'where's our oil' picture; everything rosy till it ain't?
I do agree that above ground factors will almost certainly provide the straw that breaks the camel's back. Or the bullet that shoots the Archduke. And the big one will probably be as absurd as the assassination of a petty Austrian royal in an obscure yet strangely fateful town by a depressed member of an outfit called 'The Black Hand'.
Yet there would be no vast consequences from this comedic event if the world wasn't already on a knife-edge. And describing the the very keenness of that knife-edge is what this site does best, n'est pa?
Water, yup, thars a problem too. Though not where i am unless the Global Weirding turns out even weirder than most predict.
Highly pluvial. Awfully auto-dependant.
Jury is still out on the length and size of this tight oil move (the last 'definitive' prediction given about maximum Bakken production on this blog has been surpassed by about a factor of three in the couple or so years since it was made), a whole lot depends on what price levels are maintained for how long--remember my caveat about the market more or less limping along functionally--I didn't ignore your scenario. You apparently didn't follow the EIA link to see just how much oil the US buys from where--its a broad net we cast and we aren't in danger of producing ourselves out of the buyers market any time soon.
The oil independence so bantered about in the US press these days had been qualified into North American oil independence by mid presidential campaign. Last I heard Canada was free to sell their oil anywhere in the world they wanted. And last I heard Canada had no intentions of producing the amount of oil those oil independence spouts require. Nor is Alaska in much danger of producing the two million barrels a days spouted about as forthcoming in the same pieces. Very little chance of the US not being at least the second biggest player in the world oil import game for a long time to come, barring 'the whatever' that is. 300-350 million barrels of oil imports a month isn't getting replaced by any domestic production coming down the pipe--demand destruction isn't all bad when keeps a few more dollars from flying off over the border.
$3-4 gallon at the pump is all the average American sees, the oil independence spout gets no play in the all powerful household budget. People have got used to those 'astronomical' prices in less than five years. That numbers starts to bounce in the $5-6 gallon after a couple/few more years that is what will stand out not talk of oil independence.
True.
Anyway just using less is the more important contributor to the lower import number. Can that continue? Or if it's involuntary, will it continue?
Patrick – “Isn't that's what's meant by this idea of Energy Independence”. You bring up a critical point that I’ve asked previously: before we start predicting “energy independence” it might be useful to define exactly that that means. Here is my take. First, energy independence can mean we have no need of energy sources. Obviously no one is subscribing to that notion. It could mean a state in which we have no need for fossil fuel energy sources. That’s certainly possible if we replaced all our energy sources with the alts. But that doesn’t appear to be remotely possible any time soon.
I gather that most assume energy independence means no need to import energy. But some seem to add the provision “no Middle Eastern” imports. That’s certainly a possibility given that a relatively small amount of our energy comes from that region today. So if Canada can continue to expand exports to the US as our other two prime sources (Mexico and Vz) decline that rather narrow definition of EI might hold. But IMHO the sources of our energy imports are invisible to the public and economy. We spend upwards of $200 billion yearly on oil imports today…does it make any practical difference to whom we write that check?
Now let’s set aside the source of our imports and consider the consumption side of the equation. Again a need for some definitions. If I get fired and can’t get another job I’m not “employment independent”. If I’ve put enough money away and retire at age 50 then I am “employment independent”. And thus the debate rages over exactly how we’ve reduced our energy consumption in recent years. What has played the bigger role: conservation and a sudden realization we need to reduce FF consumption to help the environment or an inability to pay for all we desire? A very important model of our future potential to be energy independent IMHO. If the US economy eventually regains a higher growth profile are we going to continue the current lower energy consumption VOLUNTARIALLY? Everyone can make their own guess. Will developing more alts fill any gap between increased domestic energy demand and FF supplies? Make another guess.
And if developing countries can outbid the US consumer and let’s say more Canadian oil flows to Asia then the US does that push us closer to energy independence? And that brings us to another definition: the supply/demand balance. IMHO US demand will always be met by sufficient supplies. Is that the real definition of EI? Which isn’t to say the US will be able to acquire (either domestically or imported) the energy it needs to prosper. It means it has access to all the energy it can AFFORD to buy.
And what does this bit of verbiage I spewed out mean to the US consumer? Absolutely nothing IMHO. I have no doubt that when the vast majority of the public hear “energy independence” they think mostly of cheaper motor fuel prices. And that makes them smile. And there are few politicians who don’t like being associated with anything that makes the voting public smile whether it makes no sense or even if it’s not true. . The popularity of the phrase “energy independence” is thus easily understood IMHO. And as long as no one tries to explain to the public all the underpinnings of that phrase they’ll keep smiling.
Oh yes I agree. In particular what is meant by energy independence is meaningless at the pump, and meaningless in terms of freeing the economy (and environment) from the FF addiction.
But here I am interested in the particular political implications of may look not unlike the isolationist policies of the US of the early part of the 20C. A sort of retreat, in the extremely important FF arena, to the Western Hemisphere. Perhaps this is just more interesting to those of us outside the US?
Anyway it can't be denied that any withdrawal of the US as a ME energy customer, if it occurs, brings opportunities and challenges for all parties. Hopefully for the US it would mean a less clumsy, brutal, costly and largely tragic relationship with the region, perhaps not? Must be tempting to get the hell out of there, no? Leaving the special problem of the US and Israel relationship aside.
Without US muscle and meddling so much things could get very interesting there.... Anyway always appreciate your wisdom ROCKMAN, I have learnt a great deal here. In particular it has made reading the PR from the oil companies operating here much more decipherable!
Patrick - "Hopefully for the US it would mean a less clumsy, brutal, costly and largely tragic relationship with the region". I have little doubt that even if we were getting 100% of our imports from Canada the US would still get involved in military adventures in other oil producing regions to keep the global price of oil stable.
A long front page article in the Fort Worth Star Telegram regarding a range of more pessimistic per well EUR's for the Barnett Shale. Three sources are estimating that average EUR per well will be about 33% to 47% of the most optimistic industry estimates of about 3 BCF per well.
Report questions long-term productivity of gas wells in Barnett Shale
Read more here: http://www.star-telegram.com/2013/02/12/4617558/report-questions-long-te...
Recent material from IHS
http://unconventionalenergy.blogs.ihs.com/2013/02/05/us-tight-oil-plays-...
North Dakota oil production reaches nearly 769,000 barrels/day in December, a new record
That was achieved with an addition of 117 producing wells that month. We will see of activity again ticks back up 150-190 new wells on line a month come better weather.
the link you gave is slightly different than the one I used to tabulate monthly well additions up the page
https://www.dmr.nd.gov/oilgas/stats/historicalbakkenoilstats.pdf
that one has this asterisk note
* Includes Bakken, Sanish, Three Forks,
and Bakken/Three Forks Pools
the page I just linked shows 127 well additions for Dec 2012 and the Nov 2012 well additions now totals 121 instead of the 115 I came up with using the same link the other day before Dec 2012 was added. A bit more transparency by ND would be appreciated.
One table is the whole state, one is just for Bakken.
I've noticed they often correct/update figures for 1-3 months back when the next report comes out.
Yes, and those revisions are usually upward.
November was first reported as ~733K bpd, now it's at ~735K bpd, for example.
... and why is there not a link in that table to the database or files with the original numbers it was drawn from?
What exactly is the state of NoDak trying to hide?
Web, I suspect the ND staff is underfunded, understaffed and overwhelmed. Increased transparency certainly would be appreciated. The Texas RR commission has been at this game a long time. ND is got thrown into the very deep water very quickly. Possibly a little dialogue with the ND departments responsible for the numbers would be more helpful than recriminations at this point.
The state of ND is hiding nothing. You can access a wealth of data here, though in some cases you need to be one of their subscribers.
This in fact is a state government hiding public data:
Now, isn't it kind of obvious that NoDak has the information used to create the rolled-up table in an accessible format? All they have to do is make that freely available again. They had it up before before they started hiding it. What has changed? The state obviously have more tax revenues now than before. They have in the past suggested that their servers can't take the load.
They claim that this is done to "defray the costs" according to recent regluations:
The question is whether it is worth mailing in a request with $50 to get a subscription.
If you can't spare the $50, maybe you can ask fellow posters of TOD for donations.
The little known fact is that the NoDak agency had all the data up on their web site early on, but then removed it all.
There was some reason that they did this, vaguely related to the data being "too popular". It's not as if the state is incompetent as a whole -- after all they do have the only state-run bank in the nation. They must have some significant tax revenues as well.
Somebody here in the last couple of weeks was bemoaning this issue as well, and said that a FOIA wouldn't work.
I just can't imagine the requests for data multiplying exponentially as the ND shale play get more and more amateur scrutiny from around the globe. I can't imagine the ND state legislature coming back to the oil data compiling agency--after it requested a hefty budget increase to cover the increased info demand--and telling it to get user fees to cover and moderate the demand.
But oil industry influence in ND may have had something to do with the change...the industry has had a whole lot influence on the Alaska state agencies that deal with it. It works that way when one industry pays almost all of the state' bills.
Just for fun why don't you see if you can find that kind of data on North Slope wells. Considering the oil is actually owned by the state of Alaska you'd think the detailed data would be pretty accessible. Heck I can't find monthly shipping tonnage and revenue info for the Alaska RR on the web (if its there I've given up trying to find it) and that RR is owned by the state.
I also suspect the NDIC and the ND legislature decided to start charging fees for access to some of the data ... simply because they could. When you've got something which suddenly is in great demand, why give it away for free?
I work with geographic data and I know a lot of state and local agencies are very touchy about giving away their data for free. For example, if you want any geographic data from the City of Seattle, aside from some basic stuff, you've gotta pay for it.
Web - Very odd action by the ND regulators. Every bit of data held by the Texas RRC s available to the public.Granted there so much data it's a big task to go through hundreds of thousands of files. In fact, any one can wak into the TRRC offices in Austin and check out data just like a ibrary. And there's no charge because the system costs the state nothing: the TRRC is funded by the fees collected from the oil patch.
And the data is more manageable going through a private service like Drilling Info. All Excel daa sets. Costs about $200/month. Chump change for a company like mine that has spent $200 million over the last 3 years.
IMHO there can be no good excuse for the ND actions
The demand for public data is really exemplified by the rabid right-wing. This is continuously requesting data in which they can create some sort of gotcha situation. This request is just from this morning:
http://wattsupwiththat.com/2013/02/16/another-document-cache-from-noaa-v...
CEI = Competitive Enterprise Institute
It makes our requests seem a bit mild by comparison.
It looked like you could wade through and get individual well data if you knew each well's coordinates and operator at the ND site. That would be some wading. If the state of ND's data available for fee compares favorably with the TRCC stuff available from Drilling Info I can see how the opportunity to get a bit more operating budget for the data collection/organization by having the state getting paid for its service might be popular.
Mind you the TRCC data is not free, state labor and resources go into it, the oil patch money that goes into that could be added to you rainy day fund if TRCC decided to cover its detailed data distribution costs with fees. Not saying that would be a particularly popular move or that it would generate even a drop in the bucket. But like I said up thread TRCC has been at the game in a big way for a long time. ND got thrown into very deep water very fast.
One other little difference between ND, Texas or even MN where I believe web hangs. ND has a population fo 700,000, Texas 26 million. Your state is has 37x as many people as ND. Even litlle Ol' MN has close to 8x as many people as its next door neighbor. It would be interesting to see how much the state budget per capita is in each state.
You mentioned Minnesota. The Minnesota DNR has all sorts of interesting data free for the taking.
For example, a few months ago, I pulled down all the lake ice-out dates that they had accumulated over the last approximately 150 years. I posted it here:
http://theoilconundrum.blogspot.com/2012/09/lake-ice-out-dates-earlier-a...
This was nicely formatted XML data, that I slurped up and then plotted to satisfy my own curiosity (and test out some automated server software I was working on). The results were disturbing in that you can see how much shorter the winters are getting, without resorting to temperature records to verify this.
Nice presentation. Any ideas why the center of the state shows least change? The slope descent though pronounced isn't near as great what we see since 1979 for most months when looking at the arctic sea ice extent. 'Changing everywhere but fastest in the arctic' looks to be verified by a comparison of MN mid continent lake ice out dates and the arctic ocean sea ice extent. Though likely the ice out dates woul show a more pronounced slope if you only went back to 1979 as well
Noise. Something has to show the greatest change and something has to show the least change.
Luke – If we just talk about keeping a running tab of the production from the wells that’s relatively cheap to do. Once the well is set up in the system companies submit the new monthly production and a data entry tech just inputs the well idea number and that new monthly volume. No geologists or engineers required. And many companies submit the data digitally over the net so the update happens in nanoseconds. There’s no financial excuse for not providing updated production info for every well in ND, Texas or any other state. The rest of the TRRC regulatory duties are much more labor/capital intensive. Production accounting ain’t. Shame on ND! LOL