a linear extrapolation of oil consumption by demand growth, production growth, and demand elasticity
Posted by Prof. Goose on January 22, 2006 - 1:19am
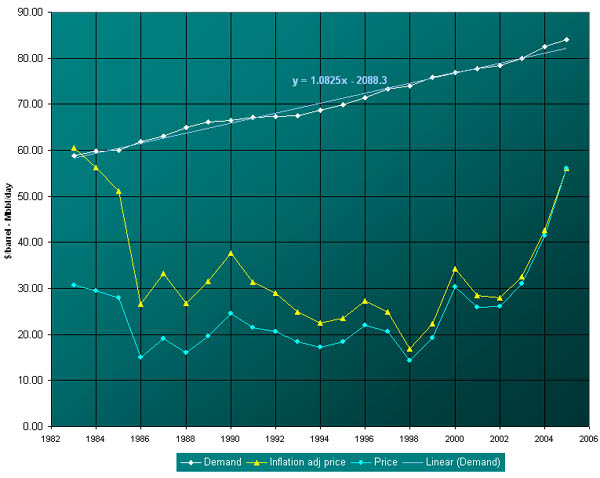
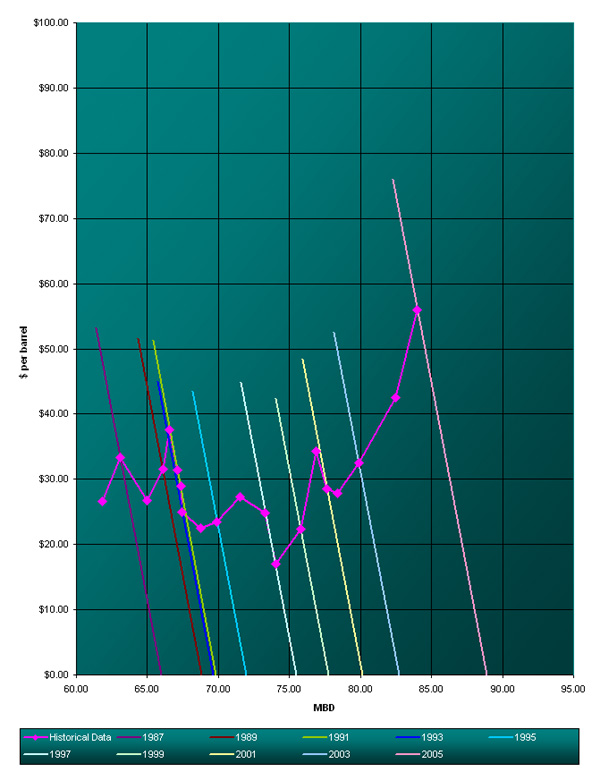
Demand has increased since 1983 in a very linear fashion, with a growth of 1.08MBD(Million Barrels per Day) per Year. This can be represented in the supply-demand graphs below by a steady shift in the demand curve from left to right as we move forward in time. Also, at any given time the demand for oil is very inflexible; price has little effect on consumption within a certain range around what, at the time, is considered a “normal” price. In my own experience, I can cut out the impulsive run to the hardware store on the weekend, but I still have to get to work every day. This makes the demand “curves” quite steep for any point in time. To try to get a ballpark WAG on what the slope might be, I looked at the data around Katrina, when we had a price spike of close to $10 and a consumption reduction of about 0.87 MBD (Million Barrels per Day), for a slope of about $-11.50/MBD. In this simple, linear model this slope, shown below, is one of three very important parameters in trying to predict future prices, and as I mentioned, $-11.5/MBD is a WAG.
The second important parameter is the rate of demand growth. As we saw in the first graph, demand has grown at 1.08MBD/Year since 1983 (least squares fit). But if we fit the data from 1993 forward,
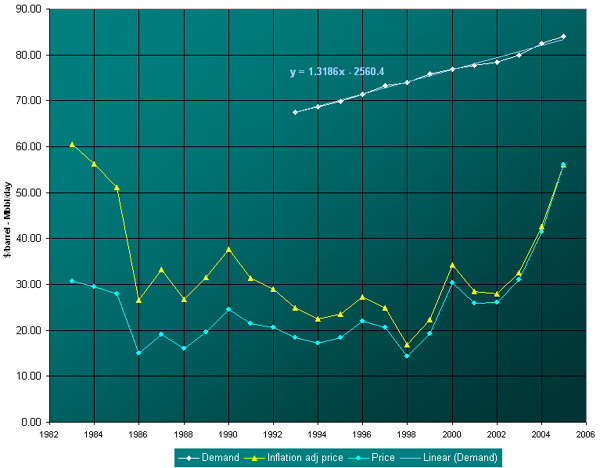
we get growth of 1.32MBD/Year. And looking at even more recently 2002-2005, we get growth of 1.95MBD/Year. Interesting that growth seems to be accelerating even in the face of the recent steep price increases (think India, China, and everyone else who wants what we have). The third parameter is either the value for peak production, or the rate of increase of production per year if peak is not imminent. Let’s pick my WAG slope of $–11.50/MBD for demand, a middle-of-the-road demand growth of 1.5MBD/Year, assume production can grow at the same rate as 2004-2005, and try to plot the future.

The supply curve (labeled Historical Data), until the late 1990’s, has been pretty flat – producers have been willing to just pump more oil with little or no increase in price, to appease the shift in the demand curve. But if Peak Oil exists, and we are close to or at that point, then supply has an upper limit, so the supply curve starts to go vertical. In the middle-of-the-road example above, the average price of oil is predicted to increase about $12 per barrel per year.
Now, how about playing with the parameters. Some have argued that demand cannot be as inflexible as computed above. Economists put short-term elasticity around 0.2. By my amateur calculations, for $56 per barrel and 84MBD, that equates to a slope of $-3.36/MBD.

Regardless of the more elastic short-term demand, we are looking at $100 per barrel sometime in 2008, if production increases at the current rate. What is not shown or predicted, is how high the price must go before demand GROWTH begins to falter.
Now let’s see what happens if 85MBD really is peak production. We’ll keep the same demand slope, and assume that demand growth will be impacted and reduced to 1MBD (it has to if 85MBD is peak):
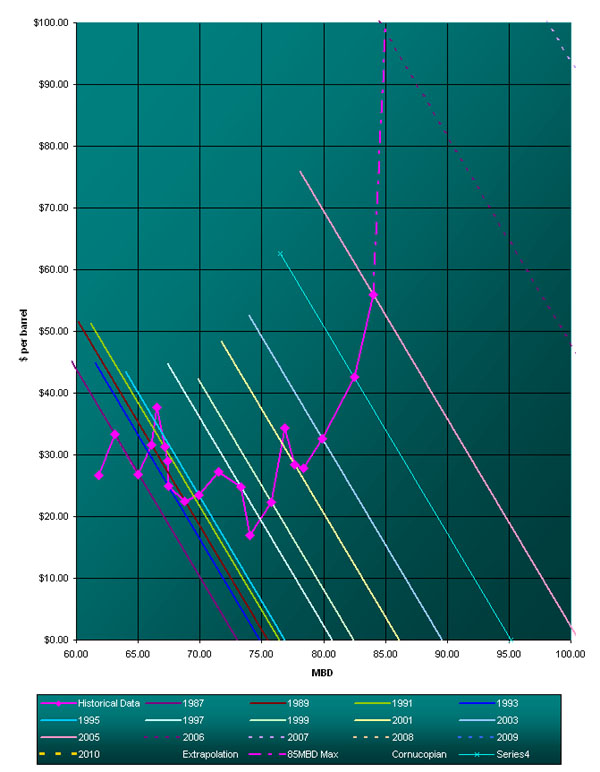
If production peaks at 85MBD, we’re looking at $100 oil this year. Even if demand grows by only 0.5MBD per year, we’re looking at $78 this year and $100 next year, again assuming a steady demand growth.
Finally, a look at the Cornucopian view, where the price of oil actually drops to $35 per barrel next year, in the face of 2MBD demand growth per year (Steve Forbes, I believe it was, predicted this late last year):

The world would have to increase production this year to about 92 MBD this year, or an increase of 8MBD. I don’t think anyone anywhere is suggesting that sort of increase.
So, pick your favorite scenario. I think this next year will really start to reveal the true status of Peak Oil.
a linear extrapolation of oil consumption by demand growth, production growth, and demand elasticity
PDF version
107 comments
a linear extrapolation of oil consumption by demand growth, production growth, and demand elasticity
PDF version
107 comments
Contact
- Content: editors at theoildrum dot com
- Tech support: support at theoildrum dot com
License

This work is licensed under a Creative Commons Attribution-Share Alike 3.0 United States License.
Great post, but is there anyway to
make the graphs, so users can click
them and they enlarge?
I can only see the left 3/4 using
Explorer and junk monitor.
I can't imagine how high oil would be right now if we had a cold winter.
If I was your average Joe, that knew nothing about the coming oil problem and saw these graphs I would be horrified. Even someone saying we will have 70 dollar oil for the next 10 years and peak won't hit till 2015, would be considered a Cornucopian in my mind.
Recommended for anyone who can't see all the graphs. (maybe I'm the only one)
I also like the LinkChecker and CustomizeGoolgle extensions.
Get the Adblock extension. The Internet without ads is a beautiful thing.
And get Launchy, for the small number of sites/pages that don't display properly in Firefox.
BBCode is very handy, too. It allows you to insert links, images, formatting, etc., into HTML and PHP boards very easily.
This isn't a hard constraint. There are lots of easy ways to commute with much less gasoline: ride a scooter, van pool, take the bus, bicycle, telecommute etc. Look at NY during the transit strike. They forced every car coming into Manhattan to carry at least 3 people, and people arranged ways of dealing with it in a day or two. If a similar system were announced nationwide in the U.S., the oil speculators would be trampling each other, running for the exits. There are lot of non-price ways of adjusting elasticity. See Saving Oil in a Hurry from the IEA. So I don't think we can really make the assumption that demand will always be inflexible. How flexible will it be if the government makes carpooling mandatory?
I would add to your comments that any talk of the price elasticity of oil demand has to be extremely specific in terms of three things, two of which are very hard, if not impossible, to model:
The easy one is the size of the price increase. The demand response will be non-linear with respect to the price change (hence the fact that they're demand curves and not straight lines). Over a pretty broad range, the larger the increase the ever larger the non-linear demand response.
The timing of the price increase and the demand response. If price creeps up over several months, people will adjust much more slowly and less in absolute terms than if the same percentage price increase happens in a week.
Market psychology. After the hurricanes we had a lot of very spooked drivers in the US. People were scared that they wouldn't have gasoline to get to work or the food market. Just as people started to get serious about minimizing their fuel use, prices came back down.
I'd also toss in a reminder that we simply don't know how people will react to truly high prices in the US. The price level in 1981 and 2005 were, adjusted for inflation, almost identical. But we still haven't seen what the US consumers will do when faced with months of gasoline prices above $5/gallon. (That price, in 2006 dollars, is my personal, seat-of-the-pants level for the lower bound of genuinely high gasoline prices.) IMO, at that price level we're deep into unchartered waters, and we could very well see a level of commitment to conservation rivaling or even surpassing anything the US did in WW II.
IMO demand reduction in US will not come through high prices but through shortages. All things being equal people will continue driving even with 10$ gallon because there is simply no real alternative. Yes they will drive less but not that less than you think now.
The SUVs must go, and before too long, one way or another. After all, they (and their associated mentality) are the real reason the 'american way of life' is in peril.
If you have an SUV sell it now, before it becomes worthless.
Business as usual will soon not be an option, the planet has said so and is not going to negotiate.
Eco-terrorists will not be needed. The people who are stuck owning the things will find them to be such albatrosses that they will torch them themselves and try to collect the insurance. In the end eco-terrorists would get the blame, I suppose.
Sleep on friend's couch to be within walking or biking distance - OK for three day strike, gets old and intolerable really fast.
Bus - slower than molasses even when it deigns to show up. In most places, a ten minute drive becomes an endless ninety minute ordeal. One's time must be utterly worthless (but why, then would one be commuting?), or else gas must exceed maybe $15/gallon.
Scooter - generally incredibly dangerous. Useless in winter.
Bicycle - generally too dangerous. Often useless because banned from U.S. bridges and tunnels. Useless in winter snow and ice. Socially useless in summer, few places have any showers, much less enough showers.
Van pool - very practical in densely populated Manhattan. Elsewhere, endless ordeal like bus.
Telecommute - can be practical, but it's not our decision, it's our boss's decision.
Car pool - OK short term, but bosses will not tolerate the scheduling constraints for long. Only the tiny unionized sector still has any rigid 7:30 to 4:30 jobs.
These alternatives are generally impractical without forceful legislation. That would many businesses, taxpayers, and transit providers very, very unhappy. Employers told to install showers, to allow telecommuting, or to allow European-style uniform working hours (I once witnessed Belgian labor police swarming a small business at 6PM to make sure all the employees were out of the building), will yowl to the heavens. So will shiftless bus agencies asked to become actually useful by doing better than "just show up when you happen to feel like it".
Without making the alternatives practical, just stranding everyone who doesn't have a child or two to plop into the car to meet a police-enforced minimum headcount is not the most workable or equitable long-term plan.
They can also move back to the city, where there are lots of eager workers, all in walking distance.
In most areas, employment is more centrally located than housing. There is usually no single location that can be described as "near the workers."
Fly In the Oil
I'm just an engineer too, so maybe I don't get it. You international economists may be able to straighten it out.
As long as the US doesn't represent 100% of world consumption, I can't help thinking that the devaluation of the dollar (both historic and projected) must somehow be considered in any scenario involving worldwide price and demand calculations for oil or anything else, but I don't usually see any consideration of that at all. For example, a high oil price in USD should have no immediate effect at all on China's, Japan's or Europe's consumption of oil, if the values of their curriencies increase accordingly, until (if, unless) their dollar sales of export of goods fall enough to cause readjustment of their oil consumption levels. It would be interesting to see the analysis based on (assumed) constant (1970?) dollars.
Runaway Train
Oil price adjustment through the international economic path might not be seen for 1 to 2 years, which might result in a very high overshoot in the USD price/BBL, making recovery from all after-effects all that much more difficult. In fact, would it not be entirely inconceiveable that, with an increasing Yuan <Rupee, Euro, gold, whatever>, China <whomever> may be able to supplant a significant amount of the present US demand for Japanese exports to such an extent that Japan's loss of a sizeable proportion of the US market might not present too much of a difficulty for them to hurdle ...over time.
With consistant US double deficits with (apparently) no end in sight, mustn't the $/BBL price convention be fading before our very own eyes? Guess we'll have to wait for 20 March 2006 to see.
As you have stated, the real question is what price is required to cause people to actually use less taking into consideration the additional demand of China and India. My guess is that it is a lot higher than anyone now contemplates and well north of $200 by 2010.
On the bright side, $400 oil would certainly encourage conservation.
If you look at demand, for gasoline, or oil, it is still growing as "normal" - even with the steady long-term increases of the last 3.5 years. Sales at GM and Ford are down, but Americans are still buying SUV's. When gasoline spiked to $3.25 this fall Americans reacted, but we cannot tell how much they would have gotten used to the price and reverted to old behavior - because the price went back down.
Until gasoline sustains $3.50 (putting oil at roughly $100-$120) we won't be able to see much. Comparisons to earlier points in history are largely irrelevent, since it is a different world in so many ways.
I encourage those of you who are doing these excellent analysis/graphs of price/supply/demand to stop looking at the daily price of oil, since it contains so much temporary "noise." Try using a 26-week moving average of the Nymex-Futures/WTI Spot price. It provides a nice, smooth line and I believe has a very healthy built-in measurement of the long-term, economy-effecting component of price.
Over the last 3.5 years this price has basically never gone down, except for a couple of two- or three-week periods. It also shows that the rate-of-increase (acceleration) has gone through several phases, and is currently not at a high.
I'd be interested to know how the dollar being held up artificially by China, Japan and others plays into these price scenarios.
Thanks for any info you have!
http://www.gold-eagle.com/editorials_04/norcini082704.html
Jim
Euro history in pre 1998 years exists as an average of several comprising basket currencies, so you're not out of luck there either.
I've plotted oil price against the Euro and gold since 1998 and it maintains a pretty good, although a little rough, linear relationship, up until about 4 months ago, when gold appears to break away not only from the Euro, but from oil too.
This much is clear. When I take dollars from my paycheck to buy gas for my car, I don't need to worry about "foreign exchange risk" because the imported oil is purchased with dollars. The price I pay for gasoline may fluctuate because of various supply and demand factors (seasonal, hurricanes, Nigeria) but "foreign exchange risk" is not a factor.
Imagine a world where oil is traded for a basket of currencies reflecting the countries oil exporters buy their manufactured goods from (more Europe and Japan than USA). When I use my dollar paycheck to buy gas, I now must worry about how much yen and euro my dollars will buy because those curriencies will be needed to import oil. Suddenly, the dollar-euro and dollar-yen ratios affect how much it costs Joe Sixpack to get to work. Such a shift would have a dramatic impact on politics and culture as well as economy and finance.
Even as oil prices rise, the fact that oil continues to be traded in dollars is a major source of stability and benefit to the U.S. economy.
But does the present system encourage maintaining the soundness of the dollar or does it encourage devaluation? As my seeing eye tells me, hyper-$-intrest is coming unless,
1.) a vast quantity of dark matter Does exist
2.) a vast quantity of dark matter will be added to what exists now.
If oil is priced against a basket of currencies, it may cause the USD to stabilize as it becomes apparent that ever-increasing quantities can not be procured at oil's increasing (real worldwide) value, rather than just keep on heating up the Ben Franklin PhotoShop to pay the higher prices in inflated $. The US just gets to the energy savings scenarios quicker. <I mean like hey, its never going to happen???>
The perspective from this side is that actually we don't care how much the oil price is in USD, and technically as long as long as its the same (+/-) in Euros, its no problem until the US stops buying our exports. If we can replace your market with China-India, bad news for you. If not, I think oil will go higher in Euros too, but it'll probably be in a lot more gradual over time within a series of shoot ups and slides back down as the dollar inflates each time.
As for price converted to Euros, we're probably close to $6.00/gal consequently, if we're going more than 100 miles, we simply take the train or fly. If > 3.X adults are traveling, driving can be cheaper /P, but I'd still rather pay the difference and travel train. Club car beats driving any day. I've seen about 2 HMVs (both with those nasty British plates) in the last 6 months, so I call it... encouraging.
I don't see how this conclusion can be made from the graphs.
http://www.theoildrum.com/uploads/supply_demand2.jpg
I see the data point for 2005, it is the last purple dot, at about 84 MBD and $56. Now you're going to assume that demand increases at 1.5 MBD, and you will use demand elasticity of -11.50$/MBD to compute the 2006 price. You also say you will "assume production can grow at the same rate as 2004-2005" but you don't say what that is. Looking at your first chart it looks like it went from about 82 to 84 MBD, or an increase of about 2 MBD, greater than your demand increase.
So if production is increasing faster than demand, how do you get a $12 increase in price? I don't understand your methodology at all. Are you assuming a certain shape for the production curve that you haven't shown here?
If I read your chart literally, then in 2006 if price were at the same levels of today you would predict 2006 consumption of about 87 MBD for a 3MBD increase in one year, which would be unprecedented. That doesn't make sense to me.
But given that we are at or near peak, this means that we are still pumping a LOT of oil out. This coupled with any number of factors (can you say housing bubble) seems to me there could be one more bust/boom cycle left in the system before the terminal decline. What would be the forecast if we hit a major recession/depression for 5 years, demand plummets, prices?? If global demand falls to 75MBD, then starts to rebuild, how long before we again hit the readjusted ceiling of supply. WebHubble had done something like this for the historical shocks in his model, but I haven't seen a future look on this scenario.
-Ptone
All complex real-world systems are non-linear. Using linear extrapolation there is not only useless, but plain deceptive.
From the look of the post it seems that the poster knows what he is doing - thus I can only deduce that he knowingly uses "scientific look and feel" to push his "end-of-world" agenda onto gaping and awing (Ohhhh...!! science...!!) laypersons. Disgusting.
FYI: no, I am not a peak oil sceptic, neither I am a paid slave of an evil oil corporation. Personally I am convinced that humanity should get out of the fossil fuel mousetrap ASAP.
But! I wouldn't tolerate "scientific" fraudulence.
I'm not pushing any end-of-the-world agenda
I went too far here, I had no basis to speculate on as what kind of agenda you have if any, I am sorry
As for my other words - I stand by them - and your reply only validates your pseudo-scientific stance:
if we never made some simplifying assumptions, we wouldn't have, for instance, airplanes, because we still can't solve the viscous flow equations required to be truly "accurate"
Bullshit. To build (a generic) airplane one don't need to "solve viscous flow equation". Wright Bros, Mr. Boeing, Mr. Douglas, Mr. Tupolev, and others did just fine without "solving" your equations, thank you very much.
Again, you take some "scientific"-sounding words and try to impress me. No sale, it just happens that I know the stuff (math & physics). But I can imagine that 99% of your readers gape in awe when you casually mention the "viscous flow equations".
Using linear extrapolation for a short-term prediction for a non-linear system is NOT a simplification, it is a MISTAKE, and, if the author understands what the non-linearity is, - that would be a scientific fraud.
Yes, linear approximation is commonly applied to non-linear systems (to any system, actually), but only for relatively long-term patterns - ABSOLUTELY not your case.
I can show you how linear approximation would look like in your case, unfortunately I don't know how to include a picture into my comment
this is a simple model, that I wouldn't look at for much more than a year out
Sheesh... to look out for a (meager) year one don't need any "model", provided, of course, that that one is not a .... tell me, solarfan, do you need to use linear programming to choose a driving route to mall?
'To build (a generic) airplane one don't need to "solve viscous flow equation". Wright Bros, Mr. Boeing, Mr. Douglas, Mr. Tupolev, and others did just fine without "solving" your equations, thank you very much.'
This was precisely my point. Apparently, I either failed to communicate it clearly, or you aren't listening.
'Sheesh... to look out for a (meager) year one don't need any "model", provided, of course, that that one is not a .... tell me, solarfan, do you need to use linear programming to choose a driving route to mall?'
So the price of oil next year is intuitively obvious to you? Please share your insights.
Look Pal, I'm not trying to impress ANYONE here. I have a job and a life outside of here, but I think that this issue is extremely important and will impact all of us, in our lifetime, not just our kids' or grandkids' lifetime. Now, I sat down and played with this on and off for the last month or so, in my spare time, and I have stated in the original post and reiterated several times that this is a simple model, and I'm no economist. We're all trying to learn and move the level of knowledge and awareness forward on this subject, and your accusations of "psuedo-science" and the implied accusation of intellectual dishonesty (twice now) are nothing more than a drunk in the back of the room heckling someone. You have a better method, system, analysis? Put it out here, so we can all benefit from the discussion.
Look, "Pal",
the matter of intellectual dishonesty depends on whether you understand what you are talking about or not.
(1) Do you know the stuff of "linear, non-linear, extrapolations, equations", etc, in other words: Do you know the math used in approximations of physical systems ?
and (2) Do you realize that the system in question is at least non-linear, and, generally speaking, scientifically unknown, and what does it mean for the mathematical description thereof ?
If your answer to both questions is "yes", and you knowingly posted this "extrapolation" bullshit - then, yes, you are intellectually dishonest. You don't like it? Your problem, "Pal".
If, on the other hand, your answer to any of the above questions is "no" - then, I am sorry for thinking too bad about you.
And in this last case I urge you not talk about things you have no idea about. And don't tell me that you are within your right to express your opinion - y'know, opinion is like an ass - everybody has one and you'd better not to flash it in public.
If, as I now suspect, your math knowledge is inadequate for the task, why the hell do you use "scientific" words like "linear", "extrapolation", etc ? Why don't you say simply: "see, I did draw this line on the graph of some oil prices and look - we are going to have $100pb in a year"? Why didn't you talk this way? Ahhh, it's not impressive, naive baby talk, right ?
So what would it be: intellectual dishonesty OR just your naive talking about things you possess no hard knowledge of ?
=======================================
As for the importance of the subject of fossil fuel dependency - your idiotic "extrapolation" only serves peak oil denyers, giving them another reason to dismiss the coming end of the fossil fuel age - they can quote your "extrapolation" as a proof that peak oil proponents don't understand math basics...
This board will be higher quality, and no one will think less of you, if you refrain from answering determinedly uncivil people.
Chris
Chris,
Here is pseudo-scientific juggling with graphs and non-disclosed calculations to result in the psychologically predetermined result -> $100+pb value.
Other people, who claim that oil is plentiful, use the same graphs and also non-disclosed calculation to get to value they want -> stable and reasonable $pb (always less then the magic $100pb).
I call those what they are - pseudo-scientific frauds.
You call me uncivil. Ok, I admit, I am - when I see math and science being used, or, rather, abused, to serve ideological purposes whatever the intentions - I drop all my civility.
Igor
Personally I missed that part. What I saw was a guy who spent a bunch of time working on what the future price of oil MIGHT be. I didn't see anyone trying to push an agenda or practice pseudo-science.
The original post clearly stated at length in the first paragraph the reservations the author had about the method and its usefulness farther into the future. I think you might have missed that part. You have quite a high opinion of your math skills. You may want to touch up on the reading comprehension.
In follow up posts, the author responded to your initial issues and restated some original caveats. You got more belligerent.
The form the author used to try to illustrate his thoughts is no different from that used thousands of times daily all over the globe. Turn on Bloomberg News, CNBC, Nova, you name it.
If you have some data or another method that shows something different, by all means present it. You can attack the messenger, but you don't really have an alternative message.
Saying that others have used the same methodology to produce lower prices doesn't cut it either, because one can simply make the argument that they are not being "fraudulent" either. Besides you provide no data to back up your claim. One effective method often employed on this side of the debate is to attack the opposition's data as fraudulent. You provide no data and no argument to attack. The key there is that you have no argument.
We are not talking about the South Korean method of cloning research here. Yet you talk as if a couple graphs that use extrapolation are going to bring down western civilization. "Pleeeeze," as you say.
The acronym WAG was used by the author in his original post. Discussion of this term follows. I suggest you go back and take a look.
(2) so the author surrounded his work with qualification statements, what is it, legal discussion ?
(3) you say that I didn't provide any data or alternative view, or whatever.... Incredible! It's not me who bears the burden of proving here ! solarfan posted his graph, it is his burden to prove it.
Frankly, when someone publicly shows the kind of extrapolation graph the solarfan posted, he'd better be able to prove it. And I mean it.
Not that such extrapolation is impossible, or totally unknown, but as he calls himself an engineer, the graph MUST ring the bell. Or, more appropriately - trigger air raid siren.
And he didn't prove it. He constantly refers to "his calculatons", but he doesn't disclose them.
There was very interesting moment in this thread - when someone asked solarfan directly - how solarfan did calculated a particular (x,y) point on his extrapolation line. And solarfan's answer just killed me: "from 2004 to 2005 there was a 1.54MBD increase in demand, and a $13.62 increase in the cost per barrel, so I just continued that trend for the next 5 years".
What else prove do you want from me ? Just try to realize what that guy is trying to present as scientific work: he takes dataset of a short period of a madly fluctuating unknown function of patently non-linear unknown system, averages delta over the period and extrapolate it linearly over 5 times the original dataset period !!!!!! and uses the resulting value for the next period !!!!!!!!!!!!!!
(4) yes, I care a lot about ... mmmm ... "purity"(?) of hard sciences. Do you have problems with that ?
(5) as for that I don't give an alternative model - so far science is unable to model systems like climate, much less - weather, and even less - human society. Please, learn to live with this unknown in the centre of our universe.
And, just in case, patently incorrect knowledge (like this "model") is worse than no lnowledge at all.
WAG is "Wild Ass Guess", a nice euphemism for "i have no idea what i'm doing" (solarfan should have defined it for the uninformed, instead of waiting for people to ask/comment on it). acronyms always sound more impressive.
your year-to-year prediction would be somewhat accurate in the last couple years (because the graph is relatively linear there), but no generalized linearity can be inferred. unless you argue that we are near peak and this implies a linear region as we approach vertical. i think adding in the 70's data might elucidate the complex, chaotic geopolitical nature of the data.
honestly, i'm still not clear how you got the $100 price in 2006 if demand grows 1MBD this year. how do you calculate this?
1.) Linearize the nonlinear equations
2.) solve the linear equations over a short time,
3.) substitute solved variables into the original nonlinear
equations
4.) calculate answer
5.) find error as difference of linear and nonlinear solutions
6.) if within the permitted error, goto next time stepout
revert to step 1
if not within the error tolerance,
reduce the time stepout
revert to step 2
If only we knew what the nonlinear equations are.
If only we knew what the nonlinear equations are
we don't, but the author has provided us with the graphical representation of his equations (whatever they are)- solid pink line, AND his extrapolation - dashed pink line - on the same graph.
does his extrapolation LOOK reasonable to you (based on the graph data only) ?
<sarcasm> Well, the time has come, it's 2007 with oil north of $100/barrel and gas at $4/gallon. It's time to respond! Since the large majority of our oil usage is in the transportation sector, it's time to carpool!
Unlike the New York City case, in this little scenario, the people live in Erie, Colorado--an exurban community east of Boulder where I live. They're building like crazy out there, displacing farmland we'll need later to live off of. Everybody lives in a 5000+/square foot McMansion and it's unlikely they even know their neighbors. Nonetheless, let's "boldly go where no man has gone before". Somehow, four of these exurbanites get together, they'll carpool to save gas costs. One lives in Boulder--15 miles to the west, one works in Loveland--30 miles to the north, one works in Golden--25 miles to the southwest and the other works in Denver--40 miles to the southeast. Of course, there's no alternative transportation (buses, light rail) to any of these places.
A discussion ensues but soon turns ugly. Should they do the "circle" route? First, north to Loveland, back down to Boulder, down highway 93 to Golden and a straight shot on US 6 into Denver? And then reverse it going back at the end of the workday? But whoa! If everybody just drives themselves as usual, we have 110 * 2 = 220 miles a day. If they do the circle route the commute time is the same for the first guy but gets longer and longer for each subsequent drop-off. This is the same at the end of the day. And what of the vehicle miles traveled (the dreaded VMT). Well you don't have be Sir Isaac Newton to see that the circle route involves more miles driven than simply 4 separate commutes from a central point (lets say approximately 130 * 2 = 260 miles a day). Gas savings? - none, 40 more miles driven. Gas usage and costs? Assuming this is an SUV (of course it is!) and gets 15 miles/gallon, then the original usage is 14.7 gallons costing $58.80/day. Using the circle route, usage becomes 17.3 gallons at a cost of $69.20/day. But that cost is split four ways!
So, we're using more gas (2.6 gallons/day) but the total cost split equally four ways is down. Of course, it takes more time to do the carpooling and as Benjamin Franklin famously said, "Time is money". Things turn ugly! The guy driving to Denver is saving money but losing time. The guy with the shortest commute to Boulder is getting screwed because he can't get to work until they drop off the guy in Loveland and he's losing money too. The guy going to Golden is just plain fucked. And what if somebody has to leave work to run an errand? The Denver guy gets to keep the car all day because he's last on the route. The others are chained to their desks. Finally, the Golden guy goes insane, pulls out a gun and shoots the other 3 guys. Realizing what he's done, he turns the gun on himself and commits suicide.
So much for demand elasticity. But, as Jim Kunstler says,
It's all good.
</sarcasm>
$100 oil is going to be seismic.
I read it takes 8 barrels to raise a steer. Might be good to get a little beef eating in.
If you give it up and have foresight into what type of foods will be available post peak, and adopt those habits gradually now, then when SHTF youll be relatively well-off. This goes for bike/car, cabin/mansion, lots of girlfriends/one girlfriend, etc.
We'll always have beef. It just might be 'whats for dinner' on special occasions.
I should mention that she is neither an old hippy or young eco-fascist. In fact, when I met her, she was a Republican.
But by-gones are by-gones... we don't discuss that anymore.
I learned to work and do my share supporting my family by working off of workbikes, or more accurately off of work trikes. I have pedaled OrganicEngines SUVs for over 5 years now, year-round in Mpls, MN, USA.
I think that our hearts and imaginations are bound by the infrastructure we have invested so heavily in. We cannot see any other ways of organising our lives because we've sunk so much into the current way of doing things.
Where our treasure is, there is our heart (and imagination) also.
People who make a lifestyle based on walking and biking find their hearts and imaginations liberated. It will be a painful transition to the post-carbon world, if we make the transition at all. I suspect that none of us will "have our cake and eat it too."
Will we make actual life changes so that we re-design our cities using permacultural principles, for example, or will we insist on holding on to what we've got in the petroleum-bound infrastructure until we are left in the cold and dark, irradiated by the fallout from the last resource war?
These extrapolations might be helpful, but do they lead anyone to understand a need for change?
If only 1% of the population is carpooling, you don't have enough people sharing departures and destinations and times to make it work. When 10% of the population is carpooling it gets more practical.
Minivans work well on fixed routes.
Right now our (US) economy (and especially transportation infrastructure) is set up to encourage petroleum consumption. We have no sense of the true cost or even the true value of petroleum. The so-called "free market" does not even know the true cost or value of lunch.
My guess is that we might make a transition without a sudden, sharp economic catastrophe, but not likely.
People are encouraged not to live near work, not to conserve petroleum or any other resource.
Our economy only works if we waste more and pollute more. If we conserve our economy tanks. Those who benefit from the current economic system the most will see the least problems with the status quo.
So I continue to take the steps that I can, and to search for more ways to create a different way of doing things while I wait for the sound of the economic tsunami sweeping through.
Sustainable transportation (primarily walking and biking) and relocalisation of agriculture, applying permacultural principles even to (especially to?) urban landscape -- this seems like the most significant work I can be doing right now. Building community seems important as well.
I ran across this quote attributed to Kunstler:
"We'll keep behaving the way we do until we can't, and then we won't."
Time will tell.
Here are the details:
As personal electronics (e.g. cell phones) become GPS-enabled and networked, a big data-crunching company with maps could implement a secure, convenient carpool-matching service.
In a big city, if a tiny fraction of drivers participated, there'd be several people within a mile of you, going your way, every minute. Riders tell the system where they want to go. The system polls nearby participating drivers, finding one that wants to make a couple of bucks by going half a mile out of their way.
The driver is directed (using standard navigation-system technology) where to pick up the rider, and then where to drop them off. No advance scheduling is required.
Drivers and riders can be identified by biometrics, so everything is accountable. After the ride, each can rate the other.
By adjusting the spread between cost-per-ride and pay-per-drive, subsidies can be injected and/or profit can be extracted.
The system's flexibility can be increased by taking advantage of the near-instant availability of drivers. Riders don't have to get to their destination in one ride; they can be dropped at a bus stop, wait less than a minute, and get picked up by another driver for the second leg of their trip. This greatly increases the number of available drivers.
Drivers and riders could even enter profiles of people they wanted to ride with (dog lovers, no talking, etc).
Given a lot of computer power and a set of reasonably innovative algorithms, this could make riding easier, cheaper, and more fun than driving, saving large amounts of fuel, money, and traffic congestion.
Sounds like a job for Google! I've recently suggested it to them. But it shouldn't be impossible for a smaller company to implement it.
Chris
I wrote to them to point out that real-time in-car scheduling should allow two-legged trips (transferring from one car to another in the middle), thus greatly increasing the number of trips that can be completed.
Chris
Another adjustment I would suggest, for modeling future demand growth, is to look at per capita consumption. One reason demand is growing is because human population is growing. The latest figures I found are that current population growth rates are 1.4% per year. This rate is declining slowly, it was about 1.7% in 1980. See the green line in this chart, although note that the right half is an extrapolation:
If you model demand growth at constant price as population growth plus some delta, then include some low estimate for demand elasticity, I think that would be a good starting point.
I agree that an interesting way to forecast demand would be to look at the economic growth rates of each country or region in the world and to extrapolate those forward. China is the big question mark here because it is getting big enough that its growth is a major factor in what happens to world oil demand. Unfortunately it is a closed and secretive society, and there is great uncertainty about what is really happening there. You can assume almost no growth from them, or enormous growth, and there are people making cases for both possibilities.
But if you did make a best-guess model like this, you could compare it with the various analyses done here of likely production levels next year. We have experts looking at worldwide production on a field-by-field basis, estimating decline rates from each field and checking almost hourly for whether new production is coming online as scheduled. With all this information one could make a pretty informed guess about at least the next year's production levels.
Put these together and you find out whether there is a shortfall or not. If there's no shortfall that would point to an easing of price pressures. If supply can't meet extrapolated demand, then you can use your assumed demand elasticity to figure what the price has to be to suppress demand to that level.
I think the bottom line is you need to estimate demand and production levels under current conditions, before you decide whether prices will have to go up or down to bring them into balance. The problem is that you have two inherently uncertain projections, then you need to take their difference to figure out what will happen. But the subtractive difference is likely to be so small that it is swamped by the error bars in your projected figures! This means that this analysis gives us essentially no idea of what will happen to prices next year. There's just too much uncertainty on both the supply and demand fronts.
"With all this information one could make a pretty informed guess about at least the next year's production levels."
Well, I think there's been a lot of effort on this site to try to do just that, and still no concensus within a wide range of possibilities.
"This means that this analysis gives us essentially no idea of what will happen to prices next year."
Agreed, which is why I presented the two extremes, but what it pointed out to me while looking at it is that 1. We can't have a peak at 85MBD and not have either a major change in the inertia of demand growth or $100+ oil, and 2. oil dropping to $35 a barrel is truly wishful thinking. Beyond that, I concede it is still anybody's guess what will actually happen, and neither this simplistic model nor any other method, regardless of how elaborate or simple it is, is going to give a definitive answer. I think it's probably easier to forecast weather trends for a year - at least there's no politics or wars in Mother Nature :-)
I'm searching for papers which attempt to explain this anomaly, but meanwhile I do have some insights from what I have read which may shed light on what is likely to happen in the future.
Hotelling's reasoning starts like this. Suppose you are an oil producer and somehow you know what the price of oil will be for the next several years in the future. You've got a crystal ball, or an analysis like what we do here all the time, and it gives you a good idea of what will happen. And suppose your goal is to maximize the "net present value (NPV)" of your income.
NPV is an economic concept which derives from the observation that people would rather have a bird in the hand than two in the bush. Cash today is worth more than cash in the future. This is modeled by assuming that there is a "discount rate" which measures how much less future income is worth than the same dollar amount today. Generally the discount rate is taken to be approximated by interest rates (somewhere between the highest safe interest rates on deposits, and the lowest available rates for loans).
Now suppose that you knew that future oil prices were going to increase at a steady percentage rate. Let us consider what you will do if that rate is higher than the interest rate (aka discount rate). In that case the NPV of your oil will be greater in the future than it is now. So your incentive is to hold off on selling it now, and to wait and sell it in the future. OTOH if oil prices are expected to climb slower than the interest rate, the NPV of future oil will be less than today, so you will try to sell more oil today and not save it for the future.
Given that all oil producers act this way, it tends to move the expected future price increase to equal the interest rate. In the first case above, where prices are climbing faster than that, people will hold off selling today and sell more in the future. That will increase today's prices and lower future prices, decreasing the steepness of the oil price curve. In the second case, where oil prices are climbing too slowly, people will sell more today and have less to sell in the future, so prices will come down today and go up in the future, steepening the curve. In either case, profit maximizing oil producers drive the expected future price curve to equal the social discount rate, aka the general interest rate.
So this is the basic Hotelling prediction, that oil prices (and for that matter, prices of every other exhaustible commodity like coal, copper or gold) will rise on a path that matches the interest rate. Needless to say, this has not happened. Adjusted for inflation, prices of most commodities have been roughly flat over the industrial age. (See Chart 1 for some examples.) There has been no long-term exponential increase in prices.
There are some modifications that can go at least part way towards explaining this. One possibility is monopoly. If a cartel controls the price of the commodity, Hotelling shows that the price will rise more slowly as the cartel restrains production. Due to decreased production, prices are higher and profits are greater. As the reasoning above describes, given relatively flat prices companies would like to produce more in the present, but the cartel restrains their actions. The net result is that the industry makes more money and we don't see the kind of price increases that the simple Hotelling model predicts.
Oil is a commodity which has been governed by cartels almost continually. For the 1st half of the 20th century, the United States was the most important oil producing and exporting country. During that time, government regulations restricted production and kept prices high. Not until the 1970s were these restrictions removed. At just that time, OPEC became important as the major oil producing region, and of course it has functioned as a cartel ever since. It's possible that these government restrictions on production can explain the failure of the Hotelling model.
Now, however, things are changing. Just as in the 1970s the U.S. hit peak production and restrictions were removed, so now we find that OPEC is running out of spare capacity. When this happens, we may find for the first time that we have the conditions necessary for the Hotelling model to work. The cartels will no longer be in effect, and we will see a wild free-for-all, every country for itself in terms of trying to maximize the profits from this declining resource.
So what will happen? Look at the analysis above. Hotelling predicts that if producers expect oil to be more valuable in the future, if they think the price will climb faster than interest rates (about 5% per year today!), they will reduce production now because they know that oil will be worth that much more in the future. This will cause prices to rise quickly in the short term, until an equilibrium is reached. After that point, prices will settle on the Hotelling curve and climb at this modest ~5% rate until the resource is exhausted or prices get so high that people are forced to use inferior substitutes.
So the prediction is somewhat different from the usual Peak Oil scenario of continual high price increases. Instead we would expect to see something of a "step function" in prices, as the old order breaks down and we switch to a model where everyone admits that we are on a long term production decline. We will see a sudden transition to high prices, high enough that demand will match ever-diminishing supply, with only modest ongoing price increases from there.
So how high would prices have to go to reach this condition? That's the $64000 question, isn't it. I will have to think about this some more and study more of the literature before I could hazard a guess.
There seems to be a mismatch between soon-to-be-falling production capacity, inelastic price curve, and slow growth in price.
In a really stupid model, where high prices didn't hurt the economy: then base oil demand might grow at 1% per year, which at constant supply and elasticity of 0.2 means that price would grow at 5% per year. (Someone PLEASE check my work; I am worse than amateur here.) So I'm starting with the assumption that supply has to be constant for the Hotelling thing to work.
Obviously, oil supply can't be constant forever. So let's take a 20 year planning horizon, and see how much oil per year we have.
Suppose oil use grows by 1.5 mbpd from 84 in 2005 to 91.5 in 2010, and then supply declines 4% per year to 49.6 mbpd in 2025. Then we'd have 559 GB, or an average of 73.0 mbpd over the period.
If the peak was in 2005, the numbers are significantly worse. Decrease 84 by 0.96, 20 times, and you get 37.1 mbpd in 2025. The average, then, would be 57.6 mbpd.
So, by your reasoning, if the oil merchants are to use the Hotelling strategy, the price should rise in sudden step until demand decreased to 73 or even 58 mbpd.
That doesn't sound workable at all. I don't think you could drop demand that quickly without collapsing the world economy--could you?
Chris
Ps. I just spent 20 minutes on TOD home page, Wikipedia, and Google, and couldn't find a number for remaining world reserves. I don't have time to skim the past week's posts for the Hubbert graphs I remember seeing. Could someone PLEASE put together a summary of the main numbers and graphs that relate to world oil usage and likely reserves?
Unfortunately, their server is down right now, so I cannot give the link to their reports directly.
Note: they tend to lean to a better-case scenarios and yes, you have to pay $$$ for the reports. I did use theirs to find out the cost of oil productions last year. Pretty impressive.
it's deja vu all over again for me - you know, when I did live in the USSR there was a common saying about anti-communism books: "I didn't read it, but I condemn it!!!". Some said it as joke, others were darn serious...
As J often says, with CERA, "follow the money."
(And yes, I've read the report...so have many of us here. We've discussed it quite a bit.)
I'm surprised you can recommend them, perhaps you should read more widely on peak oil, then you are likely to perceive the fracture in reality that looks likely to dog peak oil until it smacks us very hard and unpleasantly soon.
Are you unable to think for yourself and separate hard data (which I praise in their reports) from their analysis and conjectures ?
Take a seeminly simple question: what is the cost of oil production in Saudi Arabia?
I could get it only from CERA. Actually, later, I stumbled upon better analysis in PwC report, so, of course CERA is not the one and only.
Look at where CERA says future production will come from, it is almost pure fiction.
Here's the most detailed analysis of Saudi production capability from Saudi Aramco that I have found:
http://www.saudi-us-relations.org/energy/saudi-energy-reserves.html
and a couple of other relevent sites:
http://www.saudinf.com/MAIN/y6668.htm
http://www.sgs.org.sa/index.cfm?sec=1&page=home.cfm
Please note that SA projected (at that time, Feb 2004) raising production to 12 mbpd by 2016, they comment that raising production further could damage the fields and reduce ultimate recovery. Now go look at CERA, EIA and similar reports, what do they 'require' of Saudi by 2016?
Then go look a CERA's predictions for: Norway, Mexico, Kuwait, UK, Iran; browse through comments here at TOD and follow their external links to recent reports on their production status and forecast.
You will find a shortfall of these countries production versus CERA's required production, commencing now and getting worse thereafter. What conclusions would a rational person draw from that?
I heard what Robert Esser of CERA said to the US House of Representatives Peak Oil hearing, he sounded very reassuring but much of what he said was a very distorted version of the truth. Then he covered his arse by saying there were geopolitical downside risks, but in reality ALL the risks in their forecast are to the downside. That is not accurate or responsible forecasting in my book.
You can listen and read the presentations here:
http://www.globalpublicmedia.com/events/585
As for the aramco costs - the question was not whether you consider those costs relevant or not, but what are they ? Actually it was a rhetorical question - to illustrate the general lack of hard data on the subject.
The SA presentation is surprisingly rich in hard data, though the words and vague data paint a rosier picture. It's well worth reading, I'm astonished it's actually online.
Where's this non-OPEC 6.7 mbpd by 2010 coming from? Non-OPEC production has peaked already, even the cornucopians at the EIA think so, if I recollect correctly.
http://www.theoildrum.com/story/2005/12/19/215346/46
again, no offense intended, but you guys most probably havn't seen the report.
what you were discussing - were the presentations and newspaper articles which, in turn, were based on so-called executive summary of the report.
let me repeat - the value of CERA (and other of the kind) reports, why I recommend them, is not in their executive summaries - political conclusions - that get publicity in newspapers,etc,
but in the underling data that those people manage to compile and get together, like some kind of intelligence operatives.
First, here is one of the graphs Stuart constructed applying Hubbert linearization to estimate world ultimate recovery:
http://www.theoildrum.com/uploads/linearization.gif
The linear fit, which is the yellow line, hits the axis at about 2.3 trillion barrels, of which we've used so far a little over a trillion. I think this estimate is in reasonable agreement with mainstream views.
Second, you write: "In a really stupid model, where high prices didn't hurt the economy: then base oil demand might grow at 1% per year, which at constant supply and elasticity of 0.2 means that price would grow at 5% per year."
This is not correct. Elasticity generally refers to changes over an interval where the forces that control demand are not changing. A price rise of 5% with an elasticity of 0.2 would cause demand to DROP by 1%. Higher prices, lower demand, see? (Technically, the elasticity should be said to be -0.2, to emphasize the inverse relation between demand and price.)
If demand is growing 1% a year for other reasons, we can't use the notion of elasticity to determine what the price change will be. We need to know what is happening at the supply end in order to put the whole picture together.
Third, I'll give a quick example of how the Hotelling model can allow for slow increases in oil price even with relatively inelastic demand. This is not meant to be realistic but just to give an idea of how it could happen. Let's suppose oil prices increase 5 fold to about $300/bbl. Faced with such high prices we'll imagine that demand drops by a factor of 2, from about 84 mbd to 42, as the economy reels from the shock.
Now, producers have no real problem putting out 42 mbd. They can keep up that rate of production for quite a few years going forward. Still, the oil is going to run out eventually and everyone knows it, so the price is rising. After a year it is 5% higher and after two years it is 10% higher. This causes demand to drop still further - higher prices mean lower demand. But it's not too elastic so the 10% price rise maybe only causes a 1% drop in demand, down to about 41.6 mbd.
And we keep this up continually, the price rising slowly, demand and production falling slowly, until we either run out of oil or find some other substitute. The point is that in this pricing regime, even inelastic demand will not cause prices to shoot up drastically from year to year. They are already so high in this scenario that demand is substantially decreased.
Keep in mind that this is just an example; I'm not saying that I think oil will be $300/bbl. I just wanted to show how the end years would go in the Hotelling model.
In my "really stupid model" comment, the problem may have been my confusing use/invention of the phrase "base oil demand." What I meant by that was what the demand would be if price stayed constant but the economy grew.
Of course this concept assumes that supply is set artificially, for the purpose of controlling the oil price. And it further assumes that oil is underpriced relative to its value (the amount of wealth that would be lost in switching from oil to some other energy source). Both of these assumptions seem to reflect recent reality.
Is it legitimate, even in the crudest of models, to use an elasticity number that was derived from short-term supply/demand fluctuations, to predict what the price would do if an underpriced commodity became moderately more scarce? That's what I was trying to do.
For example, if supply was controlled such that oil stayed at $60 per barrel two years in a row, then as demand grew perhaps 1% per year to accommodate economic growth, supply would also have to grow at 1% per year. If in a certain year, supply is constrained to stay flat, and as long as demand does not decrease below supply (which it won't for a while, because oil was underpriced), then in a very crude linear model based on extrapolating 0.2 elasticity, price will rise at 5% per year... right?
On your comment about price increasing slowly--yes, but it only does that (in your model) after a huge step. I don't think price could increase slowly from today's situation, without at least one step. I think we're actually agreeing. I said that to use the Hotelling strategy, merchants would have to cut price until demand fell to 73 or even 58 mbpd. You said that if oil went suddenly to $300/barrel, then consumption might fall to 42 mbd, at which point the Hotelling strategy would kick in and prices would slowly rise from there. I think these two sets of numbers are consistent.
Having just read the "Extrapolating World Production" article, http://www.theoildrum.com/story/2006/1/22/04219/1102 I'm suspecting that my worse-case 58 mbpd number is overly pessimistic. I got it by looking at the oil that could be produced over the next 20 years, but I was assuming a 4% drop per year post-2005-peak. Eyeballing the "Logistic" line in http://www.theoildrum.com/uploads/12/world_growths_1860_2040.gif (the third-from-last graph) it looks like 1% in 2000 to -2% in 2020. If I assume the %growth drops by a constant 0.15 per year, then the average oil production for the next 20 years would be 77 mbpd. Not too much higher than my previous better-case estimate of 73.
Now, the Hotelling strategy doesn't actually try to keep supply constant. In most cases, the supply can drop, while the price rises slowly. But in the case of very inelastic prices and a growing base oil demand (because as I said before, oil has been underpriced relative to the cost of switching to alternate energy sources), isn't it possible that the supply would actually have to increase year-over-year in order to keep prices rising at only the level of interest/inflation? Look what's happened recently when oil supply didn't rise very fast--price went through the roof.
So I come back to the point that a Hotelling strategy probably can't be applied without a major price hike first, because the required production curve can't start at 84 mbpd.
And that seems to demonstrate that oil producers are not currently applying a Hotelling strategy.
Chris
- Net present value isn't simply that "cash today is worth more than cash in the future", but that any investment today is in direct competition with all other potential investments of comparable risk (and there's a different level of competition across the risk profile); therefore an investment's "net present value" is the cost to get the same expected return from the best comparable investment available. For anything with an expected wide range of possible returns, there's a risk premium that can greatly reduce net present value.
- Even currency carries a risk of inflation reducing future value, or national collapse... Physical commodities, on the other hand, have a certain inherent value that doeesn't go up or down: that's why some people "invest" in gold when they're worried about inflation. In fact, the rate of inflation is in good part a measure of the change in cost of commodities, so you might expect commodity prices to stay constant relative to inflation (almost by definition).
- Peak oil people don't uniformly expect oil prices to monotonically rise. Ken Deffeyes, in "Beyond Oil", explained pretty clearly that in a decline situation you have a sort of ecological situation that results in instability and wild oscillations in price, rather than a continuous rise. It's that likelihood of wild oscillations that greatly increases the risk premium for investments in oil production.
In other words, expect "step functions" up and down until oil is no longer a significant economic resource, as people change their estimates for the amount of remaining reserves, viability of alternatives, economic growth, etc.The Hotelling model assumes perfect information about future markets and the resource itself - we don't have that...
If we assume that the OPEC countries have overstated their proven reserves by 300+/- billion barrels, then Peak Oil must have already occurred. Agreeing with this assumpition, Hubbert was probably correct in his calculations that world wide Peak Oil took place in the late 90's.
World wide oil supply has been flat several years. According to Matthew Simmons, peaking is what can be done for several years or even a decade. What might be interesting in forcasting future oil prices and supply, is dealing with unknown variables. These variables will include Geo-political events, terrorism, and unexpected collapse rates of large oil fields.
Advances in technology in rapid oil production, may have robbed Peter to pay Paul. By that, forcasted future supply from large fields may not be possible, due to the fact that the water and gas injection systems have made normal bell curve formulas inaccurate. We are seeing 10% decline rates in the North Sea fields. The Burgan field in Kuwait is in decline. Mexico's large Cantarell field is also in decline. If these large fields show decline rates of production of 6-10%, the price of oil will skyrocket.
Many people are predicting Peak Oil to have either hit Thanksgiving 2005 or up to the next several years. I believe we Peaked several years ago. As soon as Ghwar, Burgan, Cantarell show signs of rapid collapse rates (as well as others) the world will realize Peak Oil has come and gone without even a whimper. I believe Matthew Simmons has even stated that we can see 30% collapse rates in the Saudi fields due to their intensive water injection system.
Unfortunately, all bets are off for a soft landing in the U.S. economy. Those with enough wisdom will take advantage of the few years left before the economic collapse hits and get their house in order. Because today....individuals still have the power to make decisions about what they want to buy, where they want to eat out, where they want to live. But, within a few years...this opportunity will be gone and those who did not make plans will be caught up in a economic depression so severe that just surviving will be a luxury.
Of course, as in history, most people will fall in the latter category.
The US is already churning out billions of $ per day to pay for oil imports and goods imports and most of these dollars are not flowing back into the US. All the countries that hold the collosal US debt are expecting interest on their investment and that isn't going to happen, at least not in $ that are worth anything. I am curious to see what happends to the value of the $ over the next 2 years as the US stops raising interest rates, the housing bubble bursts, oil is sold in Euros, the Crude price goes up, jobs are lost...
I can honestly see a situation in 2010 where the US is unable to import oil.
Thanks for your analysis Solarfan, I enjoyed it.
Disclaimer:
I am a mathematician and not an engineer nor an economist.
This is also my first post so be kind to me.
I will try to formulate several of my thoughts below, some related to your post and some not.
First, I have no doubt that PO is imminent or avoidable. The western world is too dependent on cheap liquid fuel.
Obviously, it is impossible for consumption to be greater that production and if production is plateaued it means consumption can not increase (except by interference from strategic reserves which can only cover up a shortage temporarily anyway).
This means that demand must be constrained so that it does not exceed production. I see two possibiliteis for this, first would be rationing and centrally set fixed prices and secondly allowing price hikes to create sufficient demand destruction to bring demand down to exactly the production levels.
As far as rationing and central control this must surely be a doomed approach. Rationing would mean centrally controlled and planned consumption but that would only work if one has full control of all production as well. As long as producers have the option to sell their goods elsewhere, at better prices, rationing can never work.
It is not realistic that the western world would gain full control of all global production facilities and thus it would be pointless to attempt rationing (or conversing).
"Mr consumer, interesting theory about 'price' and rationing however the guy over there offers a better price for my goods so you can ration all of the 0 barrels I will sell you."
That leaves demand destruction as the only possibility to curb demand and this would require continous price increases to counter any deman increase to drag demand down to the maximal possible consumption levels (
= max production).=production).Demand destruction occurs at all levels. Even if oil were priced at 10$/bbl there would still be demand destruction occuring since demand would still be lower than if the price was 0.
Your article is the first one I have seen that tries to quantify demand destruction as a function of price and is therefore very interesting.
As far as demand will increase over the years and considering there are many datapoints that suggest we are at peak or near peak it appears demand destruction is the only way forward. Unfortunately this will lead to higher and higher prices to compensate for (and price out of the market) sufficient numbers of consumers so that equivilibrium is reached (consumption
I would think that this together with the state of the dollar currency as very serious for the world economy.
Maybe the petrodollar is now a curse for the us now that production has/will peake? and no spare capacity is to be found and brought online easily.
Someone commented here or in another thread that why would he care, oil is priced in dollars and that is the currency he uses?
I think that is very wrong and dangerous thinking since
the us "only consumes ~25% of the production of oil.
However 74% of the consumers are not using dollar and neither do they price oil in $.
Myself I dont get my salary in dolllars, neither do I use it to pay for goods or gas at the station. I pay using some other currency that is later converted to dollars and then into oil.
Well, really, i dont even pay really pay using some other currency (which is just a representation of the worth of money) I pay what I in my local currency feel I can afford and what I think is cheap/expensive relative to my purchasing power.
That oil is priced in dollars is completely irrelevant to me. What matters is how affordable oil is to me.
Assume the us dollar is devalueted 10%. This would mean that my money would suddenly get 10% more dollars and thus oil for my money. The amount of demand destruction that is created by me would then be reduced by the same amount since the price to me would become discounted and I would start caring much less about the price. I.e. my demand destruction has decreased.
However, someone in the US would not experience this demand destruction since his money still buys the same amount of oil.
If the only thing that keeps demand down and equal to the production levels is demand destruction, then if my demand destruction has decreased it would mean that someone elses demand destruction would increase.
It therefore seems very logical that IF the dollar is devalueated, then the price of oil in dollars would increase correspondingly so that a new demand destruction euqvilibrium is reached.
I.e. gas oil proces go up by approximately the same amount as the dollar fell and most people (75%) would find equivilibium at a slightly betteraffordability (relatively lower prices) while people in the us economy would experience an increase in cost of oil.
What i mean is that it is irrelevant that oil is traded in dollar. It does not at all mean that oil price affordability is immune to currency rate changes.
Affordability and consumption will be shifted from the us towards stronger currencies.
(what do i care what the price of oil is in dollars as long as my cost of gasoline remains at 2% of my disposable income?)
Some economists propagate for china to revalue their currency by up to 40%. Are they really sure they want this? Do the western economy really need hundreds of milions of new gasoline consumers right now, supplies being tight and all? This would increase affordability of gasoline significantly among the new chineese middle class.
What we now is more demand destruction globally, not to make it more affordable to a huge new market.
As far as what peak oil will result it?
I belive ever increasing price the end of the western(us) middle class in those regions that can not adapt to 10$/gallon or more. However we wont go back to the stone age
nor will we have a total collapse. A recession or depression , riche people getting richer, poor people getting poorer and most of the middle class dissapearing.
But would expensive oil be a society changing event in all of the world?
Cheap gasolin is mainly a us (and australian) phenomenon in the western world.
Most european countries (and the one i am from originally) have had gasoline prices near or over 1.5$ per litre since ages.
That is over 6$ per gallon. Japan is the same.
And those societies have adapted and even do flourish. But you dont see many SUVs on the roads though.
These countries have adapted to very expensive gasoline and
oil over the last 30 years and are much less sensitive to the oil price. Guys, even if the price goes to 6$ per gallon, society will still go on, you will have to adapt a bit but it is doable.
Maybe in the future, europeans will thank their politicians for the often complained about high gasoline taxes since it might have made their transition to a less-oil world easier?
In the early days of oil the USA was the main producer, consumer and exporter, hence the oil trading markets formed there and traded in US$, much as many commodity markets formed in London and traded in UK £ in the days of British Empire.
That oil is traded in $ has been critical for the US. It increases the circulation and demand for $, and increased inward investment into the USA. That has allowed the US to run otherwise unsustainable trade deficits, import goods a low relative price, have a higher standard of living than would otherwise be possible.
Despite doubling GDP growth relative to oil consumption since the early 1970s (nearly all that improvement was by 1990, though), the US is still nearly twice as inefficient on this measure than other developed countries.
The $ price of oil has been very insensitive to the relative value of the US$ versus other currencies over the last 3 years.
Sooner rather than later this close link of oil price and $ will begin to break, for many reasons. Then the long free lunch of the US economy will commence unravelling: the $ will devalue significantly (probably halving in value over maybe 3 or 4 years), the price of oil in $ will shoot up even more than for other currencies, the US economy will tank. The "Great Global Depression" will have begun.
It will hurt all developed countries badly, but the USA most badly. The US has been consumer of last resort for a large proportion of global manufactures and raw materials and, to a large extent, it will no longer be.
The situation is complex. How peak oil, the unravelling of the petrodollar, the depression, all interact is very difficult to predict. It is very likely that consequent geopolitical events will intervene and mask that interaction.
I've posted a few of my thoughts on a blog:
http://theslide.blogspot.com/