Modeling Bakken Oil Production: The Oil Shock Model Explained
Posted by JoulesBurn on August 30, 2013 - 11:25am
| This is a guest post from WebHubbleTelescope. Here he provides a simplified explanation of his Oil Shock Model as applied to oil production from the Bakken formation. Previous contributions to THe Oil Drum from WHT can be found here and here. |
My premise for participating was that I wanted to see how far I could get in understanding our fossil fuel predicament by applying the mathematics of probability and statistics. There were enough like-minded individuals that it turned out to be a productive exercise, and I found that even the contrarian and cornucopian viewpoints could add value.
This was an ongoing process and I documented my progress with occasional posts on TOD and regular posts on my blog http://mobjectivist.blogspot.com. I treated the process as an experiment and as I collected more pieces of the puzzle, I realized that I had collected enough information to aggregate it into a more comprehensive format.
This work eventually went into an online book, which is available via Google Books at the link below, which you can also download as a PDF for a Kindle: http://books.google.com/books/about/The_Oil_Conundrum.html?id=oY2ZPn5EOTQC
After I finished the book (which incidentally I titled The Oil ConunDRUM as a nod to The Oil Drum) the mobjectivist blog went dormant. I essentially treated that bog as a lab notebook, and I considered that notebook was complete and finished as a historical record of what went into the book. So everyone that mourns the closing of The Oil Drum has to remember that progress marches on, and something else will spring from the analysis and research that went on here.
In passing, and as a short note to what one can do with some of the research that went into The Oil Conundrum book, I thought to consider explaining how we can apply the Oil Shock Model to projecting future Bakken formation production rates.
Several TOD commenters have asked for a simple and intuitive definition for how the shock model works, and it has always been a challenge to express it concisely. In mathematical terms, it is simply the application of the convolution function to a model of the statistical flow rate operating on the reserve potential of the reservoirs of interest.
The problem in casting it in this stark a mathematical form has been that the concept of convolution is neither intuitive nor readily available to the layman. For example, the Excel spreadsheet application does not have a convolution function in its toolbox of statistical operators. This is odd considering that the great statistician William Feller once remarked that “It is difficult to exaggerate the importance of convolutions in many branches of mathematics.”
The best intuitive explanation that I can come up with is that a convolution (in the oil production context) is a "sliding" summation of extraction applied to reserves.
Thus, the convolution algorithm automatically keeps track of older reserves as well as new reserves as the total production accumulates with varying levels of extraction over time. Whether this is completely intuitive to the layperson, we can always remember that a convolution is largely a cookbook accounting exercise and once the form of the two inputs are known, a simple algorithm can be applied to obtain a result.
For modeling the Bakken ala the convolution-based shock model, the inputs are two time-series.
- The forced input is the time series of newly available wells.
- The response input is the time series of expected decline from a single well.
The convolution function takes the forced input and applies the response input and generates the expected aggregate oil production over time.
DC at his blog http://OilPeakClimate.blogspot.com/ has used this approach to good effect in modeling historical and projecting future Bakken production. I apply a slightly different response function than DC and get this shock model output:
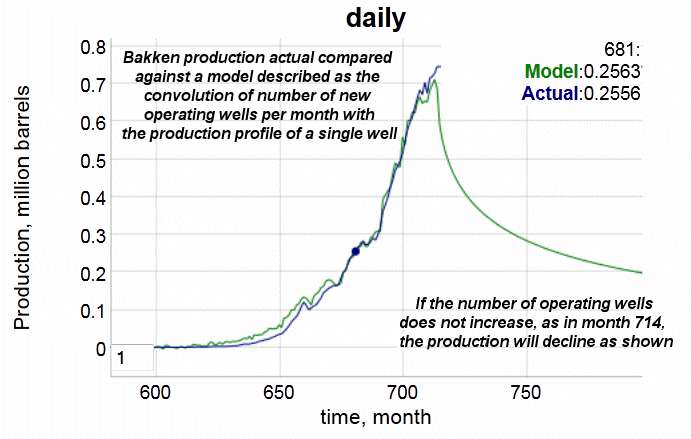
Month #714 on the time series is essentially up-to-date, so that this is a modeled profile of the past 60 years of Bakken activity, using the historical monthly well numbers as input (from http://www.dmr.nd.gov/oilgas/stats/historicalbakkenoilstats.pdf).
The two curves correspond to (1) the actual production data and (2) that which is modeled after applying the convolution-based shock model to the well build-up, assuming a fairly rapid decline response per well. The decline after month 714 would show what would happen if no new wells were added. That of course won't happen, but it illustrates the Red Queen effect that Rune Likvern has argued on these pages. The Red Queen hypothesis is that production will continue to increase as long as a fresh supply of new wells with nominal reserve potential comes on line at a good pace.
As a detail, where DC and I differ is in how we apply the response model for the average well. I have been applying a diffusional model based on the physics of flow, whereas DC has been using a hyperbolic decline model which is favored by reservoir engineers. Not much of a difference between the two, apart from gaining an understanding of what is actually happening underground, which is likely an initially rapid diffusional flow followed by a the long tails of a diffusional decline.
As a caveat, the model would likely work even better if the North Dakota Department of Mineral Resources had kept a cumulative total instead of an active count in their PDF table --
but as is the case with most of the data, you use what you can get.
The take-home point is that analysis approaches do exist outside of the insider oil patch knowledge-base. Us mere mortals can formulate and apply these simple models to at least try to get a handle on future fossil fuel supplies. That was the objective that I had when I started my blog and followed along with TOD as we watched crude oil production plateau the last 9 years.
---
Doing this work on applying probability and statistics to the energy predicament has opened up other possibilities which I have since pursued. Recently I have started up another blog on general environmental modeling called http://ContextEarth.com. This has an associated interactive modeling web server called the Dynamic Context Server, which builds up from a semantically-organized knowledge-base of land, water, and atmospheric information.
I have incorporated the shock model as one of the functionalities in the server and intend to maintain other capabilities to make it useful for environmental model activities, such as wind, solar, and transportation simulations. Comments and collaboration opportunities are welcomed.
As you can see, The Oil Drum is only a start to the on-going energy transformation that we are going through.
Contact
- Content: editors at theoildrum dot com
- Tech support: support at theoildrum dot com
License

This work is licensed under a Creative Commons Attribution-Share Alike 3.0 United States License.
WHT,
Any thoughts on how to incorporate price effects - e.g., the effect of the recent price hike, which took Bakken production from it's former peak to a new growth phase?
Nick,
Both DC and Rune Likvern are trying to incorporate pricing into the Bakken model.
DC talks about price pressure here:
http://oilpeakclimate.blogspot.com/2013/06/future-bakken-crude-oil-outpu...
RL here, where he shows negative cash flows
http://www.theoildrum.com/node/10102
The thinking is that the profit margin isn't that great and some have even speculated that many operators will lose money. It sounds very similar to making a Hollywood movie -- all the costs are eaten up during production with few films actually making money.
The early days include some wells that were borderline conventional wells, which made them more competitive with other conventional wells in that timeframe. But there weren't many like that, and it took the price increases to open up the rest to hydrofracturing technology.
[edit to add weren't]
Correction, in the last sentence: "But there weren't many like that".
I didn't want to edit and send it back into moderation. Sorry for delays in responding if I include links. I have today off from work so can respond to questions quickly if no links are involved.
In an ideal world, we'd have a single model that could project production for multiple price levels. That is to say, something that in 1980 would have projected a ND peak of around 150k bpd under a regime of $25 oil, and in 2007 would have projected a peak above 800k bpd for $90 oil.
A "supply function": supply vs price.
My suggestion for these Bakken wells is to have a good model for when they get shut-in. That would suggest the minimum level of production while still maintaining profitability.
Can these wells be refractured after production falls? IOW, is EOR possible?
You had the right scent when you brought up price but lost the trail with this last question. It is the strong gas drive that makes these Bakken wells pay off quickly. Once that pressure is down the dribbles that gravity will draw through those tiny cracks will still be tiny dribbles with twice as many cracks. Refracking won't do much to increase the gas pressure around a gas depleted horizontal run.
On the price thing, we can certainly evision that once a certain price threshold is achieved somewhat less sweet spots will begin to pay and that those less and less sweet spots will encompass greater acreage. More or less an inverse relationship between sweetness and area...but what we can envision and the real facts under the ground might diverge wildly.
Oh and Web's diffusion light bulb came on when I posted this chart from the Great Bear site

Rock's comment on the chart was more or less that is was a crock as below a certain size crack oil just wasn't going to have a significant increase in flow...but he kind of skipped mentioning that gas flowed through those smaller cracks quite readily and that the increased gas drive those cracks create might be the the real pay off.
This is a representation I made of the diffusional model:
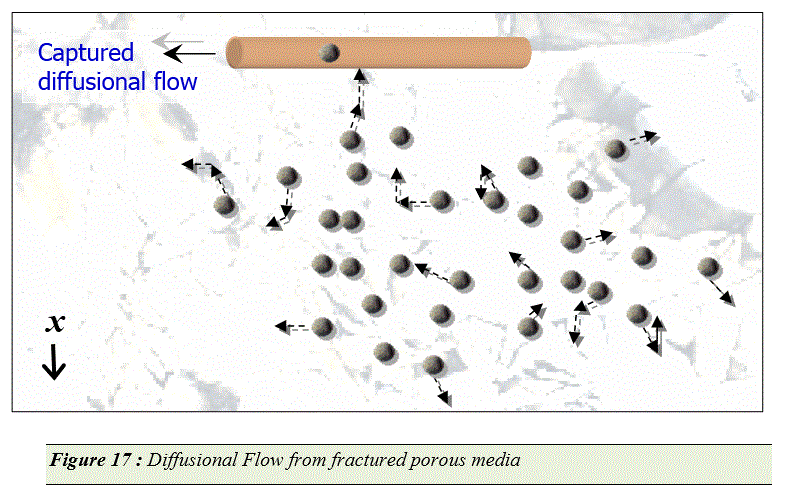
The fissures are truly random pathways and the oil randomly walks to the collection point as shown. They could just as easily travel away from the intended direction. It is true that the pressure release enhances the flow but this flow is not as direct as a straight line. There is really no control over the fissure formation.
The substantiation of this model is that the production follows a type of inverse square root of time dependence, which is the signature of Fickian diffusion.
Look at the diffusion paper on the ContextEarth blog linked to above (go to Figure 17 shown above to find the right section). Diffusional models are fairly general and can be used to describe lots of applications. One of my favorite recent ones is that of Lithium ion battery charge and discharge.
The math is very similar to oil flow, ions in the Lithium composite have to follow a random walk to move between the anode and cathode. The random walk helps prevent the battery from discharging (or charging) all at once.
It is really diminishing returns after the first fracturing attempt.
The model is one of diffusive flow, so if the volume is fractured one time, the second time the fluid gets even more dispersed to points even further away from the collection points.
I have a paper describing diffusive flow on the ContextEarth server linked above that describes the math.
They do refrac in some cases. While it is "diminishing returns", sometimes a refrac can increase production enough to be worth the expense to the operator. However refracs probably won't change the "big picture" of Bakken production all that much.
The technology of controlling fracs has become sophisiticated enough that in some cases the refrac can open up new rock that wasn't fractured in the initial job. Or a refrac may help when the original frac wasn't optimally done. See for example Restimulating the Bakken: What have we learned?
Is there something fractual in all this?
The model is one of diffusive flow, so if the volume is fractured one time, the second time the fluid gets even more dispersed to points even further away from the collection points.
Your model may be diffusive flow and it may well mirror the actual oil and gas flow rates, but what you must realize is the diffusion in fracking is the creation of the fractures themselves. Once the big frac pumps shut down the fluids are not diffusing anymore, they are all following the path of least resistance from a high pressure environment to a low pressure environment. And that path is always little cracks feeding bigger cracks because bigger cracks relieve pressure faster...as long as they stay open.
Wouldn't that be more like the reverse of diffusive flow just as much as tributary springs flowing into brooks and creeks creeks, flowing into rivers and ultimately into the ocean is the reverse of diffusive flow. Of course evaporation from those water courses and bodies is diffusive flow and it does keep the cycle going but that is another story and is not what is happening in a fracked well.
The pressure from the over burden is relentless and is always closing down fizzures pores that no longer have enough fluid in them to push back. Its always a big squeeze out of any fluid that can escape to low pressure areas just as long as the channels stay propped open. Refracking will still have the liberated fluids attempt to leave high pressure environment for the low not disperse them away from collection points for just as long as the refracking leaves open paths to the low pressure zone.
I responded yesterday with an image from my paper but that got held up in moderation, so this is what I said without the Figure 17 from the paper.
The fissures are truly random pathways and the oil randomly walks to the collection points. They could just as easily travel away from the intended direction. It is true that the pressure release enhances the flow but this flow is not as direct as a straight line. There is really no control over the fissure formation.
The substantiation of this model is that the production follows a type of inverse square root of time dependence, which is the signature of Fickian diffusion. I add an element of dispersion to the flow which allows a range of diffusivities to the mix.
Look at the diffusion paper on the ContextEarth blog linked to above (go to Figure 17 to find the right section). Diffusional models are fairly general and can be used to describe lots of applications. One of my favorite recent ones is that of Lithium ion battery charge and discharge.
The math is very similar to oil flow, ions in the Lithium composite have to follow a random walk to move between the anode and cathode. The random walk helps prevent the battery from discharging (or charging) all at once.
Once it gets to a river, that is definitely a gravity-fed flow. However, for tracing of flow through porous media, hydrologists measure what are called breakthrough curves, and these are largely diffusional flow with some gravity feed as well. I solved these dispersive transport equations in The Oil Conundrum, and that is why it was fairly easy to make the connection to the Bakken flow rates.
The Bakken flow is extremely diffusional because it has the strong diffusional spike at the beginning followed by the fat-tails. Reservoir engineers use a heuristic curve called hyperbolic decline, which happens to match the dispersive diffusional flow for a specific set of heuristic parameters.
I could post some diagrams, but that would just go back in moderation, so I suggest you look at the diffusional paper on the ContextEarth site and also The Oil Conundrum book where I have a chapter on porous media dispersive diffusional flow.
The fissures are truly random pathways and the oil randomly walks to the collection points. They could just as easily travel away from the intended direction. It is true that the pressure release enhances the flow but this flow is not as direct as a straight line. There is really no control over the fissure formation.
I never claimed the flow to be a straight line, the randomness of fissure direction is what makes your diffusional flow math work, however the flow is not truly random. The fluids are moving from high pressure to low pressure zones following the path of least resistance through open pathways many of which only remain open because of the propant injected into the them.
The high initial flow after the first frac' job is generally very dependent on the gas drive. That was my quibble when you described the diminishing returns of a refrac job to Nick. The first frac' job will have found most of the larger natural fissures thus the bulk of the mobile fluids in the horizontal well's sphere of influence. That is the main reason a second frac' would have diminishing returns--there just won't be that much mobile gas and oil left for the horizontal run to liberate--it wouldn't be because the new pathways opened will offer even longer routes from high to low pressure zones or even that some of those longer routes lower pressure zones will lead to already drained dead ends--though both are likely results of a second frac' job.
Unlike near surface water moving through porous medium fluids trapped in the Bakken medium won't move much at all until a pressure differential is made available to them--a pressure differential like the one created by frac'ed pathways leading to the horizontal collection pipe. As long the pathways from higher to lower pressure remain open, the fluids will be travelling to low pressure from high regardless how random the the direction of the pathway looks.
Without direct evidence that the flow is not random, the best we can do is look at the empirical flow rates of a typical well. This seems to fit best either a diffusional flow profile or a hyperbolic profile with a tuned exponent. The former is based on physics while the latter is a heuristic.
That essentially describes my model of the initial fracturing attempt.
Perhaps what happens on successive fracturing attempts is a moot point. The speculation is the amount of oil rapidly diminishes -- but without some data to analyze, we are guessing as to what the flow actually looks like.
I guess the next logical question is: is there a price for oil at which it would be worth drilling new wells in between the old ones – In other words is there a price point at which well spacing changes?
Here's the history: https://www.dmr.nd.gov/oilgas/stats/DailyProdPrice.pdf
I'd argue that production is driven by profit rather than price. Consumption however is likely pretty much a function of price.
If one assumes a required minimum return on capital OVER TIME profit and price then should be causal but certainly not in the shorter run. What constitutes short run vs long run is related to the nature of the project. Short run for somebody selling oysters is different from somebody developing oil fields.
Rgds
WP
Full disclosure: I failed Maths 101, so I find WHT's posts hard to follow.
Wolfram Alpha has an animated explanation of convolution. I sort of understand the animation, but am not sure how to apply it. http://mathworld.wolfram.com/Convolution.html
Correct me if I am wrong, but convolution is a cookbook technique for doing mathemagically what could be done with a lot of patience and a spreadsheet.
I produced this graph with a spreadsheet. Assume a well like the red line with production of 100, 60, 40, 30, 25, 20, ... in succeeding years (these numbers are just a guess for illustration, not based on any real well), and open one new well a year. Then production will be as follows:
If I could do convolutions I could produce the totals 100, 160, 200, ... mathematically without having to draw up a spreadsheet.
The accuracy of the model depends on two factors:
1. The correct shape of the well depletion curve.
2. The correct prediction of the number of wells drilled.
If sweet spots are drilled first one would expect individual wells to become less productive with time, and the number of wells drilled to decrease. I presume these changes over time can be modelled mathematically as well.
So, assuming WHT has done his sums correctly, and I believe he has, one's assessment of the model must depend on one's assessment of how closely the depletion curves and drilling numbers match reality.
I think these input factors should always be shown along with the final output curve.
Final question: Why is it called a shock model?
Aa, you have the algorithm down about right for convolution.
In the context server that I mentioned, the calculation uses an expressive language whereby one only has to write the phrase, A convolve B, to invoke a convolution. It is commutative so that the order does not matter.
It is called the shock model since one can add perturbations, or slight shocks, to the extraction rate as a final step. This is normally used for significant geopoltical shocks, as described in Stuart Staniford's last post.
WHT
I am glad you got this piece written and my thanks to you and Joule for posting.
I find it helpful and will be pleased to follow your future 'experiments' with data in a variety of fields!
That DC and Rune take a very similar approach to data is encouraging.
I await developments.
Even if I can 'follow' your logic, it does not mean that I could engage in creative or critical discussion of methodology (!) but I am personally encouraged that you engage with 'entropy' as a basis for your logic concerning probability, and that you appeal to known physical processes such as diffusion in the case of tight-oil. All of which does indeed seem fundamental for the outcomes we are interested in, if and when as you say the numbers are available.
Thanks again
Phil H
PS Can the 'shock' approach be used to test historical data retrospectively - e.g. perhaps looking at USSR oil production, to test assumptions about industrial / technological / political continuity, or indeed somewhat differently, effects of technology innovation? Perhaps to get a handle on the size of 'shocks' and their effects? For the latter there is the example of USA tight-oil extraction emerging during extraction from 'almost-conventional' oil-bearing formations, and then expanding into a new phase with a new territory of opportunity. This was itself a 'shock', no?
Thanks Phil
Certainly. In the book that I linked to, "The Oil Conundrum", I have more thorough examples of how the shock model applies to historical geopolitical situations.
The Bakken example of this post is the simplest case of the convolution approach and so does not incorporate the shocks of sudden changes to production levels.
A good example of a simple shock is looking at the historical UK North Sea production and then consider the Piper Alpha incident. This caused a depression in extraction levels that the shock model can approximate, resulting in the "dual hump" of UK oil production levels. This is also described in the book.
This is an example of the shock applied to the UK production using the convolution-based shock model:
The lower left is an extraction rate profile, which models the actual production level on the upper right. The main point is that relatively small perturbations on the extraction rate leads to noticeable changes in the production. The Piper Alpha caused both a reduction in that platform, but also an overall reduction in the North Sea extraction as safety concerns propagated down the line to other platforms.
Thank you for your reply.
I'm puzzled by this - do you mean cumulative production, or something else?
When a well stops producing it no longer shows up in the statistics. That makes it hard to tell what the true cumulative is and how many new wells are being added. In other words, the running total is new wells minus those removed, with no distinguishing between the two.
If you pay the N Dakota Department of Mineral Resources you can get the detailed records from what I understand.
One remark about Milton Friedmann and the idea that from an economic point of view, oil will never be short. He was not arguing that oil would never run out. He was just saying it wouldn't matter if it did.
I guess to an economist a spear has the same utility as an atom bomb if you don't have an atom bomb.
The given link did not bring me to a pdf file of the book.
(My books are free on line, but I'm a long ways up stream from you guys.)
To find my books, Google for Jon Claerbout books
You can also download it from the http://ContextEarth.com semantic web server
Go to the menu item labeled The Oil Conundrum and that will take you to the PDF.