The Derivation of "Logistic-shaped" Discovery
Posted by nate hagens on June 26, 2008 - 10:00am
| This is a guest post from WebHubbleTelescope. The post addresses the origins and relevance (or lack thereof) of the logistic equation as it is commonly used in projecting/modeling oil production forecasts. As far as I can see, this is the first time anyone has succeeded in deriving the Logistic oil model from first principles. I will follow this with a post on the Maximum Power Principle next week, which in my opinion may shed light on the logistic curve from the perspective of oil 'demand' (as opposed to supply). |
Many people believe that the Logistic equation adequately models the Hubbert peak. This comes about for a few reasons:
- We can (often/occasionally) get an adequate heuristic fit to the shape of the production data by matching it to a logistic sigmoid curve.
- The logistic-growth formula dU/dt = U(U0-U) carries some sort of physical significance.
- The logistic has hung around for a long time, in modern terms, therefore it must have some practical value.
I see nothing wrong with the first reason; scientists and analysts have used heuristic curves to fit to empirical data for years and a simple expression provides a convenient shorthand for describing the shape of a data set. In the case of the Hubbert peak, we get the familiar S-function for cumulative production, and a bell-shaped curve for yearly production -- both characteristics that describe the Hubbert peak quite nicely to first-order.
As for point #2, we usually see hand-wavy arguments that point to an exponential growth that causes the peak oil curve to rapidly increase and then levels off as a negative feedback term in the equation takes over. What I consider circular reasoning with respect to Hubbert Linearization supports the idea that a physical process must drive this effect -- perhaps something similar to the constrained growth arguments popularized by Verhulst:
Unfortunately, I have never seen a derivation of this idea to oil production, at least to my liking. Most proofs have simply asserted that the relationship fits our intuition and then the equation gets solved with the resulting sigmoid curve (here or here ):
U(t) = 1 / (1/U0 + 1/AeBt)I have problems with these kinds of assertions for a number of reasons. First of all, the general form of the resulting expression above can result from all sorts of fundamental principles besides the non-linear differential equation that Verhulst first theorized. For one, Fermi-Dirac statistics show the exact same S-curve relation as described by the U(t) formula above, yet no respectable physicist would ever derive FD by using the dU/dt = U(U0-U) logistics-growth formula. Most physicists would simply look at the relationship and see a coincidental mathematical identity that doesn't help their understanding one iota.
Secondly, one can play the same kind of identity games with the Normal (gaussian) curve, which also gets used occasionally to describe the production peak. In the case of the gaussian, we can generate a similar non-linear differential equation dG/dt ~ -t*G which also "describes" the curve. But this similarly says nothing about how the gaussian comes about (the central limit theorem and the law of large numbers), instead it only shows how a mathematical identity arises from its parameterized curvature. This becomes a tautology, driven more by circular reasoning than anything else.
The last point of the logistic having implicit practical value has the historical force of momentum. This may seem blasphemous, but just because Hubbert first used this formulation years ago, doesn't make it de facto correct. He may have used the formula because of its convenience and mathematical properties more than anything else. I have either tried to contradict the use of the Logistic or searched for a fundamental derivation for some time now, but since everyone has shown some degree of satisfaction with the logistic, I haven't had much success until now ...
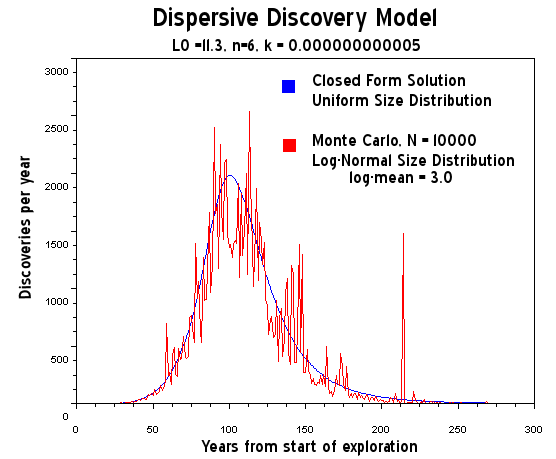
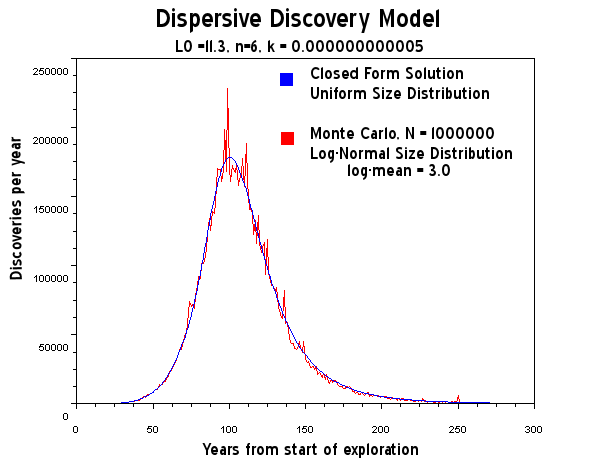
The breakthrough I have come across uses the Dispersive Discovery model as motivation. This model doesn't predict production but I figure that since production arises from the original discovery profile according to the Shock Model, this should at least generate a first-principles understanding.
In its general form, keeping search growth constant, the dispersive part of the discovery model produces a cumulative function that looks like this:
D(x) = x * (1-exp(-k/x))dD(x)/dx = c * (1-exp(-k/x)*(1+k/x))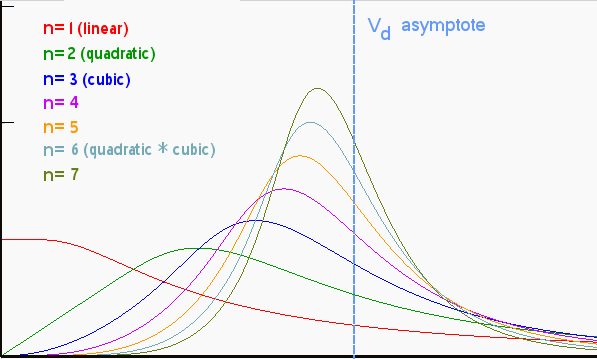 I generated this set of curves simply by applying growth terms of various powers, such as quadratic, cubic, etc, to replace x. No bones about it, I could have just as easily applied a positive exponential growth term here, and the characteristic peaked curve would result, with the strength of the peak directly related to the acceleration of the exponential growth. I noted that in an earlier post:
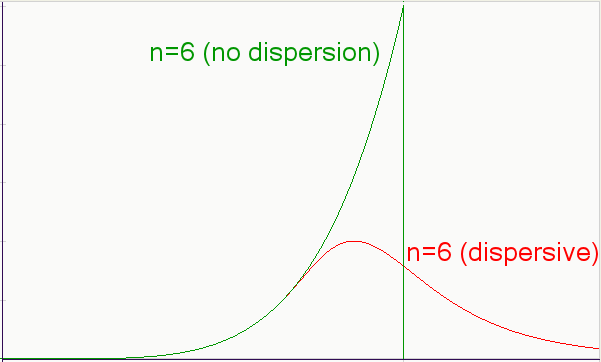
As for as other criticisms, I suppose one could question the actual relevance of a power-law growth as a driving function. In fact the formulation described here supports other growth laws, including monotonically increasing exponential growth.Overall, the curves have some similarity to the Logistic sigmoid curve and its derivative, traditionally used to model the Hubbert peak. Yet it doesn't match the sigmoid because the equations obviously don't match -- not surprising since my model differs in its details from the Logistic heuristics. However, and it starts to get really interesting now, I can add another level of dispersion to my model and see what happens to the result.
I originally intended for the dispersion to only apply to the variable search rates occurring over different geographic areas of the world. But I hinted that we could extend it to other stochastic variables:
We have much greater uncertainties in the stochastic variables in the oil discovery problem, ranging from the uncertainty in the spread of search volumes to the spread in the amount of people/corporations involved in the search itself.So I originally started with a spread in search rates given as an uncertainty in the searched volume swept, and locked down the total volume as the constant
k=L0. Look at the following graph, which show several parts of the integration, and you can see that the uncertainties only reflect in the growth rates and not in the sub-volumes, which shows up as a clamped-asymptote below the cumulative asymptote: I figured that adding uncertainty to this term would make the result more messy than I would like to see at this expository level. But in retrospect, I should have taken the extra step as it does give a very surprising result.
That extra step involves a simple integration of the constant
I figured that adding uncertainty to this term would make the result more messy than I would like to see at this expository level. But in retrospect, I should have taken the extra step as it does give a very surprising result.
That extra step involves a simple integration of the constant k=L0 term as a stochastic variable over a damped exponential probability density function (PDF) given by p(L)=exp(-L/L0)/L0. This adds stochastic uncertainty to the total volume searched, or more precisely, uncertainty to the fixed sub-volumes searched, that when aggregated provide the total volume.The following math derivation I extended from the original dispersive discovery equation explained in my TOD post "Finding Needles in a Haystack" (read this post if you need motivation for the general derivation). The first set of equations derives the original dispersive discovery which includes uncertainty in the search depth, while the second set of equations adds dispersion in the volume while building from the previous derivation.

 we come up with various kinds of cumulative discovery curves.
Note that the exponential term from the original dispersive discovery function disappears. This occurs because of dimensional analysis: the dispersed rate stochastic variable in the denominator has an exponential PDF and the dispersed volume in the numerator has an exponential PDF; these essentially cancel each other after each gets integrated over the stochastic range. In any case, the simple relationship that this gives, when inserted with an exponential growth term such as A*eB*t, results in what looks exactly like the logistic sigmoid function:

- It models a discovery profile.
- The search rates are dispersed via an exponential PDF
- The searched volume is dispersed via an exponential PDF
- The growth rate follows a positive exponential.
In the end, intuitive understanding plays an important role in setting up the initial premise, and the math has served as a formal verification of my understanding. You have to shoot holes in the probability theory to counter the argument, which any good debunking needs to do. As a very intriguing corollary to this finding, the fact that we can use a Logistic to model discovery means that we cannot use only a Logistic to model production. I have no qualms with this turn of events as production comes about as a result of applying the Oil Shock model to discoveries, and this essentially shifts the discovery curve to the right in the timeline while maintaining most of its basic shape. In spite of such a surprising model reduction to the sigmoid, we can continue to use the Dispersive Discovery in its more general form to understand a variety of parametric growth models, which means that we should remember that the Logistic manifests itself from a specific instantiation of dispersive discovery. But this specific derivation might just close the book on why the Logistic works at all. It also supports the unification between the Shock Model and the Logistic Model that Khebab has investigated last year.
A different question to ask: Does the exponential-growth double dispersive discovery curve (the "logistic") work better than the power-law variation? Interesting that the power law discovery curve does not linearize in the manner of Hubbert Linearization. Instead it generates the following quasi-linearization, where n is the power in the power-law curve:
dU/dt / U = n/t * (1 - U/URR)Note that the hyperbolic factor (leading 1/t term) creates a spike near the U=0 origin, quite in keeping with many of the empirical HL observations of oil production. I don't think anyone has effectively explained the hyperbolic divergence typically observed. Although not intended as a fit to the data, the following figure shows how power discovery modulates the linear curve to potentially provide a more realistic fit to the data. It also reinforces my conjecture that these mathematical identities add very little intuitive value to the derivation of the models -- they simply represent tautological equivalences to the fundamental equations.

As another corollary, given the result:
D(x) = 1/(1/L0 + 1/x)L0 = 1/(1/D - 1/x)
References
Contact
- Content: editors at theoildrum dot com
- Tech support: support at theoildrum dot com
License

This work is licensed under a Creative Commons Attribution-Share Alike 3.0 United States License.
Given the vast number of variables that we have to deal with, I have tried to go with the simplest quantitative modeling tool that appears to provide some plausible results. I think that a good way to evaluate the HL method is to generate some predicted production curves for regions that have peaked, using only production data through the peak date to generate the predicted curve--and then compare the predicted post-peak cumulative production to the actual post-peak cumulative production for a given region. This is what we (my idea, Khebab's hard work) did in the following article:
http://graphoilogy.blogspot.com/2007/06/in-defense-of-hubbert-linearizat...
In Defense of the Hubbert Linearization Method (June, 2007)
BTW, I should add a fairly self-evident point, to-wit, that the HL method can't "see" the production from immature and/or undeveloped basins. Of course, the problem is that there are fewer and fewer basins that are in this category, and then the question is how material they will be to a given region and to the world.
I think the procedure you referene in the other post is really providing a false sense of accuracy -- at least there are some implicit assumptions that are never explicitly addressed. The biggest influence on your outcome is:
How do you choose the points to which the model is fitted? In the post above, you say "...using only prodcution data through he peak data to generate the predicted curve"; however, in the link you clearly state only the "green" points are used to fit the model. Clearly, there are several points prior to the "green" points that are not included in the modeling process. My question remains:
1. How do you choose the green points?
2. How much does the answer vary if choose a different range of green points?
3. A true estimate of the variance of the curve could be gleaned if you randomly chose x points prior to the peak, doing this several hundred times and getting an empirical confidence interval. Have you done this?
While I am a statistician, I have worked extensively with physicists -- which it appears that OP is, also the love for the power law gives it away a little :) The point is that the model needs to be chosen based on a defendable reason versus quantitative convenience. In my opinion, this becomes more of a necessity as Peak Oil becomes more "mainstream" and people begin to investigate some of the claims. It becomes fairly easy to establish numerous counterexamples where the HL procedure is shown to be quite ineffective or exhibits a lack of robustness.
I'm actually a physicist, and I agree with your requirement of defensible reason being more important than quantitative, but there is, as a physicist, some wriggle room. It depends on the quality of the data and the stage of development of the theory. For example, in Verhulst's time, there was no data with which one could do a reliable study of the effect of starvation alone, as opposed to starvation and disease, or starvation and war, etc. So Verhulst chose to simply posit that population tended toward a saturation number that was a new parameter in the Malthus model. In the absense of any real data, this was little more than an intellectual place holder for the idea that this model can't possibly be complete.
Then a century later Hubbert needs a simple formula for a time dependent quantity that starts very small, grows to a peak and then declines, ultimately to zero. He sees that Verhulst equation meets his criteria and uses it.
The Gauss normal curve also meets these theoretical criteria. I tried Gauss curve when first learning about PO. It leads to very messy algebra. There was no theory that supported using Gauss in this situation. The central limit theorem applies to large numbers of statistically independent events. Since I didn't want to use Gauss because the algebra was messy, it was easy for me to convince myself that there were surely not a large number of independent events in this situation.
He, like a physicist, doesn't have to justify trying it. Using it only needs justification if it works, and then the justification is more a discussion of what work needs to be done to develop a proper theory. Among other things, one needs to develop a good procedure for selecting data.
Elsewhere in the discussion I've posted a comment about how troubling it is that Hubbert linearization requires that the Hubbert peak be symmetric.
I think that we may very well witness the post peak decline in real life before we have a adequate theory of how to predict it. What we have now is good enough for economic hand waving, but as soon as decline is real there will be rapid changes that will lead to big forced changes in human behavior.
The Gauss Normal curve only kicks in when you apply the Shock Model to the discovery curve. The shock model places convolutions of slight production shifts corresponding to the fallow, construction, maturation, and extraction phases after the initial discovery (i.e. a sequence of statistically independent events). This trends the production curve to look more Gaussian.
You should look at this post http://mobjectivist.blogspot.com/2008/03/street-lamp-understanding-of-sh... to see how this all works in the context of the Oil Shock model. Convolutions of gaussians result in gaussians and all curves trend toward this property as a consequence of the CLT:

The only minor issue I have is this statement of yours:
"He, like a physicist, doesn't have to justify trying it. Using it only needs justification if it works, and then the justification is more a discussion of what work needs to be done to develop a proper theory. Among other things, one needs to develop a good procedure for selecting data."
Without the theory, this becomes the definition of a heuristic and it prevents us from making as fast a headway as possible. Can you imagine how slowly we would have advanced technologically if everything was based on heuristics instead of fundamental explainable laws such as Maxwell-Boltzmann and Fermi-Dirac statistics? If it wasn't for F-D in particular, we would still be wondering why a semiconductor transistor works at all!!
Otherwise I agree with everything you say and consider Verhulst's approach a deterministic trajectory and not the stochastic trajectory that we really should be using, ala the Dispersive Discovery model.
The key point is to determine if the data set shows a steady linear progression with a P/Q intercept generally, but not always, the 5% to 10% range (there are some outliers, such as the North Sea, an exclusively offshore region with a rapid decline rate). That is how Khebab chose the green points.
We don't have that many large producing regions to study. We can say that our available case histories--Texas (total plot, pre-peak is noisy), the total Lower 48, Russia, Mexico, North Sea, Saudi Arabia etc.--broadly fit the HL model. These regions account for about half of the oil that has been produced to date worldwide.
Meanwhile, what I first warned about in January, 2006--based on a HL analysis of the top net oil exporters--is unfolding in front of our very eyes, an accelerating decline in net oil exports. In fact, based on the HL analysis of Russia, in January, 2006, I gave Russia another one to two years of rising production before they resumed their production decline, and while Saudi Arabia has shown a rebound in production, it is a near certainty that they will show three straight years of annual production below their 2005 annual rate, at about the same stage of depletion at which the prior swing producer, Texas, started declining (all based on HL).
Recent headline:
Declining Russian Oil Production Could Lead to $200 Oil and “Global Recession,” Says Deutsche Bank
You are exactly correct in your observations and the choice of the time interval for the fit is the weakness of this empirical approach.
Yes, but I use a Bootstrap techniques instead in order to derive a confidence of interval which is very often quite large. For instance for Saudi Arabia:
Thanks for the response, Khebab -- this is basically what I was asking. Do points prior to 50 Gb ever get used in the estimation. I guess I am just curious to how long you have to wait to choose a "linear" portion of the profile. Also, how effective is this if the peak hasn't occurred yet?
For instance, what if you started estimating with the first two observations and then updating your estimates as new observations came in. You would get wildly varing answers. Then, eventually, you would have to decide where to quit using early points to capture the linear part of the profile. In the graph above, if the estimation was done using the points between 40 Gb and 70 Gb, we would have estimated the cumulative Gb to be around 85.
In the end, I think this is a decent way to model existing data, but may be poor in making predictions of any accuracy. I just think we have to be careful on how this is presented -- especially when addressing scientifically-minded non-believers.
"Do points prior to 50 Gb ever get used in the estimation"
Look at this mash-up of Khebab's SA data and the USA data from my post above. The data points show more fluctuation for SA below 50 Gb, but they both show that curious hyperbolic curvature indicated by the solid blue line.

As I said in the post, this has to do with the use of power-law discovery as opposed to the exponential-law; the latter gives a perfectly flat HL.
I usually discard the first points because low cumulative production values (Q) will boost small fluctuations in production (P). I usually take P/Q<10% as a cut-off value. Because of integration, the noise on P does not affect Q after a while and fluctuations in P are dampened as Q increases.
Your reddit link:
http://www.reddit.com/info/6p369/comments/ (science)
I'm glad to see that you are still active on that problem.
If I understand correctly you have improved your Dispersive model using a Bayesian approach where the prior on L is specified. You then derive a generalization of the logistic curve (s-curve).
I'm having troubles following changes in your notations, last time you gave:
D(t) = kt6*(1-exp(-Dd/kt6))
It would be helpful to provide a short table linking your model variables to real world quantities:
L0: average depth?
k= Dd: URR
x: the current search depth
etc.
The dispersive model is supposed to model the discovery curve + reserve growth. The way I see it, true reserve growth (i.e. free of political/economical influences and accounting artifacts) is:
1. improved recovery methods applied on fields over time
2. knowledge growth: knowledge of the fields increases with time (i.e. field delineation)
Can you explain what is your interpretation of reserve growth? It seems that in your model, reserve growth comes only from the increase in the search depth which is in fact new smaller discoveries at greater depth over time.
One issue is how to estimate the various parameters from real world datasets. In particular, discovery data is contaminated by backdated reserve growth that is difficult to remove without complete reserve growth history. Reserve growth should be a time-dependent diffusion of the initial discovery volumes. A quick and dirty solution is to first remove reserve growth using a heuristic reserve growth model (e.g. Arrington) and then convolve with the same time dependent reserve growth function which in the case of the Lower-48 gives:
The red curve is now the correct curve where reserve growth is dispersed in time and not instantaneous. IMO, the fit between your model and this new curve is quite remarkable:
Any chance you could graph this method for world production?
Here is a quick trial using the ASPO discovery curve and Russia reserve growth model (Verma et al.):
Here is the fit using the new dispersive model:
Khebab,
I'm a college student and while I am going into Calculus 3 next semester I find this stuff exceedingly difficult to understand, what books, classes or websites might I look at to better understand this statistical modeling. It's tricky :D
Thanks,
Crews
The absolute classic and considered one of the great mathematical texts of the last century is "An Introduction to Probability Theory and Its Applications" by William Feller.
If you want to really get hooked on understanding how the physical world works, I would suggest taking a course on Statistical Mechanics.
Khebab
In my opinion the original discoveries plus a small fraction of the reserve growth is probably a good estimate for the amount of easy to extract oil left.
Just eyeballing the graph to integrate I get.
About 1.7 trillion barrels total.
Original = 1 trillion.
Assume a 20% growth in reserves is easy oil.
1.7*.20 = 340
This gives about 1340 billion barrels of "easy oil".
Lets give this rough estimate a 10% error term or range and its
1206 - 1340.
Given we are I think close to 1100 GB extracted now.
Then we could be at about 80-90% depleted in "easy oil".
This simply little calculation should be enough to make you wonder if we are going to keep production close to the highest levels ever achieved for much longer. Even if you increase the easy oil levels its not hard to see that production rates will probably begin to fall off soon.
The fact that the easy vs hard concept predicts a peak at around 70-78% of total URR inline with WT 60% of URR peak prediction is interesting. The two different approaches are not giving hugely different answers. In fact in my opinion the logistic is telling us a lot about how much easy oil we have left. In fact this easy oil approach does not tell us a lot about peak itself just when decline is certain peak could have been back at 1000 which given a 1700 total is 60% of URR perfectly in line with the logistic.
What the easy oil approach says is that decline is probably certain by 70% of URR or 10% past what was probably peak production.
Time will tell of course but I don't hold high hopes for us getting the next 700GB or 1000GB or whatever number we claim to still have in reserves out of the ground at anywhere near the rate we extracted the first half.
First of all, as everyone realizes this blogspot and scoop blogger software is crap for doing any kind of mathematical markup. Therefore the equations become more ad hoc than I would like, and I resort to using snapshot gifs of markup from various technical equation processing SW apps.
So yes, L0 and Dd both refer to URR give or take a scale factor to convert from some earth volume to cumulative number of barrels. Everything here is dimensionally sound and the time advance of discovery volume follows the URR linearly.
Now here is how the reserve growth comes in. The dispersion in discovery rates gives the source of the reserve growth (not the dispersion in volumes necessarily). The high rates over certain parts of the volume provide the initial fast growth and the slower rates over other parts of the volume give the long tails in the out years. The whole set of rates accelerates over time in terms of mean, but the dispersion stays as the variance of the mean so the slow rates are always there (think dispersion of wavelets, Khebab). I think it is pretty obvious, but no one really understands how to backdate all the discovery curves to reflect this property properly as you indicate. On top of this, the power-law growth rates give much higher reserve growth than the exponential law growth, since the power-law family is stronger initially but weakens in comparison to the exponential as time increases. This turns the strong symmetry in the exponential dispersive/Logistic into the asymmetry of the power-law dispersive. The worst (or best in terms in terms of reserve growth) is fractional power-law growth; this is a diffusion-limited growth that gives incredibly long reserve growth tails. And the diffusion is what you want to see -- my feeling is that the dispersive effects on top of strong technological acceleration outweigh the diffusional aspects on any one particular reservoir. In other words, the statistics rule on an aggregate of reservoirs and the "micro"-diffusion likely applies better to individual reservoirs.
I agree totally with your Arrington approach, but wish we did not have to do this, and suggest that someone place the reserve growth discoveries in the correct places on the timeline.
My problem is how to retrieve the reserve growth function from the available data itself and without access to complete reserve growth history.
Assuming that you have a complete discovery curve for a particular country (e.g. Lower 48) contaminated by backdated reserve growth, I was thinking about the following approach:
1. choose a suitable parametric form for the reserve growth factor function (RGF): RGF(t)= at^b
2. choose values for a and b.
3. remove backdated reserve growth from the original discovery curve.
4. simulate a reserve growth history from the RGF function and the new discovery curve in 3.
5. add simulated reserve growth history to the discovery curve in 3.
5. fit the dispersive model on the new discovery curve.
6. Apply the shock model
7. compare the reserve history generated by the Shock model and available proven reserve history (after anomalous increases removed)
8. go back to 2 and reiterate
9. the best agreement in step 7 gives the more likely parameter values for a and b.
This approach is similar to what I've tried to do with Ghawar (http://www.theoildrum.com/node/2945). I'm also wondering how the (k,n) values for the dispersive values would compare to the (a,b) values.
I think the fundamental distinction between the (k,n) tuple and the (a,b) tuple is that (a,b) always starts at the initial discovery point for a particular region, but (k,n) predates all those points. It is essentially the difference between comparing a(t-t0)^b and k(t-0)^n. The t0 point is based on the discovery time, but t=0 is the time from the start of the search. So the care we must apply is to get the t0 bias correct. For example, if we use a later t0 value for the (k,n) tuple, the reserve growth function will look concave up (2ndderivative positive) whereas we know that reserve growth from the point of the particular discovery is concave down.
Otherwise I think the same principles apply and dispersion looks like a kind of diffusion. The big question that needs to be answered is how strong this search rate is after the initial discovery. Dispersion is us looking for "the stuff", while real diffusion is "the stuff" creeping toward us.
Nate,
OK I skimmed this a bit because my eyes started to glaze over at the math, but if I may paraphrase:
The best fit up to now was one particular equation and now you've discovered that a better fit might be another kind of equation instead.
OK so if you use the newly identified equation to model production, what differences (if any) do we have for total reserves and more importantly, for depletion?
I too would love to hear the "bottom line" for this work.
Can someone succinctly (perhaps WebHubbleTelescope) say what this means when all is said and done? Depletion rates are going to be faster? Peak will be higher? etc.
-André
The bottom line is that this is the first time anyone has ever tried and succeeded to derive the Logistic oil model from first principles. If someone other than me or Khebab who seems to understand the math (i.e. to at least be able to reproduce the derivation) picks this up and applies it to some data sets, we can make some progress in enlightening the masses on how to understand the laws of constrained resources. As I have said elsewhere, this is the most basic bean-counting type of applied probability mathematics that I have ever encountered. Perhaps probability is in my blood, but I find it incredible that no one has ever approached it from this angle before. I am reminded of this saying : "It can't be right. If it is so simple, then why hasn't someone discovered this before?"
In my other area of expertise I have physics algorithms named after me, but I am just a hobbyist in the fossil fuel arena so it will be up to others to decide what to do with this stuff. IMO, that without having a great blog like http://TheOilDrum.com in place, math derivations like this would still be undiscovered or invisible to the masses. I think the whole oil industry is so incestuous and in-grown and cliquish that they have absolutely no avenues to innovative new ideas. This derivation of mine would get buried in no time. Just look at what the Bush administration does to rebellious scientists. Read this post:
http://www.huffingtonpost.com/carl-pope/let-them-hate-so-long-as_b_10440...
I have no doubt that the oil corporatocracy behaves the exact same way.
Thanks, WebHubbleTelescope.
It is indeed wonderful to have TOD to publish your work to a wide audience.
Let me say I have very little understanding of statistics beyond that of the undergraduate level. What I do have is a working knowledge of various methods to predict momentary and cumlative recoveries of product from various chemical processes. The main thing I found was that it was impossible to predict the ultimate recovery with accuracy from the first part of the curve. In fact it was difficult to predict beyound the next inflection point. This was using a known volume reactor. Considering the unknowns such as volume of oil on earth, technology advances and economics, it seemes that at best statistics can only give answers in very constrained scenarios.
Each variable added then produces a new dimension that lessens the certainity of our prediction. As we advance down the time line our uncertainity grows. A year from now we can be resonably certain, ten years we have a glimmer of the possibliities, thirty year from now fa-gid-about-it
I don't understand. Have you looked at the historical world yearly discovery curve? It actually peaked in the early 1960's. It has been on a long steady but noisy decline since. The cumulative discovery reinforces this. Hubbert essentially predicted this decline long ago, even before the peak, but until now I don't think we had a good probability & statistics based derivation of how this dynamic works and the fundamental understanding that comes with it.
It would be the same thing if you didn't understand stoichiometric chemical rate equations, but just applied it blindly based on heuristics. Clearly the way stoichiometry works is clearly understood, and you gain a lot of intuition based on this understanding. That said, oil discovery looks nothing like stoichiometric rate equations, and you lose your intuition instantly if you believe that.
Coincidental?
Maxwell-Boltzmann, Einstein-Bose, and Fermi Dirac were derived from the kinetic theory of gases, an idealized
state, not from fitting empirical data to curves.
http://en.wikipedia.org/wiki/Kinetic_theory
http://en.wikipedia.org/wiki/Fermi-Dirac_statistics
I kinda like your fancy footwork here but...
(P(x)=1/lambda*exp(-x/lambda)..huh? But Sum of P(x)=1?)
and L is a random variable?
As you drill deeper (or wider?) you find less oil....more oil?
I think that Verhulst's 'r' being fixed is a bit of a stretch but there are practical limits to the range of any r(growth rate).
It's been around for a long time because it's a mathematical model just as the time for water draining from a tank is a mathematical model.
Could your model be a little more physical?
P(x)=1/lambda*exp(-x/lambda)
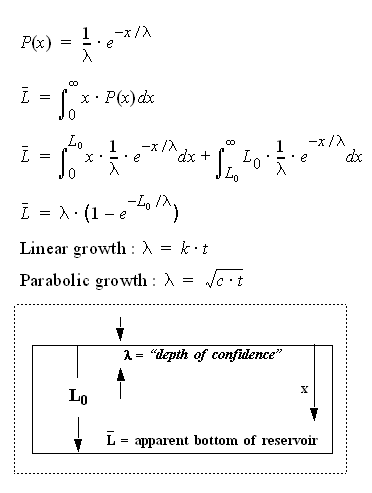
is a PDF so it's normal that Sum(P(x).dx)=1, the average must have some physical meaning E[x]=Sum(x.P(x).dx)= lambda. I think it is an average drilling depth ("confidence depth") increasing with time (lamda=k.t^n).
There is an oil window in the range from 7,000 to 15,000 feet where temperatures are hot enough to "crack" organic-rich sediments into oil molecules but not to hot so that we get natural gas. There should be a way to translate that fact into a proper pdf on L (a Gaussian maybe). There are some arguments discussed in a previous thread:
http://www.theoildrum.com/node/3287
In particular this chart from Hubbert is close to the Dispersive model:
Precisely, I call it a mean confidence depth. The exploration will proceed with an accelerating increase in search volume whether or not the prospectors realize they have exceeded the depth at which further discoveries will occur.
The constrained 7000' to 15000' window would suggest that dispersing the subvolumes is not as important as dispersing the rates, as the original dispersive discovery law argues. The Double Dispersive discovery model would place the mode (most common) closer to zero depth, a mean at (700+15000)/2=11000' and only 5% deeper than 30,000'. The Singly Dispersive model essentially cuts it off at 11,000. The reality is somewhere between the two models. Good observation.
A statement by the late L.F. Buz Ivanhoe from page 2 of the 2nd issue of the Hubbert Center Newsletter http://hubbert.mines.edu 97-1
" Hubbert wrote virtually nothing about details of the “decline side” of his Hubbert Curve, except to mention that the
ultimate shape of the decline side would depend upon the facts and not on any assumptions or formulae. The decline
side does not have to be symmetrical to the ascending side of the curve - it is just easier to draw it as such, but no rules
apply. The ascending curve depends on the skill/luck of the explorationists while the descending side may fall off more
rapidly due to the public’s acquired taste for petroleum products - or more slowly due to government controls to reduce
consumption."
This is quite important to our understanding of the place of the logistic equation in PO: The logistic equation peak IS symmetric. There is no adjustable parameter in it that allows asymmetry. The linear portion of a Hubbert linearization comes from the declining side of the peak. So we must assume that production curve is symmetric, if we want to use HL. Show me where my reasoning is faulty, please.
No fault in your reasoning at all. The derivation above for dispersive/Logistic gives one parameter which is the virtual search growth rate function - an accelerating exponential in this case. (The dispersive factors in rate and volume essentially cancel each other out so they do not show up in the final formula.) If for some reason, the search rate abated as we near or pass the peak, the downslope would show longer tails as the search space takes longer to fully explore.
I'm not sure I understand completely but allow me to paraphrase what I think you're saying:
What it comes down to is this:
If we accept the hubber curve as gospel then the depletion half of the curve must be the same as the the rising part of the curve.
It seems to me that it's about volume under the curve if we accept the peak and decline argument.
I can't remember much math (it's been nearly twenty years since college) so I will say it in English:
The total volume under the curve must equate to the total extractable reserves.
We can have a symmetric curve or an asymmetirc curve.
If it's symmetric (hubble) then the decline rate is identical to the increase rate on the way up.
If the decline rate is slower on the other side, it must first be faster then slower or must first be slower then faster in order for the volume on the right hand side to be equal to the left hand side.
For this to not hold true then additional supply must somehow be brought online.
The one thing that is definitely true is that the volume under the curve is close to the total extractable reserves.
The problem is that English is not the same language as math. But you bring up excellent points. It is entirely possible that I can generate a mathematical identity that looks at the peak position and whether I can generalize that the left side and right side areas under the curves should be equal for certain search functions. I know that is the case for the exponential dispersive (as you say, symmetry does imply that both sides are equivalent in area) and it may prove true for the power-law as well.
In my copious free time, I'd like to make a Youtube demo of how someone like Hubbert would use tools like Hubbert linearization with graph paper and a ruler. The algorithms user in that era were all about that.
How true. Both the cumulative and HL techniques rely on integrated numbers that tend to converge. The demo if shown in "sped-up' real-time would show this convergence as more and more volume is produced.
Hello WebHubbleTelescope,
Thxs so much for this posting, although much is beyond my mathematical grasp. I was wondering if you, Khebab, or if any of the other TOD statistical wizards, have tried your hand at some rudimentary charting of potential Overshoot decline rates-- a rough attempt at being a pioneering 'Hari Seldon'.
Isacc Asimov, author of the 'Foundation' book series, was aware of the Kinetic Theory of Gases, in fact, it formed the simple basis for Hari Seldon's 'Psychohistory' for predictive collapse and directive decline:
http://en.wikipedia.org/wiki/Foundation_series
IMO, the largest TOD debate, and the least defined statistically, is how society will react to Peak Everything. Yet huge sums are already spent on prediction [from Science Magazine]:
http://bpp.wharton.upenn.edu/jwolfers/Papers/PromiseofPredictionMarkets.pdf
--------------------------
The Promise of Prediction Markets
...Prediction markets have been used by
decision-makers in the U.S. Department of
Defense (6), the health care industry (7), and
multibillion-dollar corporations such as
Eli Lilly, General Electric, Google, France
Telecom, Hewlett-Packard, IBM, Intel, Microsoft,
Siemens, and Yahoo (8).
-----------------------
We, of course, know how markets immediately gyrate when USDA crop reports, EIA FF-updates, and other critical news reach decision-makers. Additionally, much evidence exists of super-computing modeling of larger phenomena: military supply-chain logistics, programmed triple-witching days on stock-markets, war-game simulation, etc.
The Hubbert Downslope, plus other global effects, sets up basic schools of predictive decline thought:
1. The Fast-Crash: summarized basically by Jay Hanson's Thermo/Gene Collision timeline prediction, and possibly results in the St. Matthew Island decline path [see first chart]:
http://dieoff.com/page80.htm
If one reads the following article with a pessimistic mindset...
http://www.timesonline.co.uk/tol/comment/columnists/guest_contributors/a...
-----------------------
We can feed the world: look at all the space
It's no wonder food prices are rising. We are exploiting less of the planet for agriculture than we were only a few years ago..
------------------------
...it leads me to argue that primarily due to the rising energy and transport costs of water and I-NPK [which are physically fixed at being heavy and bulky]--I would expect less arable land put to future use unless we had a huge ramping of O-NPK recycling and vast efficiency-improvements in water usage.
Stuart Staniford's expose' argued for no fast-crash, but I feel he might have overlooked, or under-rated the cascading blowback effects of future diminished I-NPK flowrates to poor countries and/or far-distanct and far-inland areas, and the fast-rise in violence in response to this economic demand destruction. Have you considered any attempts at modeling such effects?
2. The normal bell-shaped curve: Is this the shape for optimal decline, and what policymakers should be shooting for in all phenomena that we can effect and chart? Would this result in the maximal preservation of habitats and reduced specie extinction rates? I have no idea, but if you could develop equations to compare to real-life statistics-- it might add great illumination to the course ahead.
3.Jagged decline: I am making the assumption here that this equates with the ArchDruid's catabolic collapse scenario, whereby the grinding process energetically consumes all that it can at various extractive equilibrium points, then drops to the next lower level from the cascading blowbacks rapidly overtaking any possible growth opportunities. Can this be modeled in any way?
I realize that this potentially opens a 'huge can of worms', but I would be grateful to read any statistical efforts in this regard, or any links you may find that show others' efforts at predicting and possibly directing the future ahead. Thxs!
Bob Shaw in Phx,Az Are Humans Smarter than Yeast?
Psychohistory does indeed look like statistical mechanics applied to macro dynamics.
My derivation does have elements of statistical mechanics in it in that it deals with ensembles of workers acting at a mean accelerating rate with a variance of the square root of the mean. We don't necessarily know or care what any one worker is doing, but only look at the aggregate. This whole thing moves forward inexorably and the statistics work out to give us this smooth curve we see.
Thanks for the reference.
The scary part of this is the ignorance part "they should remain in ignorance of the results of the application of psychohistorical analyses". What does this mean? That there is some countervailing force that prevents us from confronting this fact?
Hello WHT,
Thxs so much for the reply! I was just basically trying to fire your synapses to consider this issue, as I have no statistical or scientific skills to be a Hari Seldon, but I suspect you, Khebab, and the other TOD data-wizards could break new ground in this direction.
Matt Savinar [LATOC] has posted numerous Foundation-type links on CIA/NSA and other tracking activity. Everything from cellphone-GPS tracking by the millions, data-mining credit & debit card charges, industrial flows, Census Bureau data...on and on.., presumably to be fed into supercomputers for extensive modeling of each 'molecule' and/or 'mass-gas action'. I have no idea if they have achieved any predictive success [probably highly-classified anyhow], but combined with targeted propaganda and political feedback controls--maybe some progress has been achieved.
Your Quote:
-----------------
The scary part of this is the ignorance part "they should remain in ignorance of the results of the application of psychohistorical analyses". What does this mean? That there is some countervailing force that prevents us from confronting this fact?
-----------------
Others have suggested this is due to our genetic 'optimism bias'; our natural instinct to not anticipate the worse, then mitigate early for it. Makes sense to me because otherwise: you would have seen the whole world radically shift goals after Hubbert's 1956 disclosure, or even earlier when Malthus published his ideas.
BTW, there was more than just one Foundation--as appied to our coming Paradigm Shift: I think Asimov left the idea open that major habitats could individually practice predictive collapse and directed decline for optimality without disrupting the planetary course. IMO, multiple Foundations can create a cross-feeding coalescing function to reinforce larger goals. Brief example: poking carefully positioned holes in a balloon to make the balloon smoothly go one direction vs random holes where the balloon just spins as it deflates.
An real-life example of this is the re-introduction of keystone predators into a habitat. The wolf is radically redesigning the overall ecosystem and other species ratios where re-introduced, yet has no readily apparent effect upon oceanic or distant habitats-- does this readily compare to US soldiers in the MiddleEast as keystone predators to assert the Porridge Principle of Metered Decline? I have no idea, just some more food for your thoughts.
The problem even for psycho-historians that can predict the future is that making public the prediction might invalidate the assumptions of the prediction. The model would need to include the effect of the output of the model, making for a tricky model. The psycho-historians work in secret, lest their studies influence what they are studying.
The psycho-historians also had an executive branch, to manipulate events to steer the future in a desirable direction. This might involve putting players in key positions or conversely, assassination of key players. Both of which could have negative impacts on the public mood, so are best kept secret.
Makes sense. These guys are the complement to conspiratorialists, working in a mirror universe. Bad conspiracies that fool gullible people may in fact be a key tool of psychohistorians, as they can keep the masses occupied while they concentrate on some deeper ruse.
More math but this decline question is handled by applying some principles that I learned from Vector Analysis and Calculus long ago. The discovery search function is actually like a path function that acts like speed on a vector segmented curve. You can follow the vector trajectory around the space but the speed is how you parameterize the motion. That "speed" is the path function that we can insert with either exponential or power-law growth, or some other growth that you can dream up past peak.
With dispersive discovery, if you drop the acceleration past peak, the daily production curve will drop faster, but due to conservation of volume you will see fatter tails in the out-years if you keep searching at a lower rate. It is all easily parameterizable.
Great post! Now if only I could do math.
Don't feel bad at all. Neither could the geologists and petroleum engineers over the last century and a half.
If anyone wants to dispute this last assertion, please give a reference from some academic petroleum journal that derives the Logistic from first principles.
I resemble that remark. I swore off calculus after I barely escaped with a "C" from my last math class, Partial Differential Equations and Boundary Value Problems, during the waning days of the Carter Administration--which is why Khebab is my best, good buddy.
But could we get back to real world examples? In the following paper, Khebab generated some HL based predictions for the future production from the top five net oil exporters:
http://graphoilogy.blogspot.com/2008/01/quantitative-assessment-of-futur...
Could you generate similar projections using your methodology and then show us how and why your projections differ from Khebab's HL based projections?
Alternatively, if your projections don't materially differ from the HL based projections, what is the objection to just using the simple HL method to predict future production?
Maybe we should blame the schools then. The only engineering class that I recall taking that had virtually no math content was a Limnology course from the Geology department. I didn't do very well in the class; the Geo professor actually set up a special appointment to discuss what he perceived as a learning disability I had in regards to writing. He apparently did not like the class report I handed in to meet the course requirements. I blame the typewriter.
Back on topic, HL wants to linearize but the data is not always linear. That second to last figure is real world data that seems to fit power-law discovery better than the DD exponential (i.e. what used to be called the Logistic model).
What we ought to do is fit a t=time factor into the formula to straighten out the curves even more.
Sorry to be persistent, but I would like to nail this down (especially since I will shortly be delivering a talk at Sandia Labs to a group of Khebab's peers). Khebab can provide you with his HL plots, but in the top five paper he presented a low case, middle case and high case for future cumulative production for each of these top five net oil exporters.
In your opinion, are the estimates too low, about right or too high?
In my opinion, the only data set that you should look at to get a bottom line is the cumulative world production. This aggregates the statistics from every region together and this gives a better bottom line.
From the post in the reference http://www.theoildrum.com/node/3287
"I fit the discovery plot by Laherrere to the dispersive discovery model with a cumulative limit of 2800 GB and a cubic-quadratic rate of 0.01 (i.e n=6 for the power-law). This gives the blue line in Figure 27 below."
Because it's better to have a projection based on a correct model?
Unless one is of the school "the end justifies the means".
As I have noted several times, Khebab chooses the parameters for the HL models. So, perhaps you would like to address your implied criticism that he is manipulating the data to achieve a predetermined goal to him. Of course, you could just crawl back under your rock.
The Hubbert Linearization is what I would call a good "first-order" model or even more appropriate, just a good first-order heuristic. However if we want to understand how exactly it deviates from linearity we need to understand the second order and higher effects. A good fundamental model does incorporate effects higher than first order.
I think Khebab is doing a good job of juggling heuristics that people are used to dealing with, while at the same exploring some more fundamental models. Like his loglets and the hybrid shock model, and deconvolving reserve growth. For the Export Land Model, I believe that HL is probably all that is required to make some useful assertions and predictions.
I gave a reasonable answer, there is no need to be rude.
I seem to recall others pointing out that the logistic curve applies best to easily refined oil. We can assume that supply creates its own demand. If the oil was of a type that was harder to use it would require time dependent 'learning' or coupled supply and demand.
Another tack I've pondered is what if the inferred bell curve was really a triangle sitting on a flat base. Because we want to see a bell curve we round the apex and draw out the base line as a horizontal asymptote. The integral of that triangle is two piecewise continuous curves joined into an S-curve at a 'kink'. The kink represents the transition from increasing to decreasing returns. With parameter guesstimates that could enable ultimate reserve prediction ie at the bottom right corner of the triangle.
Smooth transitions occur due to stochastic effects of dispersed rates and volumes. Yes, as you look at narrower geographic locations and constrained volumes, you will see discontinuities in the curves. As the best examples of this consider gold rush dynamics and the passenger pigeon extinction. They both show discontinuities like this:
This is "boom or bust" dynamics. The steep dropoff occurs as we deplete everything in a constrained small geographical volume. The boom town in the case of the gold rush and the mid-eastern part of the USA in terms of passenger pigeons. One day Deadwood was full of people and the next day it was a ghost town. Likewise, in the span of a few years, all the pigeons became extinct.
We get the smoothed curve corresponding to dispersed discovery only because we are dealing with hugely heterogeneous volumes that cover the whole earth with varying rates of search applied. So you can try to use the triangle to model the peak, but it only becomes a heuristic unless you apply the stochastic effects correctly.
Sorry to get on late but I have to avoid this activity during my regular work.
Thanks to Nate for the invite, and I look forward to the Maximum Power Principle model. I have a feeling that we might be entering into perhaps two schools of depletion modeling. One that is based on more deterministic trajectories (MPP perhaps?) and the other based on probabilistic or stochastic ideas (Dispersive Discovery with the Oil Shock or Hybrid Oil Shock model).
And of course we won't find anything worthwhile outside of TOD circles :)
WHT,
I think your model is about as close as anyone has come to conforming oil supply to a reasonably predictive equation. This would be representative if all actors were robots, and used stochastic processes to extract the oil over time. The other piece of the puzzle of course, is that we are not robots. Oil extraction is by no means deterministic, but at least a moderate amount of animal behavior is. How much and to what extent it can be overridden are important questions. My main point in the upcoming post is that all life is somewhat a manifestation of the 2nd law of thermodynamics. Organisms and ecosystems that degrade more of their energy gradient have had selective advantages. If we acknowledge (and we should) that human neuro-wetware can be hijacked by modern stimuli via our mesolimbic reward pathways, it is not that far of a stretch to suggest that modern stimuli can hijack our neural pathways in other manners, e.g. we don't maximize 'power' but our minds perceive money and social influence as our ancestors did 'energy' (i.e. food). The conclusions will be along the line of we will, at each interval, maximize the flow rate that results in more money (and social influence). Getting higher flow rates today at cost of sharper depletion profile in individual wells and regions. If this is workable, somehow perhaps brains smarter than ours can piece the supply and demand models together.
We need both pieces. Without knowing the geologic constraints, we can't effectively plan for best ends and means. Without knowing how human actors will respond, the geology itself won't be the limiting variable...More next week.
And thanks for your continuing erudite curiousity on modeling the logistic.
I only mean deterministic in the way that the birth-death models deal with a single population (not a spread or dispersion of populations). This puts that population dynamic on a deterministic trajectory, which may in fact be chaotic, but chaos is deterministic in these scenarios as well. See http://www.phy.duke.edu/~illing/research/chaos.html
Looking forward to the discussion.
Anything worthwhile here:
Bayesian Analysis of the Discovery Process Model Using Markov Chain Monte Carlo (Abstract)
Sensitivity of Predicted Oil Production to the Sigmoid Function (Abstract)
Stochastic frontier analysis of total factor productivity in the offshore oil and gas industry (Full PDF)
Forecasting Energy Supply and pollution from the Offshore Oi land Gas Industry (Full PDF)
Oil and Gas Depletion: Diffusion Models and Forecasting under Strategic Intervention (Full PDF)
Higher-order Hubbert Models for World Oil Production (Abstract)
The above deal with differing models, not just that of discovery.
My apologies for possible unintentional reference redundancy as I have no idea of how deep/far all you have searched already.
Not much there if they are trying to derive the Logistic. But thanks for the refs in any case.
Nate,
A while back you had an interview on global public media where you mentioned my favorite analogy to peak oil, which was picking blackberries. It went something like this.
Think of it like picking berry's out of a bush..
The bush contains 8 basketfull's of berries
You go up to the bush and naturally you pick the buries that are on the outside and densely packed, you get your first basket
You go up to the bush again but you have to reach a little higher and lower to get those dense pockets of berries..
you go up to the bush again for your 3rd basket only this time the berries are not as dense but they are still all over the outside..
for the fourth basket your having to really reach up higher and down really low, and your just picking single berries because most of the large groups are gone,
now, just about half of all the berries are gone, most the berries are deep on the inside, your have to exert more effort just to get the same amount of berries, you get your fifth basket
Your finally on your 8th basket, the last three were a real $%@#$, you even got cut up little reaching around..
Now the berries are all around, it's going to take forever to pick all over that huge bush for just single groups of berries, there is a basket full of berries left but it's so widely distributed you don't bother, you pick about a fourth of a basket, get tired and give up...
You do this 10,000 times and record the amount of berries you pick out of different bush's over the time it takes...
You end up graphing a _____________________________.. <---- see what I am saying...
the extraction of most resources including oil follows a curve depending on the distribution of the resource.
http://www.theoildrum.com/files/fig2_bardi_pagani_Pb.jpg
http://www.theoildrum.com/files/Fig3_bardi_pagani_Zr.jpg
http://europe.theoildrum.com/node/3086 ] the whole article
I think maybe the shape of these curves has something to do with the type of distribution of large and small oil fields falling along a bell curve, where super large oil fields are at one end and super small fields are at the other with the majority lying in medium size fields...
Those are my two cents and that's probably all their worth, I don't understand statistics very well yet... good luck
The shape of the curve has nothing to do with the distribution of sizes of fields, that only contributes to the noise on the discovery envelope. The fluctuations will eventually smooth out when you have a big enough sampling size.
and with more samples
http://www.theoildrum.com/node/3287
What affects how steep the curve is how tall or flat is, for instance in graphs above selenium or some other metal may have a much flatter production profile than rubidium ect? Thanks hubble I'd really like to understand this stuff but I don't have the background yet..
Oil has got the interesting property that people will use a substantial fraction of whatever they can get their hands on. This is anywhere from 2% to 20% of what they think they have available, year-in and year-out. Petroleum is so cheap and people have historically used it like water. The issue with various heavy metals is that we don't necessarily use a significant fraction of what we find. It costs a lot to process and the market may not be there. Therefore the production may look flat for many years. Or production may rise if the demand is there.
SwordsOfDamocles
The shape of the curves your describing with the black berry model does not have a lot to do with how the original resource was distributed nor what I would call the total URR.
WHT is certainly correct in hi concepts about discovery. What your describing and I think your 100% correct is how we exploit discovery. Since we go after the easy berries first the reason why we did a exhaustive search for oil early while we had large amounts of oil left to pump is because we wanted to make sure we got the easiest oil.
Using your berry example the discovery model would be driven by doing a exhaustive survey of the remaining berries after each bucket was picked. You could say that even though the first berries where easy to pick we wanted to make sure that there was no blackberry bush around which would allow you to simply put your bucket underneath and the berries would just fall in.
Failing that as it got a bit harder your satisfied with finding more bushes similar to your first bush.
In any case you can see a strong pressure for search even with abundant resources already known. The discovery model itself that WHT is discussing is probably correct and looks good given that the searcher or "demand" side can be considered strong with a simple thought model.
Now taking your model what your really saying is that we alter the distribution of berries overtime taking the best first. I'm basically saying the same thing that the original distribution and even the discovery profile is not important since we discovered all the berries well before we had picked even half of them.
The key is the the exploitation of the resource has had a significant impact on the distribution and is a lot more important than the discovery model.
In the case of blackberries and oil the question of if the glass is half full or half empty is pretty obvious. No way are we going to drink that second half of the glass as easily as the first half. In fact its not clear that we will ever actually drink a lot more.
So whats being missed in my opinion is that previous extraction or berry picking has depleted the resource to such a level that its the biggest factor or problem we face in the future. This is exactly what your saying with the berry analogy.
But recognize that models like the dispersive are only talking about the original distribution and don't include the effects of depletion of the resource that in fact take place during the search in the equation. This depletion during search is whats driving the search in the first place.
To see that its a driven search what you need to do is look at the known reserves vs production and discovery for each discovery year.
This is not exactly right because declining increases in production in the US ( easy blackberries ) had a lot bigger influence on the global search pattern than decline in other regions say Russia.
The discovery model is probably just as important as the extraction model. Case in point, no more gold rush towns any longer. Is this an effect of discovery or of production?
Discovery and extraction are equally important and are connected by the Oil Shock model via the simple concept of convolution.
I mentioned the great mathematician William Feller in an earlier comment. Here is a quote I pulled from one of his books:
“It is difficult to exaggerate the importance of convolutions in many branches of mathematics.”
William Feller in
An Introduction to Probability Theory and Its Applications.
Great article. Would it be possible to have it in the form of a downloadable PDF?
Yes, I originally submitted it as a PDF. Nate might still have it. It is also on Google Docs
http://docs.google.com/Doc?docid=dctrrzxh_23ck33ddf6&hl=en
A couple of comments on this. Resource utilization is a supply and demand equation.
The discovery extraction and utilization of any natural resource is dependent demand. Any equations that model resource utilization implicitly include some assumptions about the demand side of the equation. In this sense they are not fundamental but economic models.
Next as far as discovery in production goes if you take any given year and can back track the production to that year to the date of discovery it seems that the contribution is driven more by the size of the discovery.
For example Ghawar could have been discovered within a wide range of years but once it is discovered and developed it makes a outsize contribution to the worlds oil supply for decades. This is reflected in the fact that on a yearly basis the super giants contribute a large part of the worlds daily production. Many smaller fields have been produced and declined and produced far more oil than ghawar over the last decades but they have not made the steady contribution to our baseline production. Also of course production in any given year is driven by demand as long as supply is adequate as supplies become tight simply supply and demand assumption don't hold.
Given all this a fairly simple time shifting of discoveries into the future to model production does not seem to be valid. Outside of the obvious that a field cannot contribute to production until after its discovered and developed and further assumptions about how the discovery curve influences the production curve don't seem to have a firm physical basis. Instead the nature of the discoveries or details of each field has a larger influence on the future production. This is even more important for reserve additions in mature providences vs truly new discoveries. They are apples and oranges.
In my opinion the information content of some total discovery number is quite low its not as valuable of a number as it looks like on the surface. The blatant example is of course the tar sands its obvious that equating tar sand reserves to be equivalent to say the best light sweet field is wrong. But its also obvious that at every stage that summing discovery and reserve data is incorrectly treating a barrel of oil from on field as equivalent to one from another. This mistake become more and more important as the resource supply becomes constrained. Again the peak light sweet problem and tar sands points out that this is flawed. The underlying problem is it completely ignores EROI issues which become large as resources become constrained. So it works when discoveries occur well in excess of our ability to exploit them but fails when discoveries are well in the past and the way we have exploited the resources based on economic factors . So it fails to work exactly where it becomes interesting to use discovery data to predict production because decades of exploitation of the resource have fundamentally altered the extraction profile. (All the easy oil is gone)
This fallacy is coming out now in the sense that we are seeing peak light sweet crude vs the heavy sour the differences are big enough to have a profound effect on the market and demand side of the equation which was implicitly included in these fundamental models without definition.
However we do know that the demand is coming from biological organisms called humans which exhibit births and deaths and are dependent on a variety of natural resources that have interlocking demand patterns. For example demand for iron/steel is closely related to demand for oil via the usage of oil in powering automobiles. Overall demand is dependent on the population*wealth or consumer purchasing power. As long as all the resources needed to support this consumer are not critically short in supply then the demand equation closely follows the population with a sort of industrial growth factor. It takes time to build the cars, houses, clothes etc to meet the demand from each new human and absorb the leftover assets of those that die.
So given all this any sort of fundamental model of resource discovery usage and depletion should include a explicit model of the demand side implicit models that focus on exploitation of a particular resource are not fundamental.
Interesting that the Logistic model has now been shown as a specific case of the Dispersive Discovery model. In other words, Dispersive Discovery is a generalization of a set of parameters that went into the Logistic model. The Logistic model for oil no longer has any basis in the Verhulst equations and so we have essentially turned conventional wisdom on its head with this TOD post.
I think that this is an important breakthrough. I was always unhappy with the logistic applied to oil production as it lacked physical explanation. We can now also explain why some resources show logistic curves, while others do not.
It would be interesting to review population models with regard to this new understanding. Any species that actively seeks food might lend itself to a dispersive model.
Right, I think the places where it doesn't apply are very instructive. In particular if you look at an extinction event like the Passenger Pigeon wipe-out of the late 1800's, we saw virtually no dispersion in the culling of the population. The pigeons themselves were so geographically congregated and the hunters were so relentless in using better and better killing technologies that the peak built up rapidly and then busted, almost in unison. It took just a few years to make them extinct. If hunters skills were dispersed or if the pigeons were distributed over a much larger region, we likely we would have seen the decimation of the population occur over a much longer time*. Perhaps more like the whales in the oceans, which are sufficiently dispersed and our whaling technologies variable enough that they have maintained their population over the years. Of course, oil does not have the capacity to reproduce so the analogy only goes so far.
*(they still would have died out but it would have likely looked more like a Hubbert peak smearing)
thanks
Calling Isaac Asimov! (dean of popular science writing)
This is important stuff, but it needs to translated into terms that are understandable to the general reader.
Often the original researchers are not good at translating their thoughts. They are so at home with the math and concepts, that they lose the ability to communicate with us mortals who had a hard time with first semester Calculus.
It would indeed be a gift to humanity to write a book that explains the math behind Hubbert and depletion analysis.
The general reader needs metaphors (like blackberry picking), background in basic concepts (e.g., Gaussian curve), and general conclusions about the meaning and significance of the work.
There are some dynamite science writers around. I hope one of them will accept the challenge.
I don't like the blackberry analogy because it doesn't create a strong enough premise. I sneaked in a few references to my previous TOD blog postings at the end. There I have a title called "Finding Needles in the Haystack". That is a post that starts with an analogy that I find much more applicable. Instead of picking blackberries we are looking for needles in a haystack. It includes some figures that you may find enlightening.
The blackberry argument is mixing in the picking of the berries with the finding of the berries which is probably correct but confuses the issue. Its better to keep them split.
The key difference of opinion is that you can shift the discovery profile forward in time as a model for future production. The discovery model may and probably is perfectly valid the issue is how it effects future production.
Discovery certainly has a basic effect in the sense you can't exploit a field until after you have discovered it but given that known reserves where much larger than production well past peak discovery its not clear that this has a large effect past the initial development phase.
I'd say discovery and production where tightly coupled in the 1930 becoming less coupled through the 1960's with discoveries after this having less and less of a impact on production from this point forward. Indeed by the 1960's we had discovered most of the large oil fields and oil producing regions and produced them for some time. New discoveries after the 1960's added smaller and smaller increments to existing production levels. Paradoxically most of the large discoveries made since the 1960's Alaska,North Sea, Cantrell etc are now in steep decline while the large Middle Eastern fields discovered in the 1940's and 1950's are making a large contribution.
For me at least the concept of shifting discovery forward in time as a model for future production does not pass even a basic review of the concept.
The Blackberry bush analogy does not work for me because you start with the premise that a blackberry bush is in front of you. Better is to search a huge haystack with needles distributed randomly throughout the volume. You set a bunch of people working on it such that the dispersal of volume searched by the group of people has a mean and a standard deviation equal to the mean at any given time. You end up with the Dispersive Discovery model in the case of a fixed size haystack and a Double Dispersive model if you had multiple haystacks with a damped exponential size distribution (mean equal to the standard deviation).
The Blackberry analogy is more deterministic and the Haystack analogy is more stochastic. People understand determinism but they don't understand the concept of randomness very well.
Again the blackberry model is not about finding resources its about exploiting known resources after they are found. I.e they are correctly right in front of you.
The dispersive search was made and completed well before we had fully exploited previsouly discovered fields. We did not find enough fields to meet demand then wait till these fields where well depleted before finding more fields.
In fact the kings and queens if you will that have made a large contribution to our overall production where found early on and the search volume was fairly well searched early. We certainly had large later finds but these where made in general in areas that where searched later because of technical issues.
Original discoveries peaked between 1960-1980 it looks like oil production has peaked at say 2005-2010. Thats a 45 year difference the entire oil age covers about 100 years. Putting the start date at 1920 we had discovered far more oil than we could produce in the first 40 years of the oil age.
Putting the end of major discoveries at around 1990 its taken 15 years of not a lot of discovery before we reached peak and we have been burning more oil than we discovered for decades.
Using the black berry bush analogy we have had plenty of known fields to exploit for a long time the exploitation pattern has been decouple from discovery if you map production to discovery date since at least the 1980's probably more decoupled since the 1960's.
What you have not shown is a relation ship between the discovery date of oil and its contribution to production. The king of all Ghawar as made a significant contribution year in and year out since the 1950's.
The reason people make the mistake that we discovered them early and develop a incorrect discovery model is simply because the dispersive discovery was performed well in advance of the actual production needs.
Nothing is wrong with the dispersive discovery model its simply that we performed the search early enough that actual production is better modeled as a selection amongst known fields ala picking the best bushes first not developing a field the moment its discovered.
http://en.wikipedia.org/wiki/North_Sea_oil
The mistake is not in the dispersive discovery model and your 100% correct in that the kings and queens where not found first but in assuming without any proof that discovery can be time shifted to predict production.
This assumption is obviously wrong to me at least with a simple spot check of the historical production data vs discovery date of a field.
Your the one making the claim show the correlation.
Its not that your dispersive discovery model is wrong its correct and it does tell us that we probably have discovered most of the worlds oil about how much we have is thus know and we also know from historical production that we have probably developed all the best fields. Other than that its of no further use.
Certainly its irrelevant for predicting future production from now forward.
Again I repeat your discovery model is 100% correct results of the model are useful.
1.) Discovery is probably complete.
2.) A good URR estimate is then known.
Thats it you cannot time shift it to predict future production unless you can show a high correlation between discoveries and contribution to the oil supply.
This implies some sort of serialization of production and search yet a simple look at the historical data shows they where performed in parallel in fact your time shifting is incorrectly exploiting the fact search was done early.
Your using the fact your wrong to make your predictions.
The fundamental concept that ties discovery to production, convolution, has a name that belies its elegance and simplicity. Most people probably think that the root of the term convolution has some relationship to that of a convoluted argument. In colloquial terms, this indeed has a bad connotation, and anyone that tries to press forward awhile admitting that their argument contains inordinate complexity or twisted logic immediately has two strikes against them. For better or worse, people will tune out when someone tries to explain things via what they think amounts to convoluted reasoning.

 simply signifies a mathematical convolution occurs to obtain a result.
Yet, in fact, convolution in mathematical terms does not imply complexity, but instead forms the foundation of vast areas of engineering and scientific understanding. Via convolution, we can explain everything from how signal processing works to how to solve mechanical dynamics problems. In general, a signal or stimulus forms the front end of the convolution, and the response function forms the back end. So we need to understand the two ends (back and front) individually before we can really convey the result. And the result only works if we understand convolution. So when you see this strange syntax:
don’t get too apprehensive. The operator
Is that a convoluted-enough argument to get you started?
No problem never said it was not involved just that its obviously a minor term in the production equation from a cursory review of production history. At any point in time we had plenty of discoveries known to choose from for the next oil fields to develop and further in general expansion of production in existing developed basis was providing more oil than the market could bear.
Have you ever hear of the Texas Railroad Commission ?
Web your wrong. Or more importantly if you want to time shift discovery and claim its a physical model given what we know about the data set you have to show at least a correlation between discovery times and yearly production data. This of course means that today the bulk of our oil would be produced from fields discovered since say the 1980's. In fact almost all the large regions and basins brought online since the 1980's are in steep decline and the much older fields are making a large contribution.
Simple time shifting of the discovery model has no physical basis I don't care how you make the convolution its not relevant the model is just as unphysical as HL. You can take any Guassian distribution for URR and do what ever you wish with it and call it a physical model. This does not make it some sort of fundamental physical model any more than HL. Time shifted discovery may work for certain resources in particular it may be correct for how people migrate into new lands in general they exploit them shortly after discovery your implicitly making this assumption I'm not sure your realize it. I'd assume that migration in general follows your model but extraction of oil is not a migration problem. It does however explain how you have fallen into this logical error.
And the second major flaw is this is a supply and demand problem so the total model must include the demand side of the equation not just supply your physical model is completely ignoring half of the problem. You have shocks but you don't have a good model for unshocked demand. Given that the demand is at its highest level constrained by biology I'll leave to you to figure out how production from a ample resource behaves overtime.
I 100% agree that for Global Peak that the simple logistic is probably not a good
predictor of future production and that adding in shocks is a good thing but also in general we have to assume the "real" equation is complex and has chaotic states any model that does not introduce chaos under certain conditions is probably not a good model. Demand has to break down i.e civilization collapse in a real physical model. Any purported physical model can readily be rejected if it cannot reproduce this solution. Demand collapse at certain price points as government fails has to be possible in a physical supply/demand model with a constrained critical resource.
Certainly the chaotic solution may be unreachable from known physical parameters for the equation but given the history of civilizations and how they behave under resource constraints I doubt it.
"Time shifting" is not some science fiction principle. It happens when either something drains proportionately out of a system or some other latency occurs. If you don't believe that construction delays can occur after a region gets discovered and that this delay is variable than you will never be convinced that a convolution will work to model this effect.
You have not proved its the correct model. I even offered a case where it might be correct i.e migration of a species into new areas and in this case it works because the species has to enter the new area before it can discover more new regions to populate. So a example of where production if you will is constrained by discovery has them happening time shifted.
Production has not been constrained by discovery for most of the oil age.
I don't understand why you keep claiming I don't understand your model I do.
That has little to do with it being correct.
Your the one claiming you have physical model prove that production of oil was constrained by the discovery rate so that time shifting of discovery has some physical basis.
This is not a stupid request if you can't prove this you don't have a physical model.
What is this issue you have with "time shifting"? OK, here is a perfectly good example of time shifting. Take the case of the Alaska National Wildlife Refuge oil reserves. This was discovered a few decades ago and we have a rough idea of how much oil we have there in reserve. Yet production has not yet started. And construction has not even yet started. It is what I refer to as being in the Fallow phase of oil extraction. If and when production does start, this will generate a time shift from where discovery occurred and when extraction starts.
The Oil Shock Model is all about providing a distribution of these latencies from a Discovery curve. Each one of these distributions for Fallow, Construction, etc phases follows a damped exponential distribution. The damped exponential has a mean, a variance equal to the square of the mean, and a mode (most common value) of 0 years. This takes into account a common occurrence of a newly discovered field being immediately set into play, many with an average time, and the occasional (ANWR-like) field which takes quite a while.
The problem may be, and many have this mental block, is the ability to think non-deterministically. They do not comprehend how ensembles of events can be modeled in probabilistic terms. Somehow they think that by adding randomness, that we have converted from a physical model to something that becomes abstract and inapplicable. If that was so, we would have to conduct a census by looking up every single person in the country and count them individually. Also, the insurance industry would not exist. And so on. Can't help people with this mental block.
I'm pretty good at stat thermo so ensembles are not a problem for me.
Underlying the ability to create a ensemble is generally some expectation that the system obeys some sort of statistical equation ( thats why its called stat thermo )
In almost all cases this is related to the central limit theorem and under that to some assumptions that the pieces are acting independently or discreetly.
On the other hand tightly coupled complex systems do not behave this way and in fact exhibit complex behavior and chaotic regimes.
As a quick example consider the flow of cars down the freeways of Southern California the system is uncoupled until you have a major wreck then it gets tightly coupled. In the case of say a collision in fog you get a large pileup of cars which formerly where not tightly coupled.
Back to oil the problem is you have not proven you can create this ensemble.
This means that field development is coupled to discovery time shifted. I don't care if its done with one parameter or ten at the end of the day the assumption is that the field discovery time is all thats needed to determine future production the rest of the parameters are just fitting numbers. They may have a physical basis and if you can show a statistical distribution of the rest of the parameters fine. You would need to do this but its even more than what I asked and it muddles the picture.
Now we know your wrong simply because oil extraction has gotten a lot harder over time despite the fact that your search/discovery model implies that the field distribution today should be like the field distribution of 50 years ago.
So the costs of extraction and the quality of the oil should not change much over time. EOR of course would be applied to older fields but other than this everything should be about the same.
The most blaring failure is the distribution of production coming from onshore fields vs offshore fields.
What this means is that your not correct and that what really happened is we searched exhaustively but we where looking for the best fields first these where cherry picked the harder to develop fields where left for later.
So its obvious that cherry picking occurred amongst the set of fields discovered in any given year and the ones that where most profitable where developed first.
The onshore/offshore cherry picking is the biggest example but all across the board from feet drilled to exploiting of tight reserves etc we cherry picked the best areas first saving the worst for when economic/technical conditions improved before we tackled them.
Also another form of cherry picking is reworking older fields vs developing new ones reserve additions are coming from this and this becomes a bigger influence over time as more fields are known and put into production.
Again Web I understand perfectly what your doing but you have not proven that your mathematical assumptions are valid. Furthermore the total number of fields in the data set is small a few thousand at most doing these sorts of statistical approaches on data sets this small is problematic in and of itself.
You have skipped the important pieces and in doing so come to the wrong conclusion in my opinion. At the very least proof that you have the right model i s lacking. At the minimum you need to show that several of your variables do obey the statistical distribution assumptions that underly your model.
Given that production levels esp production over the next 10 years or so its important to get it right.
Here is what the historical data from oil production says to me.
1.) We have done a fairly exhaustive search for oil and have probably found most of the oil.
2.) This search was completed before most of the fields where developed i.e at any point in time a number of newly discovered fields and regions where known.
3.) The total number of fields is small with production from a even smaller set of giant fields important. So the number of finds may or may not be large enough to treat statistically. The obvious example is Saudi Arabia with the giant Ghawar field as a outliers. And the set is further fragmented between onshore/offshore and between political and geographical regions. Each has a quite different political/economic function determining when the field is produced. Any attempts to create a ensemble need to determine if these known partitions are enough to break the statistical assumptions your making.
4.) We did not save the best for last but are now scraping the bottom of the barrel thus back to 1 and 2 we where able to cherry pick the results of our search pattern. This means of course that production estimates derived from the results of the search basically any bottom up model will be inflated.
Its not just your model thats wrong but all the bottom up ones I know of don't include this. And finally I'm not saying that you can't make general assumptions but you have to be very careful just the small size of the data set alone is problematic.
"At the minimum you need to show that several of your variables do obey the statistical distribution assumptions that underly your model."
I have said time and time again that I use the maximum entropy estimator, which is the most conservative one imaginable, also known to be an unbiased estimator. I assume a mean for every parameter and then set the variance to the square of the mean. The parameter is unbounded but it does disallow values that are negative; the distribution ends up looking like a damped exponential. For everyone that doesn't understand this approximation, it's what you do if you have no idea what the underlying distribution is and you defer to nature's proclivity to randomize events over time. In other words, I am adding as little bias as I can to my assumptions. The Poisson process is a manifestation of this kind of distribution. So if you are going to shoot me for invoking the equivalent of the Poisson process, go ahead, as millions of science and engineering students who have been taught this very conservative assumption will be waiting in line for the next bullet.
This other stuff about "the number of finds may or may not be large enough to treat statistically" is misdirection. Agreed I would like to take as big a sample as possible, but there is a reason that the Poisson distribution is also known as The Law of Small Numbers. You run this model as if you had millions of events and it gives you a probability envelope. The fact that fluctuations occur in the sizes and number of finds is irrelevant to the discussion. There was a reason that I called the original TOD post on Dispersive Discovery "Finding Needles in a Haystack". Fluctuations do occur in finding needles, but this model gives the expected envelope given mean values for the parameters. The cumulative number of needles found so far, has given us a good calibration of the means needed to do the fit.
Groan. Why do you think that the search is dispersive in the first place ?
Maybe its because your wrong about what the searchers where looking for ?
They where not looking for oil its obvious that they where finding oil more then they could pump twenty years after the first discoveries.
They where looking for the Ghawars and kept looking till they had searched the entire search space.
Read this.
http://www.depotmuseum.com/oilBoom.html
Just a simply look at the historical recodes suggests that the wildcatters where looking for a lot more than oil. They where looking for the kings. Finding smaller fields was a distraction but it help pay for the searches for the big one. The search was certainly a directed search driven to find the largest fields . Heck there are still people looking for the big one in gold and silver in California and Nevada.
http://www.csmonitor.com/2008/0408/p20s01-ussc.html
What they found was what was there so on the search side your not actually describing the search but search results i.e discovery.
Its interesting but not surprising that the search for the big ones resulted in a fairly exhaustive search of the entire search space. The point is the real needles in the haystack where the monster fields not oil.
And its not logical misdirection to question the sample size. Its in questioning the sample size that I realized what the needles where not oil but mega fields.
Next as far as the Poisson distribution or any distribution your still making assumptions that oil production was independent.
How many times to I have to say that its not clear that the oil extraction discovery and extraction process was not biased ?
My point is we have good reason to believe it was biased. The real search criteria was biased to finding the largest fields. It happened to find most of the fields. Next the search and production was biased to the easier to produce fields on land first then the ones offshore later this bias is obvious in the historical records. I could go on.
The point is assuming random is itself a biased approach and in fact is probably wrong given any reading of the historical record.
Don't get me wrong I think its fascinating that attempts to find the largest fields devolved into results equal to a effectively random search. But you got the right answer for all the wrong reasons. How many other mistakes lurk under your bias for assuming its random. And do they result in incorrect results ?
Again this flies in the face of the facts. Khebab produced this chart in comments of the Finding Needles post : http://www.theoildrum.com/node/3287
The data clearly shows that big fields are not necessarily found first. If the sweet spot is between 7,000 to 15,000 feet, why on earth would it be anything other than random? The cross-section is so small that you will find what you will find. Small ones mixed in with big ones.
The rest of the Oil Shock Model is based on statistically independent events, which is also an unbiased approximation. People can argue that, but if I started to add statistical dependence somebody would rightly criticize that.
My god man I did not say they found them first I just said thats what the searchers where looking for.
The goal of the oil exploration period was to find and put into production the mega-oilfields of the world. The succeeded in this and also found a lot of other fields.
The needles if you will are really the large fields the haystack is all the small fields you find as you search for the large fields.
It is a needle and haystack problem but its not about finding oil its about finding the biggest fields.
It would be very interesting to see the way the mega-fields where produced vs all the small fields found during the search for the large fields.
I'm pretty sure you will find they where brought online quickly and made a large contribution to overall oil production earlier that smaller fields found at the same time period.
This obviously happened for the East Texas oil field. And in general seems to be the case for the large Middle Eastern finds after WWII.
Smaller fields and eventually offshore fields where under more economic constraints.
I hate quoting CERA but as long as the mathematics is valid it does not matter if the model or conclusion is wrong.
http://www.cera.com/aspx/cda/public1/news/pressReleases/pressReleaseDeta...
Although not exactly what I'm saying it stands to reason that this extensive search for needles ( Large Fields ) did find what it was looking for most of the worlds oil production.
The real physical distribution of smaller fields also found certainly contributes but its almost noise around the search and results for the larger fields.
In any case for the most part this search and discovery is well in the past. The big fields where eventually found within a fairly short time period disrupted by WWII and put into production that has contributed to the worlds oil supply for decades.
Now the smaller fields are a lot more interesting for me at least.
This is probably where the greatest cherry picking has occured and they make a substantial contribution to the worlds total production in aggregate. The rise and fall of the super giants will control the overall peak date but the actual production is sensitive to how we produced the smaller fields and if cherry picking or some sort of selection bias over the decades has resulted in making it difficult to maintain production from the fields.
Every article I've read covering production from the smaller fields does not paint a pretty picture for future production. Even CERA is not exactly rosy about them.
Given the fact that now most if not all of the super-giants are in decline and that yes WHT discovery is in the past this decline in smaller fields with no new discoveries can and probably will result in a initial steep decline rate from our production level bottoming out again at what ever rate the super giants are decline at over the next decade or so.
What I do is split the production into two groups 50% declining at I suspect 10%+ and 50% declining at 8% I'm more pessimisitc than CERA about the giants.
Next you have to account for the short life span of the smaller fields. Given we are no longer replacing them with a search pattern and they age quickly.
We can expect significant declines in the small field production levels 5-10 years after search no longer found them in significant numbers.
For all intents and purposes the net effect is basically a crash in overall production rate basically any day now.
Incorrect hypothesis and conclusions in both your work and CERA's does not detract from the data. In your case regardless of the reasons for the search the results are the same. But its important from the production perspective to understand the real reason.
On the CERA side they don't know I assume about your work so they are not factoring in the completion of the search and its effect on overall production as small fields decline without replacement going forward.
The shock model itself at least as your currently formulating it does not add much over the HL approach since both seem to be missing this situation because of aggregation or averaging hiding the real situation.
Agree or disagree at least recognize that there is reason to be concerned about the exact details of production over the next decade and that the biggest economic effects from peak oil will occur during the first period of decline and our ability to deal with it depends on the details of the decline rate.
Its critical in my opinion to determine if this possibility of a steep decline is valid if true it has a profound effect on our entire societies future.
If aggregation is hiding this then its wrong and the result of the mistake could well be dire. I would not argue with you over these details if they where not important but in my opinion for the next decade at least its the details that matter.
Thanks, this is great data and supports the model very well.
large small
6 ~ 3
7 ~ 5
20 ~ 14
So now I have some additional great data to use for the model parameters. I will compare this to data parameters I have used in the past and write it up.
I really don't know anything about you other than you claim to be a scientist who has worked on chaotic systems and chemistry. But with this statement I clipped above, I fear that you don't have a good handle on basic approximations. I really don't see significant difference between a decline of 8% and a decline of 10%. I would say 9% and anyone splitting hairs over +/- 1% is plain naive on how analysis works.
I will give you a chance to retract the statement or explain it, but I find it hard to argue with someone who claims to have all sorts of intuition on these topics, but keeps on betraying that spectacular insight with such obvious gaffes.
I apologize about the last comment. I looked up Memmel's info page on TOD and this is what its says:
I have severe dyslexia. Feel free to either send a private email or post when my writing is to garbled.
I'm sorry Memmel that you have dyslexia. I will shut up from now on.
No problem.
I said 10%+ a range is 10%-40% for the small fields I felt that getting into the plus part was not worthwhile at this point. Just getting you to think about the issue has been a battle :)
There is a difference.
100 100kb fields each declining at 10%+ generally a accellerating decline rate is 10kb * 100 or 1000kb
but this is fundamentally different from a large field declining.
In the case of the large field you have say 1mbd declining to
800kbd per day its still worthwhile to produce.
In the case of the smaller fields esp offshore you stop producing them much earlier since it uneconomic once the water cut passes a certain level.
This has been covered but excluding small fields in general which is a shame.
http://www.theoildrum.com/node/3236
and here
http://www.321energy.com/editorials/oildrum/oildrum112007B.html
But my point is that they do contribute a significant share in aggregate 50%
I don't agree with CERA's estimate.
Since fields with 300 million barrels or less are highly depleted and the smaller fields have a shorter lifetime I think the number at risk of a steep decline is higher I put it at 25% of production.
Even with there estimate 14% of the fields are small will deplete quickly and are
no longer replaceable.
This rapid decline of the 14% say over a period of a few years coupled with the overall decline leads to a real possibility of a drop of 10-15mbpd over a span of of 1-3 years.
Whats driving this is that the search phase is now far enough in the past that without replacement we loose a significant amount of capacity as the small fields decline rapidly.
I'm actually surprised we have lasted this long the only reason is we had built up a bit of spare capacity that allowed the last surge coupled with rising prices making it profitable to rework fields and produce a few more marginal fields.
But this is all pretty short term given the info from the CERA article I've quoted and others.
Syria is a good model for a group of relatively small fields with charecteristics similar to many in the world. It makes a pretty decent model group.
http://www.nationsencyclopedia.com/economies/Asia-and-the-Pacific/Syria....
https://www.cia.gov/library/publications/the-world-factbook/print/sy.html
They went from a peak production in 1996 of 604,000 to 380,000 in 2007.
Or a 40% decline over 11 years or about 4% a year.
They went from 520,000 in 2000 to 380,000 in 2007 however so you have to be careful how you do the numbers 30% of the decline was in 7 years or 4.3% per year
And the decline from 1996 to 2000 or over the first four years was 14% or 3.5% per year so you can see the acceleration in the decline rate.
Syria is not a fantastic example but its one I found quickly.
A more detailed look and another data point 2003 production is here.
http://www.mbendi.co.za/indy/oilg/ogus/as/sy/p0005.htm
As with most areas a few larger fields account for most of the production and fro m my reading at least on the area the declines to date are concentrated in the smaller fields as I've been saying.
The pattern that you see is that smaller fields are actually the largest contributor to the initial decline rate once a producing region is past its discovery phase which is my point.
Syria's big field is called Jebisseh and is large enough to remove from the small field group. In general I use 50kbd as a reasonable cut off for small fields but include both depleted former large fields and originally small fields in the group since the exhibit similar higher decline rates.
In any case if you take the decline of the small fields into account and sum them across regions you should get the same result as me that they initially account for at least 50% of the decline as a region passes into the mature post discovery state.
Columbia and Argentina are also other what I consider good small field regions.
http://www.eia.doe.gov/emeu/cabs/Colombia/Oil.html
In fact it has a production forecast.
And of course parts of US production. But looking at Columbia's production profile should convince you that aggregate small field decline post discovery
is a big issue and in my opinion well represent most of what may be a large drop
in production over the coming 5 years.
aye, well I'm not sure how you think of picking berries, But The berry analogy in my mind takes an entire berry farm as the earth , with richer berry bushes to be regions, and on the bush the larger concentrations of berries to be larger fields or richer areas. I don't know about you, but you cannot intuitively or visually see all the areas richest in berry concentration, so you just go at it, gathering the richest berries in your immediate area. Your eyes sweeping across one side of the bush is like the exploratory drilling in an area known to contain oil and gas such as a sedimentary basin. We are not searching for berries in peach trees because peach trees are not sedimentary basins and we know where all the sedimentary basins are on earth (I think that is an important point, memmel?). I think you were seeing the berries as a small single bush representing the earth where all the information is known, however if you improve on the scale of the analogy you can see the stochastic properties emerge, just as you can with gases when you increase the volume.
Who the hell wants to search for needles in a haystack, I would rather search for berries, they are much tastier than needles, or so they say :P
Crews
I like the way you think. You borrow an idea from an analogous physical situation but you phrase it in concrete terms from the discovery perspective.
Thanks :D
History indicates that we surveyed the berry farm fairly well before we began to pick. Not completely mind you since we did have two world wars at the beginning of the oil age. The survey history from the 1930's-1950 is mixed in with the second world wars and cold war but we seem to have identified most of the potential basins even at this point.
I'm not saying oil producers always had the best bushes at hand as choices but search was done well in advance of production allowing them to choose the most profitable fields to produce next from a known set.
Obviously at any point in time only the profitable fields where developed and profitable did not necessarily mean the best. Outside of the early development of the oil industry in the 1920's search did not influence production in the sense that search had already discovered plenty of potential fields for development well ahead of our ability to develop and consume the oil.
Given this it seems that oil fields where pretty big needles in fact they where readily found with primitive drilling technology and only basic geology concepts.
Once we had a rudimentary understanding of where to look for oil we found far more than we needed. One of the big reasons that peak oil is dismissed is that every time we looked a bit more or a bit harder or better we found oil.
I guess if anything whats missing from the dispersion model is this concept of successful searching we can see from the discovery graph that as we searched for oil we consistently found it in excess of our needs.
So its missing the fact that this search was performed not to find oil but to find the best oil bearing regions and fields to bring online in the next round of production. Of course since oil was owned by different entities the best choices for one entity where different from the best choices for others. We did not always pick the best solution globally but the best global solutions limited the profitability or the choices available for everyone. Its very much a economic problem.
This failure simply comes from the fact that its not a complete supply/demand model. Search is relevant and plays a role in the overall problem but its not central its if you will in a supporting role. For me at least only the fact that search is well in the past and that the results of the search provide a good estimate for URR is all that matters. WHT analysis would have been important in the 1920-1930's but its 2008 now and they seems to have done quite well without the dispersive model.
"WHT analysis would have been important in the 1920-1930's but its 2008 now and they seems to have done quite well without the dispersive model."
A common theme among many observers. For example, Big Bang Theory seems to be a hot topic among scientific cosmologists and the Stephen Hawking fans. But some genius comes along and says "Why is the Big Bang important? That happened billions of years ago, and I can't buy gas for less than $4 a gallon today."
So it's all a matter of perspective.
Hi Web,
Thanks and
re: memmel's comment
"I'd assume that migration in general follows your model but extraction of oil is not a migration problem."
Did you answer this?
I would if I could figure out what he is trying to say.
Look at that first sentence. I can't read it. It looks like a run-on sentence that needs 4 more periods, or at least some other punctuation.
Rewriting it with the extra punctuation, is this what he is trying to say?
"Time shifted discovery may work for certain resources.
In particular, it may be correct for how people migrate into new lands.
In general, they exploit them shortly after discovery.
Your implicitly making this assumption.
I'm not sure your realize it.
I'd assume that migration in general follows your model but extraction of oil is not a migration problem. It does however explain how you have fallen into this logical error."
I never called it "time shifted" discovery. I call it dispersive discovery. The definition of dispersion is given by the modeled equations. It basically states that not all regions get searched at the same rate. When one place is 100% searched other places are still near 0% searched. This could have to do with migration but also due to the use of different prospecting technologies. We only have a mean to work with so the dispersion is basically there to give an unbiased estimator for this distribution of search rates.
Most people I talk to ask why there will be a decline after the peak, which I can never answer simply. Most peoples knowledge of resource utilisation is in non-dispersive cases, i.e. you use it until it runs out. The problem with metaphors is that you have to justify why there is a correspondence with oil production. The metaphors might help someone to understand if they want to, but the big challenge is getting people to want to understand PO. The most powerful argument is the fact we can't use more than we discover. Even then, people say what about the Arctic.
The bottom line is you won't be able to "prove" PO by a theory, to people unwilling to believe. The thing that will change their behaviour is the cost of gas.
Changing the belief system. It is a hard slog, see the DKos post from today:
http://www.dailykos.com/story/2008/6/27/135544/492/135/542945
They say that part of it is just in the way are brains are wired. It will be hard to get ingrained "memory dumps" removed from our brains. Even if some collection of facts is wrong, neurons retrieve that stuff first, obscuring the true facts.
I see this sort of article a lot, but it appears to be based on the assumption (always implied) that given a "properly working" brain, it should come to truthful conclusions. The implication is that false conclusions are due to an aberration, or imperfect operation of the brain.
I think this is entirely the wrong way round. Given that the brain is just a bunch of communicating neurons, how and why are we able to come up with truthful answers? I view logical, rational thought as a special mode, and a very recent one.
The brain obviously evolved in an environment where it was simply not known what is the "correct" answer. Evolution generates variants, the ones that survive are probably "correct". The brain's model of reality must match reality where it is important, e.g. in viewing falling off a cliff as dangerous. In other cases where it is not important to survival, the brain may include any nonsense in its model of reality (an analog to junk DNA).
In fact, if the brain limited itself to known ideas, we never learn new things. Since we started with nothing, the only way to improve is by change, and the creation of ideas, even if by random, provide the means of change. Of course, most of the ideas remain junk, but some will be useful.
It seems like a paradox, but the price we pay for having discovered relativity and quantum mechanics is having to put up with people who believe in crazy conspiracy theories. And like weeds and crime, crazy theories will never go away.
What I am worried about in arguing the dispersive model is that people will maybe understand but then will fall back to the usual "bell-shaped" pseudo-argument or the population dynamics arguments governed by the Verhulst equation -- largely because they are more deeply or subconsciously implanted views. Both of these views are wrong BTW IMO, but only those with "logical, rational thought as a special mode" as you put it will truly understand the new dispersive model.
From engineering and science education, I could never understand something unless I could derive it myself, or convince myself that I could derive it in the more difficult cases. This does wonders to supplanting the subconscious views I held -- as a mathematical belief system is orthogonal to one that is conveyed in English. I bet they reside in different parts of the cortex. So I always go to the mathematics.
Hi. Please bear with me for a possibly naive post, but I have some trouble with understanding the notations. Is it correct that P(x) denotes the probability density function of our best estimate of the total, finite depth, given that we have swept the depth x? If so, what does lambda denote? (P(x) depends on lambda).
I have of course also read "Finding Needles in a Haystack". There, something is wrong, or I just don't get it: \bar{L} differs between row 2 and 3.
Can anyone help me? Thanks in advance!
Ok, I think I understand now. Would this be a correct interpretation of your model above? (I define some new notations here, but I feel I have to in order to be unambiguous)
Let
L = total, finite volume where it is possible to find oil,
alpha = density of oil = (total volume of oil)/L,
S = total volume we have searched.
Define as the volume of discovered oil:
D(S,L) = alpha*S if S <= L, and D(S,L) = alpha*L if S > L.
Now, model S and L as exponentially distributed stochastic variables with means lambda and L_0 respectively. Thus D(S,L) is random too. Compute the mean (by evaluating integrals like in the derivation above) gives
E[D(S,L)] = alpha*/(1/lambda + 1/L_0).
Now, we may let lambda depend on time, for instance lambda = lambda(t) = k*t^N or lambda(t) = A*exp(B*t) as above.
With this in mind, perhaps one should try to use a more realistic distribution for the true depth L than the exponential distribution (it should clearly not have so much mass close to zero)? Any ideas?
You've nailed it!
I appreciate the way you framed it as an expected value. I do this calculation so often, that I tend to forget to qualify with the E() notation.
Yes, we have 3 candidate distributions. One is the Singly dispersive which is the rectangular L0, where you have a finite constant depth "box" with uniform distribution. The other is the damped exponential, which is the Double dispersed discovery. The third is a suggestion by Khebab upthread http://www.theoildrum.com/node/4171#comment-368853, where he thinks a sweet spot exists between 7,000 to 15,000 feet. This last one I don't think is much different than the uniform model. It would not be that hard to model but intuition and history says that enough oil is found near the surface, think Texas and Pennsylvania, that it may be harder to rationalize complicating the model.
So if we use the single and doubly dispersive model, it can give us some good bounds, with the third one probably being more sharply defined than the single.
I agree, it may not be worth it to complicate the model.
But one could try perhaps a log-normal with a mean around Khebab's sweet spot, just for fun --- then we would get a tail, but not so much mass around zero for the final depth.
Perhaps one should do the same for the dispersion of lambda (i.e. the distribution of S in my notation) --- we know for sure that we have searched deeper than 0. In order not to increase the number of parameters, one could fix Var(S) = E[S] and Var(L) = E[L]. (This is completely ad hoc of course, but analogous to the case of exponential distribution.) If I have time, I'll draw a few pictures.
Thanks for the opportunity to read your interesting work!
Yes, unless you choose the right parameters of the log-normal, you can get the situation where the variance is much larger than the square of the mean. This would make it much more bi-lobal than the exponential, i.e. a huge number of small depths and also lots of deep depths. Unfortunately using the log-normal also makes it hard to derive a closed form solution, or something that doesn't require you to quote an Erf(). You could get lucky and derive it analytically but I am not sure.
I think log-normal is typically reserved for statistical pool sizes, if you want to get the biggest benefit from using it. It has something to do with aggregation of clusters. If clusters get big enough they start to agglomerate so you end up moving toward two extremes. Lots of small ones, and many more than average big ones. It may work for depths too. The log-normal certainly has the nice property that it prevents negative values.
A Gamma distribution of N=2 would also work. This requires the integration of x^2*exp(-kx) for figuring the E[]. (Gamma of N=1 is the exponential. ) I could see this working as the convolution of two exponentials. The first exponential defines the depth distribution at which you start to hit oil, and the second exponential defines the width of the sweet spot. This also has the nice property of not going negative, and I bet it has a closed-form solution as well.
I will definitely scribble on this derivation today. (Unless you get there before I do)
I agree regarding the log-normal. There will be no closed form solution (not that I think this is a problem really, we can easily evaluate the integral numerically).
"I could see this working as the convolution of two exponentials. The first exponential defines the depth distribution at which you start to hit oil, and the second exponential defines the width of the sweet spot."
This is a nice idea for motivating another distribution. Here is what I get. (If we get the same, there is a good chance it's correct ;)
Let S ~ Gamma(2,s), L ~ Gamma(2,l) (and S,L independent as usal). Then S has density x/(2*s^2)exp(-x/s), for x >= 0.
First, integrating over the distribution of S, conditional on L:
E[D(S,L) | L = y] = alpha*( s - s*exp(-y/s) - (1/2)*y*exp(-y/s) ).
Second, integrate over the distribution of L:
E[D(S,L)] = E[ E[D(S,L)|L] ] = int_0^\infty E[D(S,L) | L = y] y/(2*l^2)exp(-y/l) dy =
alpha*( s - (s/l^2)/(1/l + 1/s)^2 - 3/(2*l^2)/(1/l + 1/s)^3 ).
Moreover, s and l are determined by lambda and Lo, since E[S] = 2*s = lambda and E[L] = 2*l = Lo. Note that Var[S] = 2*s^2 = lambda*s and E[L] = 2*l = Lo, Var[L] = 2*l^2 = Lo*l, so the variance "scales" differently than in the case when we use exponential distributions.
What parameters do you use for drawing the graphs above? (i.e., Lo, and the paramters for lambda(t) ).
There is an interesting property if you convolve two exponentials with L0 and L1 characteristic lengths. The result is essentially proportional to "exp(-x/L0)-exp(-x/L1)" where L1>L0.
This means that the expected value should be
1/(1/L1+1/x) - 1/(1/L0+1/x)
If I pick something like L1=8 units and L0=7 units then the incremental dispersion looks like:

(this is the derivative of the above function)
What I like about it, is that it generates the "cusp" that Hubbert saw on his cumulative footage return graph. Look at the superimposed blue curve:

The non-sweet spot return shows a plateau at zero (constant positive rate) whereas the sweet spot definitely shows a cusp, which may be reflected by the actual data that Hubbert plotted.
I will try to reconcile the difference between your formula and this one. Admittedly, I did this my derivation in my head because of the convolution identity that dawned on me.
Yes, if L is a sum of independent exponentials with means Lo and L1, then L has density
(*) 1/(L1-L0)*( exp(-x/L1)-exp(-x/L0) ), for x >= 0.
(Of course, when L0->L1 this will collapse to a Gamma distribution with 2 degrees of freedom).
In the formulas above, I assumed that S is also Gamma(2,s) distributed, which perhaps is harder to give a physical interpretation than for L. If we assume S ~ Exp(lambda) and L density (*), then
E[D(S,L)] = lambda*(1 - 1/(L1-Lo)*(1/(1/lambda + 1/L1) - 1/(1/lambda + 1/Lo)) ).
But perhaps all this fiddling around with different distibutions is of moderate interest: it is probably most important to recognice that the most important thing is to have some kind of uncertainty ("dispersion") in lambda and L. Whether this is the case, I would say, comes down to how sensitive the "output" is to the various assumptions on the distributions, the "output" being whatever the model help us to say about the real world. (In this case, perhaps the expected volume of discoveries in the next few years.)
Another thing we could try to adress is the sample variability: we have focused on the mean of D(S,L), but it should be straight forward to compute condfidence intervals for future discoveries, given assumptions on the distributions of S and L. (Maybe you already did this).
Another (minor) comment: i don't think the single dispersive model corresponds to a uniformly distributed L --- in that model, L = Lo deterministically (i.e. point mass 1 at Lo in probability lingo).
In fact, L uniformly distributed on [0,2*L0] (to make E[L] = L0) gives
E[D(S,L)] = labmda*( 1 - 1/(2*Lo) + 1/(2*Lo)*exp(-2*Lo/lambda) ).