| The Derivation of "Logistic-shaped" Discovery | The Oil Drum | Poll: What do you think of the comment rating system? |
Peak Oil Overview - June 2008 (Pdf and Powerpoint available)
Posted by Gail the Actuary on June 26, 2008 - 3:00pm
| This is an update of my Peak Oil Overview at March '08. The major changes since my earlier post are the recent apparent decline in Russian production, the new ASPO peak oil projection, and discussion of the recent consumer producer summit in Saudi Arabia (slide 14). I also mention the expected change in IEA's November 2008 forecast of world production. |
This is a summary of the peak oil story at June 2008. The major themes of this presentation are
• The US oil story
• The world oil story
• Five myths
I have put this summary together in the format of a PowerPoint presentation plus notes. In this format, it is a multi-purpose document. You can
1. Read the post yourself, with or without my comments.
2. Use the presentation (PDF) as a handout, to give to one or two of your friends. My comments are intended to give you some more background, so you can better explain the presentation and answer questions.
3. Use the presentation for a group, using the PowerPoint format.
The PDF version of this presentation is available here. The PowerPoint version is available here.
Outline
• The US oil story
• The world oil story
• Five myths
2
The US Oil Story 3
The US Oil Story
4

Comments: US oil production has been declining since 1970, in spite of technology advances and new drilling in the Gulf of Mexico. The recent dip and uptick reflects lower production in 2005 due to hurricane damage, followed by a bounce back in 2006 and 2007, as the damage was repaired.
US Peak in 1970 • US had been world's largest producer
• Peak came as a surprise to most
---Had been predicted by Hubbert in 1956• Precipitated a rush to find oil elsewhere
---Ramp up Saudi and Mexico production
---New production in Alaska and North Sea5
Comments: We were fortunate in 1970 to find other places in the world where oil was available, but had not yet been developed. There are still a few such sites available (for example, some US sites that have been placed off-limits for development), but they are much smaller in relationship to what was available in 1970.
M. King Hubbert had predicted in 1956 that the US production of oil would peak in 1970, but few believed him.
On page 22 of the same report, he predicts that world oil production will peak "about 2000". His prediction was made in 1956. As such, it did not reflect significant changes in the 1970s, including the significant recession of the 1973-1975 period, the switch to nuclear and natural gas instead of petroleum for electricity generation, and mileage improvements for cars. If these had been reflected, the predicted peak would have been several years later.
Saudi increases were quickest • Saudi oil company was run by Americans
---Able to ramp up quickly• OPEC embargo in 1973, however
---Oil shortages
---Huge oil price run-ups
---Lead to major recession 1973 - 756
Comments: According to Wikipedia, Arabian American Oil Company (Aramco) was jointly owned by four US oil companies in 1970. In 1973, the Saudi Arabian government acquired 25% of the company. The percentage ownership was increased to 60% in 1974, and 100% in 1980.
OPEC began operation in 1965, but did not have pricing leverage until the United States could no longer produce the vast majority of its own oil, because of its decline in production. In October 1973, OPEC initiated an oil embargo against countries that supported Israel in the Yom Kippur War, particularly targeting the United States and Netherlands. The embargo lasted only a few months, until March 1974.
During this time, there was a sharp rise in oil prices, and a sharp drop in the stock market. In the United States, gasoline was rationed with people able to buy on odd or even days, depending on the last digit in their license plate number. According to Wikipedia, oil consumption in the United States dropped by 6.1% during this period.
The 1973-75 recession was the most severe recession since World War II. Merrill Lynch says it believes the current recession will be similar to that recession.
Other oil online by late 1970s
7

Comments: Even when an oil company wants to start new production quickly, it is difficult to do so. The ramp up in Alaska oil production had to wait until the Trans-Alaskan Pipeline System was completed in 1977.
It was known that oil was available in the North Sea prior to the oil embargo. It was not until the price run-up related to the embargo that it was economically feasible to drill there, however.
Production in all three of the areas shown is now declining. Alaskan production reached its peak in 1988; the North Sea peaked in 1999; and Mexico peaked in 2004. The shapes of the production curves vary for the different locations, depending on where the oil was located, and how it was produced.
Now the US is a major importer of oil
and a tiny user of newer renewables
8

Comments: This figure is from Page 166 of the 2008 Economic Report of the President. The data shown are 2006 figures. Percentages for the newer renewables would be slightly higher for 2007.
The larger circle on the left represents consumption. It totals 100 quadrillion Btus. The smaller circle represents production. It totals 71 quadrillion Btus. Renewables are in the section pulled out. In total, renewables amount to 10% of production or 7% of consumption. The vast majority of renewables are hydroelectric and "other biomass" (wood used to heat homes and fuel some electric generating plants).
Reading Slide 8 • About two thirds of oil is imported
• Biofuels make up about 1.0% of energy production - a little less of use
• Wind comprises 0.4% of energy production
• Solar comprises 0.1% of energy production
9
Comments: We use a huge amount of oil and other fossil fuels. Even with big ramp up in alternatives, they are still tiny. If a cutback is made in fossil fuels, either because of shortages or because of a desire to reduce carbon dioxide, it seems clear that at least part of the response will have to be reduce total energy usage.
The World Oil Story 10
World Oil: Discoveries follow same pattern as US production
11
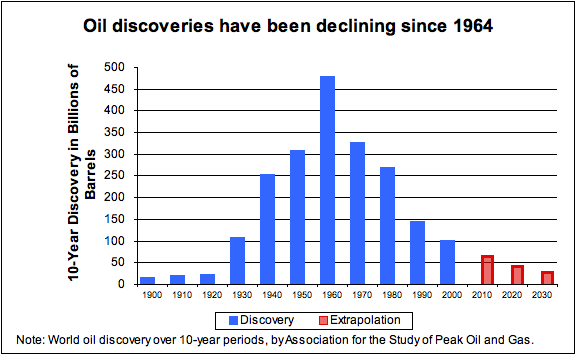
Comments: The discovery information is based on backdated information - what we now think old discoveries were worth. Some of the big oil fields in the Middle East were discovered about 1960. We are still discovering new fields, but they tend to be smaller and more difficult to extract. The discovery information includes only liquid oil, not oil in the form of tar or other solids.
The combination of discoveries which peaked many years ago, and oil extraction which tends to peak in individual areas, leads one to believe the eventually world oil production will peak. There will still be oil in the ground, but it will be difficult to extract. Eventually, we simply won't be able to keep extracting as much as we would like:
• As oil fields get older, the percentage of water extracted with the oil tends to increase. In some cases the water percentage exceeds 99%. Once an oil field's water production exceeds the installed water handling capability, production will need to be reduced. When the cost of additional water handling capability exceeds the cost of oil extracted, it stops making economic sense to extract the oil.
• Some of the oil will be mixed with toxic chemicals like poisonous hydrogen sulfide gas. Special techniques will be required to safely extract this oil. This process will be expensive and time consuming. A giant oil field discovered in Kazakhstan in 2000 has this problem and isn't expected to come on line until at least 2011.
• Some of the oil is found extremely deep beneath the sea. Special techniques need to be developed to deal with the high pressures and the temperature differentials encountered when drilling in these locations. Developing these new techniques takes time and is expensive. At some point, we will reach our limit on deep sea drilling.
• Some of the oil is very viscous, akin to tar. It can only be extracted by digging. Production requires inputs of fresh water and natural gas. Once limits on either of these are reached, production must stop. In some cases nuclear may be substituted for the natural gas, but this takes time, money, and agreement of the local population.
World oil production has stalled
12

Comments: Oil production on an "all liquids" basis was flat for the years 2005, 2006, and 2007. On an energy available basis, production actually declined. There are several reasons for this:
• The "All Liquids" summary includes lower energy products like ethanol and natural gas liquids. These have been growing, while crude oil production has tended to slightly decline since 2005.
• The oil produced requires more and more energy in extraction, because it is mixed with more and more water, and is found in deeper and deeper locations. More energy is required for extraction, leaving less for end users.
• If we look at oil available for imports, this has been declining since 2005. Part of the reason is the greater amount of oil used in extraction; part of the reason is that the standard of living in oil exporting nations is rising, so these nations are using more of the oil themselves, leaving less to export.
And prices are spiking
13

Comment: The fact that oil prices have been spiking since 2005 should come as no surprise. I show an estimated 2008 price on this graph, based on May 2008 prices, since we know the price spike has continued into 2008.
Given the shrinking supply and rising demand, the rise in prices was close to inevitable. Some of the poorer countries are being priced out of the market, and the use of coal is rising, particularly in China.
The higher prices have stimulated work on fields that were known, but not fully developed. Recent data compiled on oil megaprojects indicates that oil companies are now making a concerted effort to develop sites that may be available but have not yet been developed. Many of these projects are expected to begin production in 2008 and 2009, but delays are common because of shortages of manpower and drilling rigs, and because of cost over-runs.
It might be noted that in the 2000 to 2002 period, production stalled and even dropped a bit. Prices did not rise during this time period. They actually fell a bit. The reason for the decline during this period was lack of demand, due to recession. Now, many potential buyers are asking for more, but production does not seem to rise accordingly.
World has little spare oil production capacity
Saudi claims spare capacity, but current discussions relate to only
0.2 million BPD – would leave production below 1980-81 levels.
14

Comment: Saudi Arabia claims between 1.5 million and 2.0 million barrels per day of spare oil production capacity. There has been no outside agency auditing its statements for accuracy, so we do not know if its spare production estimate is accurate. Also, we don't know what type of oil is represented by this spare capacity. If the only crude available is very heavy, sour crude for which there is little refining capacity, the extra capacity may not be very helpful.
Saudi Arabia called a producer-consumer summit meeting on Sunday, June 22 to discuss how to stabilize prices. Saudi Arabia announced at that meeting that it will raise production by 200,000 barrels a day, apparently to 9.7 million barrels a day. At this level, crude oil production will be slightly over 2005 production of 9.55 barrels a day, but still below its 1980-81 level of production.
An increase of 200,000 barrels a day is quite small--about 0.2% of world production, so it is not clear it will make much of a difference. If the oil is very difficult to refine, this could limit the benefit further.
OPEC's true reserves are unknown • Published reserves are unaudited
• Last Saudi reserve while US involved was 110 Gb in 1979 (perhaps 168 at "expected")
---Production to date 81 Gb, implying 29 to 87 Gb remaining; Saudi claims 264 Gb remaining• Kuwait published 96.5 Gb - Audit 24Gb
• GW Bush says regarding asking Saudi Arabia for more oil
---"It is hard to ask them to do something they may not be able to do."15
Comment: If one analyzes the reserves for OPEC countries, one very quickly comes to the conclusion that the published numbers are unreasonably high.
This is the story: In the early 1980s, OPEC oil countries were all vying for high quotas. To get those high quotas, they believed that publishing high reserves would be helpful. One by one, OPEC oil countries raised their reserve estimates, in an attempt to make it look like they had more oil, so deserved higher quotas. To further this illusion, they kept the reserve numbers at the new high level, even when oil had been pumped out, and no new oil had been found.
The practice has continued for years. OPEC leaders found that by overstating their reserves, they gained new respect, both within their own countries and abroad. They also found that the practice was very easy to do, since no one is auditing the reserve numbers they provide.
A graph of OPEC oil reserves over time is as follows:

There are many other ways this problem can be seen. For example, OPEC's oil production is unreasonably low in relationship to its reserves, unless the countries are inept at production or are misstating their reserve amounts. (See The Disconnect Between Oil Reserves and Production.)
Another insight can be gained by looking at Saudi oil reserves, when Americans were involved in setting reserves. According to Matt Simmons' "Twilight in the Desert", Saudi oil reserves were 110 Gigabarrels (Gb or billion barrels in US terminology) in 1979, back when Americans were still partial owners of Aramco. If we subtract the 81 Gb pumped out since then, this suggests remaining reserves of 29 Gb.
If is likely that the 1979 American estimate was low. If, instead, we use the Saudi published estimate of 168 Gb in 1980, and subtract from it production of 81 Gb to date, we get an estimate of 87 Gb. This is less than a third of the 264.3 Gb that Saudi Arabia is currently reporting as reserves!
Kuwait is another country where we have an alternate estimate of the proven reserves available. An analysis by the Kuwait Oil Company as of December 31, 2001, showed proven reserves for the country of 24 Gb. Their published reserves were 96.5 as of December 31, 2001, moving up to 101.5 as of December 31, 2006!
President George W. Bush seems to be aware of Saudi Arabia's production/reserve problems. In an interview on ABC's Nightline, when asked why he didn't pressure the king for more oil, George Bush said
If they don't have a lot of additional oil to put on the market, it is hard to ask somebody to do something they may not be able to do.
US textbooks and newspapers seem to be unaware of the problem with OPEC reserves. They continue to quote huge "proven reserves" for most of the OPEC countries. The word proven adds credibility to the numbers, suggesting that somehow, the reserves have been proven to some authority, when nothing could be further from the truth.
The United States Geological Service (USGS) has added further to the confusion. It has taken the absurd reserves published by OPEC and made calculations based on US development patterns suggesting that OPEC reserves may, in fact, be low. USGS publishes its even higher estimates, confusing the situation further.
FSU production has increased recently (but may decline in ‘08)
16

Comment: The Former Soviet Union (FSU) saw a sharp decline in oil production in the late 1980s and early 1990s. With the adoption of modern extraction methods, they have been able to increase production again. There have also been some recent discoveries brought on line.
Russia represents over three quarters of FSU oil production. Toward the end of 2007, Russia's oil production began to decline. This decline has extended into the early months of 2008. Russia is now approximately tied with Saudi Arabia as the largest producer of crude oil in the world, so the possibility that Russian production may continue to decline is a serious concern.
Production going forward is uncertain • OPEC refuses to increase quotas
---Possible small increase by Saudi Arabia• Russian production has begun decreasing
• Little hope for US, North Sea, Mexico
• Canadian oil sands contribution is very small
• Recent discoveries have been small, relative to what is needed
• New production techniques can lead to sudden drop-offs
---Followed by small dribble for years from EOR17
Comments: Production going forward is uncertain. OPEC doesn't seem to willing/able to increase production by more than a token amount; Russia, which is the biggest part of the Former Soviet Union, seems to have begun to decline; and there are a huge number of countries already post-peak, like the United States, Mexico, and the countries that make up North Sea production.
Even Canada, apart from the oil sands, is post peak. Canada depends on imports--heavily from Saudi Arabia--for its oil. While Canada has been exporting oil from the oil sands to the US, there are really two issues involved:
(1) The amount of oil from the oil sands is not likely to ramp up quickly.
(2) Canada is likely to need the oil itself, as its other production declines.
There have been many announcements of new discoveries, like Tupi by Brazil, but these tend to be small relative to the world's needs. They will also take a long time to develop.
As noted on the slide, newer technologies can lead to sudden drop-offs. One reason is that fancier and fancier extraction tools (such as horizontal wells and maximum reservoir contact wells) have been developed. These are able to suck out a greater percentage of the available oil before production suddenly "hits a wall" when the layer of oil has been extracted, and the remaining oil is mixed with a huge amount of water and under little pressure. If this should happen on an enormous field like Ghawar in Saudi Arabia, we could very quickly see production drop by 2 million barrels a day, or more.
In recent years, quite a few "enhanced oil recovery" (EOR) methods have been developed. While these will have some impact, much of the impact of these methods is already reflected in the production data graphed. In some cases, like Mexico, it has permitted production to continue longer before the inevitable drop in oil production came. In others, it helps wells to continue to produce at a very low level after the vast majority of production is completed. The role of EOR seems likely to be one of making the post peak downslope less steep, rather than preventing decline altogether.
Projections of Future Production Vary Widely
18

Comment: The highest estimate in slide 18 is from the US Energy Information Administration. It is based primarily on demand, under the assumption that OPEC will always have additional oil available, if needed.
The next highest forecast is from the June 2008 newsletter of the Association for the Study Peak Oil and Gas-Ireland, prepared by Colin Campbell. This is a very well-known forecast. A link to it can be found here. It forecasts a peak in 2008, with a fairly slow decline after 2008.
The next highest forecast is that of Tony Eriksen ("Ace") of The Oil Drum staff. A link to his forecast can be found here. In this forecast, Ace considers the various Megaprojects, and when they are expected to go on line. He also considers expected decline rates on existing fields. He believes that we are on a plateau now that may last a few years. After that production will decline.
The remaining estimate is by Matt Simmons. In this interview, he mentions that he expects crude oil (not "total liquids") to drop to 65 million barrels a day by 2013. I have attempted to translate this comment into an equivalent projection, on a total liquids basis. It ends up being just a bit below Ace's projection.
World "All Liquids" Forecasts • "All Liquids" - Includes biofuels and "coal to liquid" fuels
• US EIA forecast - Based solely on demand
• ASPO Newsletter - Assoc. for the Study of Peak Oil and Gas Ireland, June '08
• "Ace"- Tony Eriksen, on The Oil Drum
• Simmons - Matt Simmons, recent interview on evworld.com
19
EIA expects biofuels, CTL,
and oil sands to remain small
20

Comment: The US Energy Information Administration's current projections suggest that it does not expect any of these fuels to grow to be significant between now and 2030.
Five Myths 21
Myth #1: OPEC could produce more if it used current techniques • National oil companies use same service companies US companies do
• Most are using up-to-date techniques
• Expenditures often are high
• Problem is very old fields
• Overstated reserves raise expectations
22
Comment: It is easy to see how this myth might arise, if people believe published reserves.
The International Energy Association (IEA) has indicated that it plans to sharply reduce its world oil supply forecasts, in its next set of forecasts to be published in November 2008.
Myth #2: Drilling in Arctic National Wildlife Refuge will save us 23

Comment: This slide is from a presentation of Dr. Sam Shelton of Georgia Tech. The oil from ANWR is expected to provide only a small upward "bump" to US production. It is not likely to make a significant difference in world oil supply problem, if/when it actually does come on line, many years from now.
Quite a few of the other much-hyped solutions are expected to provide equivalently little benefit. We will likely need to reduce consumption to better match supply.
Myth #3: A small downturn can easily be made up with energy efficiency • The quickest impacts are financial
---Recession or depression
---Serious recession in 1973 - 75• Use of biofuels raises food prices
---Further increases recession risk• Don't need peak for recession
---Only need supply/demand shortfall
---Likely what we are experiencing now24
Comment: The connection between oil supply and the economy is not well understood by most. A shortage of oil very quickly leads to an increase in prices and a cutback in the demand for other goods and services. The combination of these events tends to cause a recession. (See The Expected Economic Impact of an Energy Downturn.
Cutting back on usage tends not to be sufficient to prevent the problem, because there are so many other users around the world, including in China and the developing world. They are likely to cause an increasing demand for oil, even if we try to cut back.
Myth #4: Canadian oil sands will save us • Hard to see this with current technology
---Technology known since 1920s
---Production slow and expensive• Natural gas is in limited supply
---Alternatives require more capital• Most optimistic forecasts equal 5% of current world oil by 2030
---Even this exceeds available natural gas
25
Comment: There has been commercial development of the Canadian Oil Sands since 1967. Huge amounts have been spent, and there has been great damage to the environment. Even with this, production has remained small--only a little over 1% of world supply. Natural gas limitations suggest that we will never be able to greatly ramp up production. There are also issues with water (pollution, amount required) and carbon dioxide emissions.
It might be noted that a similar argument can be made as to why oil shale will not save us from peak oil. At this point, we don't even have an economic method of extracting oil shale. From what we know, extraction will require a large amount of water and considerable electricity. Finding adequate water for extraction is likely to be a problem. It is not clear that we will have extra electricity to spare either, for this large a project. Extraction is likely to be slow and expensive, since it will require moving large amounts of dirt around, plus heating and perhaps chilling the dirt. If we are able to extract oil shale, it will likely be in small quantities.
Myth #5: Biofuels will save us • Corn-based ethanol has many problems
---Raises food prices, not scalable, CO2 issues, depletes water supply• Cellulosic ethanol theoretically is better
---Still does not scale to more than 20% of need
---Competes with biomass for electric, home heat• Biofuel from algae might work
---Not perfected yet
26
Comment: Every study that has been done recently with respect to corn ethanol seems to produce worse indications. Corn ethanol has virtually no benefits over petroleum. It uses huge amounts of fossil fuels as inputs, so it has most of the drawbacks of fossil fuels. It also has its own drawbacks, including raising prices, damage to the environment, high water usage, and possible CO2 and other global warming gas increases because of land use changes and nitrogen fertilizer use.
At this point, there aren't good alternatives to gasoline commercially available, however. Since there is great political appeal to growing our own fuel, corn ethanol is supported by most politicians, even if any reasonable analysis would say its benefit is very limited.
Longer term, cellulosic ethanol may be a better solution, but at this time it is not commercially available. Even if we use wood and switchgrass as inputs, cellulosic ethanol will be difficult to scale up to provide more than a small share of the needed fuel.
Biofuel from algae looks to some like it might work. At this point, methods have not yet been perfected.
Contact
- Content: editors at theoildrum dot com
- Tech support: support at theoildrum dot com
License

This work is licensed under a Creative Commons Attribution-Share Alike 3.0 United States License.
Gail since you have the US production graph in your report. My forced logist model says that the recent flat production in the US over the last few years should be followed by a steep decline over a few years down to around 3mbpd. This gets us "back on" the logistic curve in a sort of stair step fashion.
http://www.eia.doe.gov/steo
Given the very mature nature of most US oil production I expect that if I'm right a rapid drop in US production should proceed global decline from forced production.
Given that I think it should have already started I really wonder about the validity of the reported US production. Given that I'm really just guessing about when the downturn starts I find it interesting. The basis is historically our plateau's have only lasted about 5 years or so in the past before going into a downturn. Given the high price of oil we may last a bit longer than that this time around but a imminent downturn should would or has happened. If we don't soon then my model could be wrong which is a good thing. But even a simple logistic fit puts us "off curve".
Just figured I'd bring this up since US production using just about any accepted peak model would indicate that US production cannot remain flat for much longer.
Hi everyone. New member as of tonight(early morning). Just thought I would say that this is a really cool place to tune into.
6 months ago I was wondering why the price of gas kept going up and up.....!!. Did some Googling(sp) and stumbled across this great little community, "Boy was I educated". This is my real name, I'm a student @ NMSU in Las Cruces NM. Seems like everyone goes by some sort of screen name around here; but for me, I'll keep it real. Anyway I don't have much to add to the fray, but I would like ask this:
If we open up(drill) all of our "off limit/closed areas" in the US and used those windfall profits/taxes to support food stamps and programs like Wic, would we be able to buy time for the less fortunate folks here in the USA by exporting this new "high dollar" crude source to fund our poor? I have a feeling after reading this TOD website we might all need a little help in the near future.
Thanks everyone, this is good reading.
P.S Sorry my first post is off topic as Gail E. Tverberg has put together some very compelling and easy to understand info. Lots of hard work. Thanks for the tutorial.
One last question to Gail. Why does peak oil interest you?
~byron calkins
Welcome to the fray -what are you studying?
I've been lurking here for about two and a half years and it has opened my eyes on many areas -not just Energy but financial and biological stuff too. Have a read of Nate Hagens 'Hyperbolic Discount Function' post -classic stuff!
(Also here: HyperBolic Discount Function)
Last summer I decided to summarise all I had learnt -here's my take in a nutshell: "Peak Oil Joining The Dots" -by Nick Outram
...and a nice little -updated- timeline, assuming we hit some sort of PO 'crisis event'/mass recognition around 2012:
Peak Oil Speculative Timeline ~2012 'Event'
Enjoy.
Nick Outram [Telecommunications Consultant and 'PO enthusiast'...]
Hello byron,
"would we be able to buy time for the less fortunate folks here in the USA by exporting this new "high dollar" crude source to fund our poor?"
As the US currently imports almost 2/3 of its oil needs, exporting it does not do any good. After all, the US will have to import just that amount more than if it is not exported. So it will be a waste of energy and money.
Opening up Alaska and the U.S. coastal regions for drilling at this juncture probably would have nil effect on the timing of global peak production. It would not change the shape of the global Hubbert curve since Hubbert's method assumes that all the significant remaining oil fields would be searched for, discovered, and used in the normal pattern, and that we wouldn't be so stupid as to ban promising areas from drilling just to keep from disturbing the habitat of the yellow speckled squirrel. If we were to proceed with the normal search and exploit pattern now, it would just try to catch us up a tiny fraction to the theoretical Hubbert projected peak, which we're passing already.
Economist types often fault Hubbert's method for projecting the global peak just because it was so accurate in predicting the U.S. peak. The global peak, they have long said, will involve such a price climb that, as in all commodity cycles, the higher price will bring a rush of new supply on the market. This makes some sense if you consider the basic geologic fact that about half the oil in a field is left there because it becomes uneconomic to recover. That's a huge amount of oil just waiting for the right economics. But I would direct their attention to the real world example of the U.S. peak in 1970. The price of oil climbed some 900% over the 10 years following this peak. This astonishing price climb did not bring the left behind oil rushing to market and did not alter the close following of U.S. production to Hubbert's curve.
Another big factor missed by economists with all the left behind oil, as well as shale, oil sands, and all unconventional oil, is flow rate. We have been used to conventional production where oil under high natural pressure comes spewing out of the ground already made up for us and ready to put into a pipeline. This is a vastly different type of flow rate than having to grind up, heat up, lift up, and manufacture oil using vast amounts of energy in the process. They don't understand ELM (the Export Land Model) or net energy. High flow rate net exported net energy is what sets oil prices.
" The price of oil climbed some 900% over the 10 years following this peak. This astonishing price climb did not bring the left behind oil rushing to market"
What about US price controls? Didn't they greatly diminish the price signal?
Thanks for your first post. It is great to have you on board.
I am working on a post on why I think we should drill offshore, which perhaps will be up in the next few days. My view on this is probably different from that a lot of peak oil folks on the subject.
I am interested in Peak Oil because it seems like it is the most important subject to the world today. As an actuary, I have been in the business of making forecasts about what insurance rates need to be in the future, and what claim payouts will be (and a whole lot of other forecasts). I became aware early on that Peak Oil would have a huge impact on the insurance industry, and would make most of the projections that actuaries are making invalid. These are links to a couple of my first articles, in insurance / actuarial publications:
Oil Shortages: The Next Katrina?
Our Finite World: Implications for Actuaries
http://www.cnbc.com/id/15840232?video=768919717
The EIA assessments on ANWR and releasing new land for drilling have pretty much said, it's going to take a long time and it's going to do next to nothing for oil prices.
Well, first of all there is nowhere near enough crude oil in these areas to allow us to become an exporter of oil, if thats what you are saying, and taxing oil companies is not going to increase production any, doing this sort of welfare thing would do nothing but rob peter to pay paul, not really any sort of solution.
Byron Calkins,
Glad to see another college student here on theoildrum, its frustrating how little people our age understand much less care about these issues. I've been on theoildrum for almost a year now( I have another name too), It's definitely a process and believe me when I say what you may be experiencing now is just the beginning, you have alot more to learn.
Good Luck,
Crews at the University of Oklahoma
. sorry it double posted
Hi Byron. In response to your question about America's offshore oil, I offer you a handy device:
1 million barrels of oil = one hour U.S. consumption
1 billion barrels of oil = one month U.S. consumption
1 trillion barrels of oil = one human lifetime ...
With this device, one can quickly make sense of the scale of an oil resource. A billion barrels sounds like a lot, but it's only one month.
The ANWR field in Alaska, for example, has about 20 billion barrels, or 20 months of supply for the U.S.
Thanks. I hadn't seen that before.
memmel,
Thanks for your observations. It seems like the US oil is the sum of several distinct parts, and these in turn are the sum of individual wells. In particular, we have US-48 onshore, US-48 offshore and Alaska, with different shaped curves. There is also the effect of EOR, which has probably been used a moderate amount here, possibly holding up the curve.
You may be right, but I am wondering if it wouldn't make sense to model the various pieces separately (perhaps defined slightly differently than I have suggested).
Great update, many good points. Thanks for all the work.
Some notes (based on the PDF version).
Page 11: Myth #1
"International oil companies use..."
Shouldn't that read "National Oil companies use..."?
As the text is referring to OPEC
Page 12: Myth #2
As oil is a worldwide fungible commodity, would it make sense to plot Alaska+ANWR on top of the world graph. That would really show how miniscule it is. After all, US producers will sell it to the highest bidder, anywhere in the world, right?
Page 13: Myth 4
Additional points: Requires lots of water.
Produces lots of greenhouse gases
Thanks. I will fix myth 1, and add to the discussion of 4.
Myth 2 issue I will keep in mind for the future. I am not convinced that oil will remain as fungible in the future as it is now. Even now, it depends on a proper match between refining capacity and oil type. I expect there will be a major drop in the value of the dollar relative to oil producing countries. If this is the case, we may find it difficult to buy much oil overseas. US oil sales may be regulated further.
Thanks for your comments, Gail. This was in fact what I've been thinking myself. And not just in the case of US...
This is through NPR, but the same question was reviewed in reference to Myth #2. It turns out that oil cannot be exported from the U.S. If it's pumped here, it stays here.
Oil that is pumped here is refined here. We also import oil and refine it. Sometimes some of the refined products are exported. With this intermediate step, it seems to me that some of the oil pumped in the US exported, not as crude oil, but as a refined product, such as diesel fuel.
But I think refined products can be exported from the US. I recently read that we export about 300,000 bpd of diesel.
On the other hand, maybe the cited diesel was made from imported crude. Does anyone here have more details of this restriction on exports of US oil? I think that rule could eventually become important.
That is really my question also. It is difficult to see how one could keep from commingling diesel made from our own oil with imports.
I also know that Alaska exports LNG to Japan. It was required to get special permission to do this, because it would be exporting a product that was produced in the US. Since there were no pipelines to transport it, it was given permission to do this. Of course, our LNG import terminals sit almost empty, while the LNG goes to Japan, and our natural gas costs rise.
Nice work Gail. I know it takes as much effort to know what to leave out as what to leave in, but I wonder if it worth having a slide on declining net oil exports (ELM), in particular from Saudi Arabia?
Also how about tackling the myth that speculators are causing high oil prices? Namely:
1. The paper oil futures markets (NYMEX, ICE) are more like a betting exchanges where participants bet between themselves on the future price of oil. Much like you can bet on the outcome of a football match without affecting the score, the bets on future oil prices don't affect the price.
2. Businesses, in particular airlines, use the oil futures market as insurance from oil price increases. If it weren’t for the presence of the oil commodity market, many more airlines would be under financial distress and / or airfares would be a lot more expensive than they are now.
3. It is only recently that the futures market has formed the view that prices will be flat or rising for the foreseeable future. Three years ago, the futures market was predicting long term prices of $45 a barrel (from memory), at a time that the spot price of oil was $60 a barrel. Since then, oil prices have continued to rise upwards in spite of speculators betting the price would come down, so the theory that speculators have been affecting the market is not supported by recent history.
My 2c.
Thanks for those ideas. I will keep them in mind for next time.
"The paper oil futures markets (NYMEX, ICE) are more like a betting exchanges where participants bet between themselves on the future price of oil. "
Fundamentally, futures markets are a marketplace to order commodities for future delivery at a fixed price(even if they're used as a casino). If many new participants place new orders, we have new demand, and prices will go up. Now, this effect may be temporary, as eventually delivery must be taken or the contract sold, but new paper bidders (speculators) can surely raise market prices temporarily (IOW, create a bubble). Even if it is only temporary, most futures contracts are measured in years, so why can't we see a bubble for a year or even more?
I'm no expert. But following your thought, you might distinguish a bubble in futures prices from a bubble in spot prices. The oil bought on futures contracts is not just at a fixed price, but at a fixed date. Everyone's bidding what they hope will be a good price on that specific date. But what the oil's worth on that date is not a function of futures contracts, but of spot prices, of what it costs on that day to buy oil for immediate delivery.
There are two kinds of participants on futures markets: those who can take delivery, and those who can't. If you're one of the latter, when the contract comes due you have to pay the price you bid. But since you can't take delivery, you have to sell it on the spot market. The buyer has no incentive to be sure you make a profit - quite the opposite. So the spot market looks to be immune from any bubble that may have occurred in the futures market. In fact, if there have been more speculative purchases by those who can't take delivery, who are then obligated to find a buyer on the spot market (or take a total loss) when the date comes around, that should tend to increase the supply on the spot market, and thus lower prices.
So a futures price bubble is not at all the same as a spot price bubble - and it's the spot price that determines the cost of gasoline at the pump. As for heating oil, some of that is bought by on yearly contracts, which typically are secured by the local dealers buying at least 75% of the contracted amount ahead of time on the futures market. So a futures bubble can cut into the availability of heating oil "pre-buys." Still, most heating oil is bought at the market price on date of delivery, so even there this is a minor effect; anyone believing there's a futures market bubble can simply not do a pre-buy (which most dealers aren't offering this time around anyhow).
You seem to think that future prices will not effect spot prices.
The rise will be temporary if underlying fundamentals do not support the rise. It would seem to me that TODers in general should think higher prices will be supported, but curiously those who post are pretty unanimous in seeing any speculative effect as temporary.
Those new orders promise future delivery of future barrels of crude which have, at the present time, not yet been extracted from the ground. I don't quite see how a forward transaction like that could affect spot prices today, except a maybe as a slight psychological boost to the current trading level.
If the speculators were buying and storing actual barrels of crude, that would be quite a different story.
There probably is more oil being stored now, maybe covertly, but that too is part of the market process. Keeping a prudent reserve in case of supply interruptions is, well, prudent.
"Those new orders promise future delivery of future barrels of crude which have, at the present time, not yet been extracted from the ground. "
If there are more future orders, we wouldn't know the status of that oil.
"I don't quite see how a forward transaction like that could affect spot prices today"
The heads of the relevant exchanges think that they do - they say it's a productive price-finding process, in effect bringing future shortages to the present.
"If the speculators were buying and storing actual barrels of crude, that would be quite a different story. "
The speculators don't have to store it. The logical place for storage is by the sellers who have promised future delivery. AFAIK we have little info about NOC storage, and in the final analysis NOC's can store oil in the ground.
Thanks for your observations. One reason I have left speculation out of the discussion is because I really don't fully understand what is happening. Your comments are helpful. ETFs are the next problem.
Hi Gail, Good work! You took out a useful graphic, showing demand and supply. Put is back in, and instead of giving 3 hypothetical supply/production forecasts (do it for crude, as it is most important as Cohen notes in his recent ASPO-USA article), and use some from TOD contributers and ASPO's (they are all much the same, which will add to the credibility. This demand/supply stuff is important in explaining the price of oil and in understanding Peak Oil. And, I want this slide for my report, which is also free and downloadable.
On your World Oil Production is Stalled 2005 to 2007 graphic, it is also stalled into 2008, so far (the little uptick in the last 2 months is not very much).
Isn't slide 18 what you are talking about? I think that one is still in.
I will keep in mind the idea of using crude estimates only, and using estimates from other sources.
Thanks Gail, You are right of course on slide 18. It is demand and supply.
I just looked at worlds liquids fuels production, and it looks plateaued to me for 2005 to 2008, using EIA data:
http://www.theoildrum.com/tag/oilwatch
Gail, you mention that the energy available has declined, partly due to a lower EROIE. Do you have any data on just how quickly EROIE is declining etc, and how much this has been affecting energy availability? Many thanks, Andy
I know there is some EIA data regarding how production costs have increases for US companies in recent years, but this doesn't quite get at the problem.
The issue is really with respect to new wells that are being drilled, like those planned for Brazil's Tupi field. It seems like those costs will be very high relative to current prices of oil. Also, as we go to smaller and smaller fields, the cost of infrastructure will get to be greater relative to the oil output.
Gail...thanks for putting out the "TOD Bible". It is an amazing conglomeration of information and easily read. You have a real knack for communication and this work is invaluable for getting the "message" out to the masses. You are an infinetly valuable resource here at TOD.
I'm with the rest of the gang Gail...EXCELLENT!
I've been a petroleum geologist for over 30 years and study every analysis of PO I run across. By far the best aspect of your efforts is condensing a complex technical issue to a digestable but complete story for the general public.
The only point I would add regards the use of phrases about what "will or won't save us from PO". Nothing will "save us from PO"...even if we were to discover an entire new Saudi Arabia and magically put it online overnight we would not be saved from PO. It might delay PO for 30 or 40 years but from a purely logical view we were destined to hit PO the day Col. Drake drilled that first well...it was always just a question of when.
I'm an advocate of expanding oil extraction to any area of the country where it can be done in a sound environmental way. No...the added production (regardless how fast or slow it comes online) won't save us from PO. As bad as the immediate prospects are for the impact of PO imagine how much worse the current situation would be had not the Deep Water Gulf of Mexico play started up 10 years. Had not those new fields kicked in your story line would have probably been out here 5 years sooner. But the earliest of these fields have declined significantly aleady.
We do need to quickly develop alternatives, nuclear, etc. But we all appreciate the time lag involved . Additional production, however long it would take to ramp up, would provide a small but needed cushon to make the transition. A drastic and mandatory conseration effort is the only "quick" adjustment available to us. Such an effort may be required but the negative impact upon the economy would likely mimic our expectations of the post PO world. Hopefully with the efforts of you and others the public might understand the importance of not wasting whatever breather room addition oil extraction might allow. But if they do slip back to business as usually then any additional drilling efforts would be pointless in the long term.
if alternatives become cheaper and start substituting oil, then it doesn't matter that we can't produce more than 85 million barrels, if the need for oil is 30 million barrels
Is it actually possible for alternative liquid fuels to be cheaper than conventional oil? OK, I know that sounds a daft question but unless the alternative is cheaper to actually produce then conventional oil will always win out. The ability to produce an alternative for $100 may force the PoO down to $99 but it won't force replacement of the oil. Not sure I've got my head properly around the consequences of this but I would expect conventional oil consumption not to decline any faster than the combination of above and below ground factors force it to. Barring massive global recession/depression or an unlikely and rapid change of our infrastructure.
tw
I think at this point the only alternative with the possibility of being cheaper than oil is Coal to Liquid. I don't see any possibility of scaling up Coal to Liquid to any reasonable percentage of our fuel needs, within the next ten years.
"Barring massive global recession/depression...." How is that barring to be done? Although individual posters may have a consistent position, the collective TOD wisdom seems to be (1) the geology of the situation means that oil production will not keep up with "demand" (in the colloquial sense) and this will lead to extreme social and economic conditions, however (2) oil depletion will not be effected and will continue at a ruinous rate.
Thanks for the ideas. I think your suggestions could really be part of a different post.
I live in Northern Colorado and have a number of contacts with people working the oil patch from here thru wyoming to Montana. I also have friends working at Colorado State University on several biofeul projects. Just a few observations.
1. the drillers are running flat out. rigs are breaking down because they can't get enough parts or people to service them. Most of the new techniques to expand and fracture rock are being used to pump every barre they can. They are having huge problems using water to pump wells. Natural gas is being brought on line at a great rate but is also being used up at a great rate. Many beieve there will be continued expansion of production for a few years and then a dramatic (a la Cantarell) drop off.
2. Alge to oil experiments are going on and progress is being made....slowly. We do not have even an idea of a scalable model.
Thanks for your comments. They go along well with my post on Wamsutter production. I probably need to go back to the subject and write a more general article. Once we max out on rigs, we hit can't add to our tight gas production. If conventional gas is production is falling, the total will fall.
The great would be even greater if it could be converted into a video. Quite basic equipment (such as my cheapo camera with separate microphone fed into the soundcard) can give useful results. Any chance?
I did something like you are suggesting with my talk on Expected Economic Impact of an Energy Downturn, using some of my husband's software. I could probably do it with this also.
Thanks for the idea!
Any chance of a few dancing girls in it? Just to keep our spirits up? :-)
I'm afraid I wouldn't be one of the dancing girls. Perhaps we have some young volunteers.
There's always Oily Cassandra.
;P Mash
Great post, Gail!
KiwiCam, including myself, would like to know how you plan to tackle the myth that speculators are the real culprits behind soaring oil prices. And now that the MSM is mostly blaming oil speculators, not the underlying fundamentals of oil, for this recent run-up in oil prices, I'd especially like to hear your take on the issue of speculation vs fundamentals...
The basic argument seems to be that the speculators are not taking physical possession of the oil, so they are not running up the prices. Also, it seems to me that long dated oil prices are still a very good deal relative to current prices, if a person believes in peak oil.
I'd like to see if anyone comes up with any concrete ideas on this, before I try to tackle this one. At this point, I don't feel like I have a whole lot new to add to the discussion.
Dragonfly41, nothing personal, but I don't particularly care for your phrase "TOD Bible", simply because it implies that peak oil is rooted in religion, not science.
Just an expression...that's why I put quotes around it. Not meant to be tied to religion...meant to convey it is "The" document that TOD needs to rally behind and perfect.
Another issue we have heard is that TOD means "death" in German. It would be nice if we had a less-ominous sounding abbreviation.
Hmmmm...the Death Bible...no...that's not so good is it?
OT...congrats on releasing this document on a day that WTI crude struck through another record...$140 intraday and $139+ settle....good timing overall I'd say.
I wouldnt get too bothered about that, partly because some words already have contrasting connotations. For example black as positive:
"[the currently fashionable colour] is the new black"; "in the black"
vs negative:
"a black look", "black mark", the Black Death, etc.
Great work Gail and I just want to reiterate what I wrote awhile back as I believe you were on vacation. You have enhanced The Oil Drum in so many ways I really can’t thank you enough for taking this on.
One thing about the presentation is I would put a lot more stress on net energy as everything that is happening right now can be better understood when considering ERoEI.
The difference between 100 to 1 and 10 to 1 is HUGE and IMO enough to cause a lot of the problems we are seeing regardless of production numbers.
Thanks again for your good work.
Jef
I think that net energy really has to be part of a "Part 2". At close to 4,000 words, we are probably pushing people's willingness to read / listen now.
I'd very much like to add my thanks and compliments.
Your contribution is not only invaluable, it is also uniformly good-humoured.
Many thanks.
Let's help Gail spread this around. Hit that digg button. Hit the reddit links below. Send it to your friends. Send it to metafilter, or stumbleupon.
Help Gail out and get her even more readers.
http://www.reddit.com/info/6p3nh/comments/ (environment subreddit)
Great work, as usual, Gail.
I'd add a couple more myths at the end:
Myth #6: Energy Efficiency or Conservation Is Not An Answer
For this one, you might point out the many advanced economies with per capita GDPs as high or higher than the US but with much lower per capita energy use. You might also point out that in many ways the energy saved by reducing waste is a lot less expensive than developing new sources of energy.
Myth #7: There Is No Substitute for Fossil Fuels, Renewable Energy Sources Are Not Yet Cost-Effective
For this, point out that wind is already competitive with FF electricity. You can mention that anaerobic digestion to produce methane biogas from agricultural and municipal wastes is already a mature technology and in operation in many locations around the world. Solar thermal (water and space heating) is also in widespread application and is generally cost effective. Costs for PVs and CSP projects are declining rapidly as production increases and economies of scale are realized.
I am suggesting this because it allows you to end on a slightly more positive note - leaving the audience with the idea that conservation + renewables is an appropriate and viable action plan that they can embrace.
I'll think about those. I am not sure that they are really myths.
Regarding Energy Efficiency/Conservation, I think there are several issues:
1. I think we are headed for a "cliff" in terms of oil availability to the US, because of our financial problems and huge imports. Energy efficiency or conservation works a whole lot better for small problems.
2. Our physical layout ties the US to high energy. It is physically a long distance to get from one place to another, much more so than in Europe or Japan. Population density is such that rail makes much less sense than in Europe or Japan, and in any event, would be hugely expensive to add now.
3. Our infrastructure is built for high energy use. We have a huge inventory of cars, mostly large, and expressways, that require maintenance. Our homes are large. We can add insulation, but short of moving together into a subset of the homes, and tearing down the rest, it is difficult to really reduce costs.
Regarding substitutes, I think the biggest issue is that we don't have a good, scalable liquid fuel substitute.
I think the other issue with respect to substitutes is that in the US, we have pretty well maxed out our capability of adding variable power (wind, PV, CSP) to the grid. In order to add more of these, we need to go the longer route of (a) putting a number of the new electricity suppliers in a common location, (b) including adequate electrical storage capacity, and (3) getting transmission lines built to this common location. This is a more expensive and time consuming approach than most who are looking at costs have considered, but is likely the only way it will work. Since the costs with this approach are higher than current costs, it is not clear that there will be political will to do this.
I think you underestimate the energy savings possible.
Few people in Japan heat more than one room.
Large rooms mean that if you are willing to sacrifice space it is easy to insulate on the inside of walls - you put in rolled insulation and damp-proofing and plaster-board over the top of it.
You sacrifice the bedroom above and put in 250mm of insulation there.
It is about 3 days work, the biggest hassle being moving any electric points to the new raised surface. (BTW, I used to do building)
Snug as a bug, and cheaply too.
Plastic bubble-wrap type coverings as used in greenhouses drastically reduces window heat loss at a couple of dollars a meter.
If that room is a kitchen/dinner/lounge then cooking provides most of your heat.
Residual needs if supplied via an air heat pump, or possibly just piped down from the attic, could be very cheaply met.
A large roof area means that you can easily use solar thermal for most hot water - this can even be jerry-rigged by the use of bottles and plastic pipes if money is tight.
Having big, wide roads means that if traffic really falls only some of the lanes need maintaining, whilst electric bikes and trikes get you about.
Having a spread-out population means that a lot of power can be generated locally, with wind, biogas and solar power:
http://www.cpuc.ca.gov/EFILE/CM/80092.pdf
80092.pdf
And:
http://www.treehugger.com/files/2008/02/germany_gets_cr.php
Germany Gets Creative with Renewables : TreeHugger
If you want to see real problems check out the threads on the UK!
The problem is that most of the floor plans are very open. There are just wide arches between rooms. Pillars were popular for a while, to indicate the end of one room and the beginning of the next. We have high ceilings in a lot of rooms as well. Where there are actually two stories to a room, I understand some people are adding a room above the lower room. It is hard to close off much space just by closing doors.
Putting in stud-wall partitioning is still trivial, in fact it makes things easier as you can position it to get the desired size of room, as a good compromise on space vs heating bills, and you would not have to fiddle around on that wall by moving sockets.
High ceilings also help, as you don't need to wreck a bedroom to put in insulation, just build a false ceiling and put in as much insulation as you like.
In the UK, when open plan was fashionable, there were a lot more problems taking out walls, as if you take out the wrong one the place can collapse!
The problem is one of expectations. People in the US expect all the rooms to be heated. Doing a build to adapt houses to use a lot less energy is straightforward, and much easier on large houses - finding space for the extra insulation without causing too much inconvenience is tougher in smaller, more restricted properties.
It would not cost too much either, particularly with little new housing being built, so that the guys are scratching for work.
A week, tops, if they know what they are doing, although I am not allowing for whatever adaptions you would need for good air flow in the summer with your hot summer climate - I am from the UK, so know stuff all about that!
EDIT:
Hmm, just thought, you might have to check the pipework, and shift some of it or increase lagging - I am not used to working in such a severe climate as in parts of the US, and the pipework will have been laid on the assumption that the house is kept heated - in the UK specifying that pipework is at a certain distance from the outside walls is usually enough, as per the building regulations.
It would probably be best to cut out any upstairs plumbing, and just to keep enough heat downstairs for one bathroom, so that your only run of pipe is between the kitchen/living room and the bathroom, which would have to be kept above freezing.
Agreed, keeping pipes from freezing is a problem, even when houses are heated as they are now. My parents in Minnesota moved to a retirement home, and kept their old house. My siblings set the temperature at 55 degrees, since no one was living there. They found that the pipes under the sink froze at that temperature because of the cold outside temperature, since there was not enough warm air circulating around them.
A lot of US homes have 3 or 4 bathrooms, so there are a lot of pipes around.
It can be seen as a problem or an opportunity, according to taste.
That means there are 2 or 3 excess bathrooms, and umpteen radiators which can be cut out of the circuit, and drained so they won't freeze.
So before you start on insulation you have reduced fuel use to a fraction of that which it was previously.
Of course, those with more funds would not have to heat just one room.
All the external walls could be heavily insulated, but you pay a lot more for that and keeping the larger space warm.
I was just a jobbing builder though, it would be nice to talk to architects, who would be able to come up with clever ideas for reducing heat losses with some style.
Open plan became fashionable when heating costs are low.
In Victorian time many house had what was called a 'snuggery', which was tiny and warm, as most of the house would be cold most of the time.
When the problem of economically heating a house moves to the mainstream, small rooms will be fashionable again.
DaveMart,
You may be giving readers a wrong impression. While its true that a big car places limits on fuel economy, a big house can be insulated very effectively. For a start, a large two story house has a much lower area of roof and outside walls per unit of living area. Thus the cost of adding lots of insulation is relatively less, and can easily spare a small loss of inside area by adding additional 15cm insulation to the walls(adding 6 inch studs over original wall).Plumbing can be solved by leaving a small uninsulated space between pipes and inner wall, but insulate on outer-side. Same applies to replacing single glazed windows with double glazing,larger houses have relatively less window area. Victorian houses didn't have any insulation or a few inches of wood shavings. Sweden and Canada have many very,very, energy efficient houses, no real need to close off any rooms, we are talking about less than 200-300 watts to heat when its -30C.
People in warmer climates underestimate the heat loss through windows, under doors, cracks. This can be equivalent to having the front door open. If you stop the drafts and insulate the outer walls, you feel warm at 20C, just like in summer.
Many Canadians, turn down temperature, put anti-freeze in toilets and sinks and turn off inlet to house and open taps, whenever they go on holidays to Florida in winter in case gas or electricity goes off.
Fair comment. If you have the funds, then you can indeed make a house very energy efficient. I was just trying to indicate that even if funds are tight, then there is no need to freeze, as it is a relatively simple building job, especially in a roomy house, to provide adequate although not luxurious standards.
As money allows this could be extended to more of the house.
In any case, the basic point is that the infrastructure is a lot more robust and can be adapted more easily than indicated elsewhere in this thread.
Part of the action plan is also going to have to be increasing the number of warm bodies in those big houses. With enough warm bodies, good insulation and weatherstripping, and just a little supplemental heat, you shouldn't have to be worrying about pipes freezing. If two people are trying to keep warm in a 2000+sf house, they need to be thinking in terms of bringing additional inhabitants into that house. It could be family or relatives or friends boarding with them, or they could rent out rooms, or subdivide and create an apartment.
In areas which are central and have good transport links so that you can save on travel expenses as well, then I would expect a lot of properties to be split.
In other areas though as indicated in other posts it is fairly easy and cheap to insulate enough so that you don't have to have strangers living with you, and I would have thought people would prefer to do that.
In the 'Little House on the Prairie' series the one called 'The Long Winter' deals with an exceptionally cold winter on the great plains in the 1880's.
They were living in a clapboard town house, and twisting and burning straw to prevent their freezing.
None of the families, apparently, considered moving in together to save heat, and indeed they would retire at night to their entirely unheated bedrooms.
The only time it was warm was when a snowfall provided insulation.
Some compromises will be made, but for most people I suspect not so far as to seriously compromise privacy, although the venerable habit of taking boarders may make a comeback to provide accomodation near to work without commuting in central areas, housing people from the exurbs during the week.
As a Third World citizen who visits the US occaisionally, I have always been appalled by the level of waste/inefficiency in the US economy. First off, at the risk of sounding like a broken record:
Source: Comparison of Passenger Vehicle Fuel Economy and Greenhouse Gas Emission Standards Around the World
It is only in the US or some other oil producing country that, driving a vehicle that gets less than, say 20mpg, would be considered normal for even a lower income person. Where I live people don't think 30mpg is exceptional. Save that description for 40-50mpg. It is heartening to see that the average US consumer seems to be waking up to the fact that, a Honda Fit or Toyota Yaris will move two people around just as well as a Chevy Suburban, on about a third of the amount of gas. I think the potential savings in the area of transportation fuels are enormous.
In the area of housing, I have not detected any huge difference between how house are built in say Miami as opposed to Boston. The differences in Climate are huge and so should be the styles of houses. In the tropics, old plantation great houses were often masterpieces of low tech passive cooling technology. In the modern world it seems that a lot of these sound design principles have been thrown out in the interest of some standardized building code which does not seem to take into account differences in climate. What I am saying is that houses in Florida should not look like houses in Maine. One should be able to look at a house and determine the climate that it was built for. Yes, it should be that obvious. The point is that, if a dwelling is properly designed with respect to the climate, it's energy use can be greatly reduced.
There are just so many areas of energy use in the US where I see potential for huge savings. In oil importing countries where this "fat" is not available for trimming these opportunities are a lot smaller.
I do agree with point 3 that, the US has the legacy of being a big country that was once "king of oil". Problem is, although the US lost the crown in the 70s, 30 years later, it still has not lost the mindset. Post peak, a lot of the things that are going to have to be done are going to be difficult.
Alan from the islands
I agree with you about quite of few of these problems. The problem is the difficulty in fixing them.
There is no reason to have all these inefficient cars and trucks out there. People will stop driving some of them, default on their loans, and let the lenders take them back. These vehicles may eventually be taken out of the system, but I am sure the lenders would like to get their money back on them, so will try to sell them, even at a loss. Meanwhile, this approach further hurts the financial system.
With respect to the houses, once they are badly built for the location, it is very difficult to fix them to be more energy efficient. For example, I saw a lot of high rises in Honolulu, with windows that did not open. I am sure that the homes/ offices require a lot more cooling than would be necessary, but it will be difficult to fix. I don't think we will building many new homes, because we have such an over-supply now. This makes the problem more difficult to fix.
Gail,
I have enjoyed your well researched articles, but on the difficulty of making homes more energy efficient, you are miss-informed. As I stated in earlier post above, improving insulation to even 100 year old homes is usually simple and not too expensive. I did 3 such homes in Winnipeg Canada following the 1979 energy shortages, and I am not especially good with a hammer and saw. I let professions replace the windows( the most expensive part), the rest was additional glass wool insulation and dry wall.
I wasn't trying to say that insulation won't work. I think it can be very helpful.
In areas like Hawaii, one can often get along without heating or cooling, if the windows open. If the building is closed up, it is almost certain to overheat, even with good insulation. Homes in Hawaii are often built with only single walls, because there is no need for either heating or cooling, if one opens the windows. It is crazy to have closed in buildings, and then tackle the problem with insulation and air conditioning.
In quite a bit of the US mainland, all that is needed to cool off homes in the evening if homes are properly situated is simply to open the windows, and perhaps use a fan. Insulation is an issue, but not the only one.
thewatcher,
Your comment brings us right back to the chicken/egg impass. Higher oil prices....more incentive for alt fuels...more alt fuels...cheaper oil. But, IMHO, it's the time lag that's troubling. Let's assume the coal-to-liquids is a viable approach (even though I've seen few who think it would be practical). But just as a place holder in our model. Whatever the initial cost it would have to be very high. The upfront capital costs and the low initial sales volume would seem to demand it. But, in theory anyway) once production volume reached a significant level (lets use 50% replace of gasoline consumption)then cost may be down at a practical level. But the financial incentive to go this route (or any other) won't develop until PO drives fuel cost to levels damaging society to a significant level. But the ramp up time for any significant alt source would be decades. And this would be a very painful incubation period.
Thus back to my original point: though it goes greatly agaisnt my libertarian nature I think the gov't needs to initiate an aggressive policy (higher fuel taxes, etc) to force consumption down to quickly build the incentative for alts. Adding a little more domestic oil production would also help build this buffer. I've read every permutation of alt development and even accepting some dubious economic assumption, I've seen no plan that develops quick enough to avoid a serious economic crush should PO arrive as soon as most here believe.
hi Rockman
Completely agree that PO needs to be handled with the right govmnt policies, subsidies etc rather than being left to the mercy of market forces (in which case it would be too late if it isn't already). I'm guessing from your comment on the need for higher fuel taxes that you are posting from the US? Here in the UK we already have lashings of tax on petrol - but interestingly it hasn't stopped us popping out for a sunday drive, clogging up the motorways or driving the kids 500 yards to the local school. Simmons always points this out, that fuel is 2-3x more expensive in the UK, although for some reason he always talks about price per cup which I find strange, as though he's drinking the stuff!
I think the incentive for alt fuels will remain, not because they can compete on production cost with conventional oil but simply because the latter will not be available in sufficient quantities. Marginal cost of production will however maintain high prices and also ensure all available oil has 'first dibs' on usage. I guess the point I was addressing was that oil consumption could fall to 30mbpd with the advent of alternatives - that's what I can't see happening anytime soon.
rgds
tw
I'm not sure whether higher taxes would do all that much ( or be that feasible). The price of gasoline and diesel has tripled in recent years, and this has already gotten people's attention. I am not sure how much more a tax could be expected to do--passing even a small tax would be difficult.
The problem with coal to liquid is that it is not very scalable, very quickly, just like other options are not. One needs to open new coal mines, find equipment, find workers, possibly build trains for transporting the coal. We use twice as much petroleum as coal, and the process of making a liquid from coal is relatively inefficient, so it is difficult to see how coal could ever be scaled up to amount to more than, say, 10% of current usage. The EIA International Energy Outlook 2008 that came out yesterday, in its high cost scenario, showed a situation in which the US scaled up to 1.2 million barrels a day of coal to liquid by 2030. We currently use about 20 million barrels a day of petroleum, so this would still be about 6% of our use.
Similarly, making cars more energy efficient will not help very much, very quickly, since it takes a long time for people to buy new cars, to feed into the system. If there is a tax of fuel, people will find themselves poorer and poorer, and less able to buy the newer, more fuel efficient cars. Thus, the tax might even be counter-productive.
Gail, congratulations on an excellent job in collecting, summarizing and presenting an impressive amount of data. Seeing everything presented in one place makes the case for peak oil all the more compelling.
One point on which I disagree, however, is that a lack of natural gas will limit production from the oilsands. NG is currently used both as a source of heat for extraction and as a source of hydrogen for upgrading. However, there are alternate sources possible for both heat and hydrogen and it should be possible to extract oil with much reduced (or even zero) requirements for NG.
Over the past year, plans for nuclear plants with a total of 4GW capacity have been proposed for this region. Two suggested sites are Peace River AB and Lloydminster SK - at the western and eastern limits of the oilsands deposits.
I'm not suggesting that the oilsands are going to solve the coming energy crisis. But I think that their potential contribution is generally underestimated.
I think you may possibly have a point, but right now, the situation is not that clear.
You may remember that I was the one involved with the post on Toe to Heel Air Injection in August 2007. I have also posted a graph showing historical oil sands production:
It seems to me that Canadians are getting pretty fed up with pollution and other problems. On the other hand, THAI is still doing all right, but not quite as well as originally hoped, and that there may be some competing technologies that will work. It is hard to know how all this will work out. The oil sands long history suggests that production is not likely to go too far too quickly. I wonder if perhaps heavy oil in some other part of the world, where it doesn't have such a bad history, will "take off" first.
1) "Canadians are getting pretty fed up with pollution"
People who live in a harsh climate have to be realists. Reliable energy in the north isn't about lifestyle choices - it is about survival. That is why we have an indigenous nuclear industry and it is why oil sands development was subsidized for decades before it was economic.
If you ask people if they are in favour of pollution, they will answer "no". If, instead, you ask them if they want to freeze to death, they will have a very different answer.
2) Long history of limited production
One of the major problems that oil sands development has faced was the difficulty of selling the product. Now that competing sources are both very expensive and increasingly unavailable, that difficulty is vanishing.
3) "heavy oil in some other part of the world"
Engineering solutions can only be found by "real world" experience. Western Canada has the greatest concentration in the world of heavy oil/bitumen processing knowledge along with all the specialized support infrastructure. This business is all about "learning by doing" and nobody else has been "doing" anywhere near the same scale.
There are lots of fantasy solutions floating around. But there is a very real possibility that TS will HTF much sooner than anyone is prepared for. Real solutions require *time* to implement - and I'm thinking that time has just about run out.
Getting oil out of bitumen is difficult, expensive and dirty. But at least it is *real* and is in production at scale.
I would start with an explanation of the 40 Year Factor. Hubbert based his prediction on an analysis of the lag between discovery of a mined resource and the following production profile. He found that production peaked 40 years after discovery peaked. He saw that oil field discovery peaked in the US48 in the early 1930s and predicted production would peak in the early 1970s. He was right. Worldwide discovery peaked in the 1960s or roughly 40 years ago.
I expect new discoveries now are going to peak in less than 40 years, partly because they are smaller, and partly because we are desperate and have developed technologies to get oil out quickly. The North Sea peaked in 1999, about 25 years after production was started (longer after discovery). Alaska peaked about 12 years after production was started.
I am afraid telling people 40 years would give them false hope on how long oil will last.
Hi Gail,
Could you please elaborate on your assertion re: cellulosic ethanol?
I would like to know how you arrived at the 20% figure. And how does 'still does not scale to' apply exactly?
No doubt you would agree that cellulosic ethanol doesn't scale to anything at present.
There are a lot of problems with biomass and cellulosic ethanol made from biomass. One is that everyone has their eyes on the same biomass, as the solution to their problems. The electric utilities want to burn wood chips or switchgrass to fuel their utilities. Homeowners all want to buy wood burning stoves, to save themselves from the high cost of natural gas heating. Besides this, the folks making cellulosic ethanol have their sights on the same biomass, so the first question is, "Who gets what?" We know that in the 1800s, with a much smaller population, we had difficulty with deforestation, when wood was being used for home heating.
My estimate of 20% from cellulosic ethanol is probably a vast over-estimate. The US currently uses about 100 quadrillion Btu (quads) of energy a year (See Table 1 from here); 40% of this or 40 quads is from liquid fuel. To replace this would take 8 quads of energy, derived from biomass sources.
Nate has a post in which he talks about the energy of wood, found here. In it, he says that we are essentially using all the wood that is available from forest now, for one purpose or another. Let's suppose, however, we decided to use it all for cellulosic ethanol instead. Based on his analysis, if we were to take all of our sustainable energy from forest products, including both hardwoods and softwoods, and other forest products, we would get about 2 quads of energy a year. From this, we would have to net out the energy actually used in making the cellulosic ethanol - probably at least 50% of the initial starting amount. This would leave us with 1 quad from forest products, assuming that the electric utilities and homeowners decide to forego their usage.
We could plant more forests and grow switchgrass, but how much could we grow? Seven times as much as from current forest products? I hardly think so. You get the idea of the problem.
I'm going to have to disagree with that analysis - as would many others. Moreover, I would assert that you are conflating energy replacement with liquid fuel replacement and in particular, petroleum replacement, which ethanol (even corn ethanol) does exceptionally well.
And although there isn't a respected scientist in the field making the claim that biofuels will 'save us', there remains quite a few learned people who subscribe to the notion that biofuels and ethanol in particular could make a considerable dent to US petroleum dependency.
Peak oil is a liquid fuels crisis. As such, it will be the liquid fuel replacement programs that will get biomass priority if not for the simple reason that there is no other renewable source for liquid fuels and this is the nature of the crisis.
4 years ago, the National Commission on Energy Policy highlighted a future scenario where 50% of the current US passenger fleet could be fueled with biofuels from an additional 60 million acres of land. This analysis was based on an increase in yield of Dedicated Energy Crops (DECs) to 10 tons/acre and improved conversion efficiency of cellulosic production processes. The report is available here: http://tinyurl.com/67pr9z
This same report outlines future scenarios where a 40mpg CAFE standard would narrow the required land usage to 30 million acres. That is the current size of the US Conservation Reserve Program (CRP) - 16.9 million acres of which were identifed as being suitable for DEC utilization by Oak Ridge National Labs (using switch grass - not hemp).
Note: forested areas were not touched.
There is also the famous Billion Ton Study, prepared by the Oak Ridge National Laboratory in 2005. It asked the question, how much biomass could be collected sustainably each year (with lots of fertilizer), if we pulled out all the stops. It calculates that we could collect 1.3 billion tons a year, but does not convert this to a BTU basis.
Nate uses 6,400 BTU per pound for all wood types in his story. It would seem to me that would provide 1.3 billion x 2000 x 6,400 BTUs, or 16.64 quads of energy if I did the calculation correctly. If we subtract out the energy required to make the cellulosic ethanol, we might get to something of the order of magnitude of 8 quads of energy for cellulosic ethanol, which is equivalent to 20% of petroleum use.
The questions I have are:
1. Where do we get all of the fertilizer for this?
2. Are all of the other users of biomass planning on doing without?
Yes, I am quite familiar with the study and I would easily take 300,000 million tons off the top -leaving us with a billion tons- of which agricultural resources were 3x greater then forest resources.
Nate's work is based upon the annual cull of firewood from U.S. forests, not a bi-annual cull of fast growing DECs.
I stress U.S. forests because your neighbor to the north is gearing up to completely restructure its massive forest resource base to a bioenergy production model.
Lastly and in a sweet sense of irony re: fertilizer...
It is the ethanol proponent's own arch nemesis Dr. Pimentel, who proudly asserts that yields of organic corn and soy crops, would in 5 years time, equal that of conventional farming http://tinyurl.com/bgf99
Similar yields, increased carbon absorption, greater bio-diversity, decreased GOM deadzone and a 30% increase in corn ethanol's EROEI: all from an organic corn ethanol mandate.
Something I proposed 2 years ago... to the sound of the proverbial crickets.
My prediction is that within 10 years you will be able to buy organic ethanol and/or biodiesel at a premium at the pump. I would welcome that.
Perennial cellulosic biomass plants are LOW FERTILITY crops. University of Illinois Urbana-Champaign field trials of Miscanthus giganteus are returning yields of 15 tons/acre with NO fertilizer applications. If corn farmers switch over part of their production to biomass crops, there will be a NET REDUCTION in fertilizer use.
These perennial grasses are harvested after full senescence, when nutrients have been translocated into the underground root system, leaving dry above-ground stalks at equilibrium moisture content (that is, no supplemental drying is required). You're harvesting straw, not hay. REAP-Canada's switchgrass trials have resulted in an EROI of 14.6 for pelletized fuel for high-efficiency stoves.
The last DNR auction for timber sales in my region of northern Minnesota, northern St. Louis County, resulted in over half the proposed sales receiving no bids at all. With the crash of the home building industry and the closing of OSB plants, there is now an excess of unharvested wood. There is a proposal in discussion to build a local pelletizing or briquet plant.
It is irrelevant to use present liquid fuel usage rates and apply them to predict fuel demand for a post-fossil fuel future. Our gross inefficiency has only been made possible through access to inexpensive, plentiful fossil fuels. This inefficiency cannot be maintained into the future, no matter what scenarios are used.
As University of Manitoba energetics expert Vaclav Smil has emphasized, it is diesel fuel that is the most important portable fuel in the world. Without it, commerce grinds to a halt. Discussion on sites like TOD tends to focus too much on replacing gasoline for private cars. While battery-stored electricity is certainly a viable option for private transportation, it is not at all workable for industrial uses, like construction and agriculture, or cargo transportation by road, air, or ship. Biofuel will be critical for providing portable, energy-dense liquid fuels for these applications. (Rail can use mains electricity provided by wires, and thus will become more important in the future.)
Even if we solve the fertilizer issue, we are still at the 20% of petroleum use level (assuming homeowners and electric utilities are not too interested in getting a share of the total).
Gail, I again, respectfully disagree with your assertion that cellulosic ethanol can only replace 20% of U.S. petroleum usage.
As far as I can tell, you have based this number of the BTU potential of annually harvested firewood only - is this not correct?
Wrong! The annually harvest firewood plus all other forest products only gives 1/40= 2.5% replacement of petroleum.
The Billion Ton Study, which includes crops with lots of fertilizer as well as firewood and other forest products, is what gives the 20%.
As far as I can tell, El is being deliberately obstinate.
Oh really?
Here is Gail’s calculation: 1.3 billion x 2000 x 6,400 BTUs, or 16.64 quads of energy gained from which she subtracts 50% for the energy required to make cellulosic ethanol - leaving us with 8 quads or 20% of US petroleum usage.
Question 1: Why are we assuming that all biomass in the 1.3 billion tons has a BTU/weight content of 6,400/pound when switchgrass for example, has a typical 7000 BTUs/pound content ratio and hemp is 5000-8000 BTUs/pound?
Hawaii’s Strategic Industrial Hemp Initiative http://www.capitol.hawaii.gov/session1999/bills/hb32_.htm ?
Question 2: What kind of cellulosic ethanol loses 50% of its energy value producing it?
The 50% estimate I used of the amount of energy that is lost is low, according to this slide from an ADM presentation based on an Argonne analysis. It is actually 55% of the energy that is lost, based on this slide, so the effiency is 45%.
The reason for the large loss, according to Mr. Pacheco from ADM, is that the energy from the biomass is used in the various processes, so that oil and gas don't need to be used. I am not sure if biomass is burned for the transporting of the biomass to the ethanol plant--that would seem to be one of the major energy costs. The large portion of biomass that is burned is how one gets the huge EROEI's for cellulosic ethanol--the calculation ignores all of the burning of the biomass itself. If the biomass is wood that has other uses, the assumption is questionable.
I don't know how closely one can fine tune the calculation. I think most people think the 1.3 billion tons of biomass is a stretch. There is no reasonable way we will get that amount, especially if homeowners expect to have some wood to burn, and utilities plan to burn wood and switchgrass for electricity. The ranges you give for switchgrass and hemp aren't all that different from what I am using.
Why don't you choose whatever value you like for the BTU's per pound, apply the 45% efficiency ratio, and choose a reasonable amount for the total amount of biomass. I would be surprised if your result comes up with much more than 20% x 40 quads = 8 quads.
Gail, thanks very much for this presentation. I am intrigued by your statement under Myth #1: "OPEC could produce more if it used current techniques." You state that the national oil corporations use the same third-party oil service companies that the internationals do.
I have heard Matt Simmons say the same thing, and I believe both of you. The problem is that as oil production and availability remain stagnant or decline, and as prices continue to rise, a lot of established businesses in the OECD are cranking out propaganda blaming the situation on inadequate investment by "backward" NOC's who are supposed to lack technical expertise. This is part of a campaign to pressure the NOC's to allow IOC's to develop the fields of Third World countries on terms favorable to the IOC's (most of the profits go to the IOC's and to Western banks, field ownership rights belong to the IOC's, the majority of the people in these countries get nothing, etc.)
Is there a way to find out how much money each NOC is spending on investment, as well as finding out who the clients of the largest third-party companies are, and the quantities of rigs, etc., supplied by the third-party companies to these clients? Or to put it in a slightly less wordy form, is there a quantifiable, verifiable way to refute the "inadequate investment" propaganda? Thanks again.
Thanks Gail for your response on why peak oil is of interest to you. I also think its probably one of the most important issues we face today.
Just to let some folks know, I'm studying Surveying Engineering here at New Mexico State. I actually just got back from a physics lab(tough). Yes its summer school. On my way to class I blew out my front tire on my bike!! Anyway, some classmates stopped by last night and I asked them about peak oil. They had never heard of such a thing? These kids can integrate and solve derivatives like nobody's business, but yet aren't aware of the energy crisis that is on the horizon. It just seems like its business as usual on campus, people just doing they're thing. What will it take for people to become aware of this energy issue if places of higher education aren't really even acknowledging it?
~byron Calkins
Well after seeing a fellow NMSU student join TOD I thought it was about time I stopped procrastinating and sign-up. I'm majoring in History.
It's always fun to direct people to TOD at work, and then see their gloomy (concerned?) faces the next day.
I'm anticipating that my in progress 305 to 406ci engine swap isn't going to be as much fun as I thought it would be come higher prices.
Don't forget to digg it by the way.
Byron,
I am not sure I know what will make more people peak oil aware. It is possible that peak oil could have a lot of indirect impacts (financial crash), and people will not figure out for years what the real underlying problems are. They may blame problems on the banking system and our balance of payments problems. These are also contributors to our problems, but not the only ones.
If I could impose on everyone, would anyone be willing to take a crack at my original question? Gail made a very good point under "Myth #1" of her post. "Myth #1" is as follows: "OPEC could produce more if it used current techniques." She refuted this myth by pointing out that the national oil corporations use the same third-party oil service companies that the internationals do.
But that as oil production and availability remain stagnant or decline, and as prices continue to rise, a lot of established businesses in the OECD are cranking out propaganda blaming the situation on inadequate investment by "backward" NOC's who are supposed to lack technical expertise. I believe that this is part of a campaign to pressure the NOC's to allow IOC's to develop the fields of Third World countries on terms favorable to the IOC's (most of the profits go to the IOC's and to Western banks, field ownership rights belong to the IOC's, the majority of the people in these countries get nothing, etc.)
Is there a quantifiable, verifiable way to refute the "inadequate investment/lack of expertise" propaganda? If people have access to sources of information but don't have time to write an article, I can put an article myself, as long as you feed me the right information. The problem is that I don't know where to look, apart from perusing the websites of some of the third party oil companies. Again, thanks.
Regarding use of third party service companies, I was pretty much following what Matt Simmons is saying.
I really haven't studied what the National Oil Companies produce in the way of reports. Since they are not US companies, they don't file 10-K reports. I would imagine they could include whatever they want. This is a link to Saudi Aramco's 2007 Annual Review. It gives a variety of numbers, but nothing on the amount invested in developing fields. Saudi Aramco does give some numbers in press releases, but I can't imagine it is easy to tell how much is spent one year, and how much the next from the press releases (and also if the numbers in the press release are really correct). So my conclusion is probably we can't tell how much the NOCs are investing each year.
Thanks, Gail! I'll keep looking on my own; if I find anything, I will post it on TOD. Again, I really enjoyed your work. One other question...were you serious in your comment about the meaning of TOD in German? Sometimes dry humor goes over my head...
Yes. Check it out in Google translate. TOD Europe is the one that has an issue with this. We have heard stories about people not understanding that TOD is an acronym.
Gail - I think you're too quick to dismiss rail with "Population density is such that rail makes much less sense than in Europe or Japan, and in any event, would be hugely expensive to add now".
Ihe US relied on rail for most long-distance transport until the 1950s, when population density was lower than now. It still relies on rail for 40% of freight transport - a higher proportion than any European country. The rail alignments are still there, even where the track has been torn up. Suburban sprawl doesn't make rail unfeasible - electric cars or scooters can be used for short hops to and from the nearest rail station.
There are probably places where rail makes sense--just a lot less as a percentage than in Europe and Japan. Also, at this late date, it would be expensive and logistically difficult to add a huge amount of trains and some tracks at once.
I understand freight is a heavy user of rails. Rail lines are quite "full" now as a result. I believe that passengers and freight are using the same tracks, which is the reason there are a lot of delays for passenger service.
Gail
Your arguments against more rail transport in the US appear to be that: (1) there wouldn't be much demand (because of low population density etc). (2) there is so much demand that the existing rail network is overloaded.
Where the alignments already exist, it's not difficult to re-lay track, or to add elevated tracks for light passenger rail above existing tracks for heavy freight. Modern light rail systems can use driverless railcars moving independently on elevated tracks, keeping down the weight, the track cost and the labor cost of an on-demand service. Cybertran is an example of this concept.
Thank-you very much indeed Gail for a very readable and understandable presentation that should do much to get the story out there. This is my first post on The Oil Drum, so pleas go easy on me.
Although I understand and almost completely agree with everything that Gail has presented, I would like to suggest that there is some reasonable hope that Canadian Oil Sand production will be indeed be able to ramp up somewhat faster than is expected (although the central thesis of the presentation would not be challenged by this - it still means that Canadian oil exports may be able to continue to grow even as their conventional oil declines and their internal usage increases). This is due to several factors:
1) The current and past use of Natural Gas as the main fuel to extract the Oil Sands is being challenged for the future by the use of alternative fuels such as Petroleum Coke and Asphaltenes
2) There are technologies available that will greatly facilitate the use of those fuels (e.g. Direct Contact Steam Generation-DCSG) AND that will enable a reduction in the overall amount of energy needed to extract the bitumen (which is processed to produce high quality oil)
3) The main reason that those technologies have been underutilized (or not used at all) is not primarily due to the lack of utility of those technologies but more that the existing technologies were "good enough" (at least in the past)
4) The re-injection of Carbon Dioxide into SAGD (Steam Assisted Gravity Drainage) wells has been shown to increase production rates (and total production from a given well) by 30-50%. These new technologies (e.g. DCSG) will also greatly assist with any effort to sequester the CO2 produced by the heating of this heavy oils/bitumen and expected (or feared) changes in Canadian law are driving a realization that change is needed (and providing much incentive to invest some of their windfall profits).
5) These technologies can be reasonably expected to increase the EROEI from current values of 3:1 to 4:1 to the 6:1 to 7:1 without a great disruption in the current practices while at the same time decreasing the environmental impact of the current SAGD methodology. Dirty water can be used to a greater extent with these new technologies, for example, and this will allow more recycling (and still lower energy costs)
Although I can already hear the responses of the many who are worried about CO2 production causing warming of the Earth's surface, and that these technologies would exacerbate this issue (taht is debatable). I would like to put on the skeptic's hat here and suggest that CO2 is not all bad (even if the heating of the Earth's surface by CO2 were true). For example, fertilized plant growth rates are approximately LINEAR with CO2 concentration in the atmosphere. There is already significant evidence that wild forest regrowth rates (as well as crop yields) have accelerated because the ~30% increase in CO2 in the atmosphere in the last 100 years. In addition, one of the MAJOR impacts of a warming climate is LONGER growing seasons in temperature climates, which again leads to higher agricultural productivity. Given the huge and growing need for food on the planet earth (especially if energy supplies become more limited), isn't it worthwhile to consider the POSITIVE aspects of increased CO2 in the atmosphere as well? For those of a historical bent, it should not be a surprise that higher surface temperatures are good for humanity. During the Medieval Warm Period when the Vikings farmed in Greenland (pretty tough to do that there now) and Northern England was a major grape growing region, the Northern hemisphere human population soared. If Medieval technology (circa 1000AD) gave humans the ability to increase their population when the Earth warmed (or at least the Northern Hemisphere), why couldn't 21st century humanity do at least as well? Certainly the opposite of warming (e.g. little Ice Age), is a big problem for humanity. There were major storms, major crop failures and major difficulties for Europeans and North Americans(and presumably others) during the little Ice Age (the Thames and the Hudson Rivers froze in winter, for example).
On a contrarian bent, it is certainly possible to argue that the current rise in CO2 in the atmosphere is NOT the cause of the current warming. There are plenty of good scientific studies by very reputable climate scientists to back these up, but I will only mention a few items here:
1) Greenhouse warming theory strongly supports the notion that temperatures should increase in the middle atmosphere in response to a greenhouse gas induced increase in temperature (not obverved, surface temperature increases only)
2) CO2 is NOT a strong greenhouse gas, Water is stronger (and more prevalent)
3) ALL of the infrared radiation (heat) that is being absorbed by the 8um line of CO2 (the only one that is not interfered with by water) is absorbed in about 30 feet. Increases in CO2 do not affect the conversion of this radiation to heat (it is all converted to heat anyway) but only the distance over which it is converted (and the distance is already VERY SMALL relative to the height of the atmosphere - there is no observed 8um infrared radiation reaching space from the earth's surface, for example)
4) The principal means by the which the Earth (and you) transfer heat is through evaporation and convection (cloud formation). You sweat when you are hot and your radiative cooling is VERY MINOR compared to it. Greenhouse gases only affect the small portion of radiative cooling from the Earth.
5) CO2 concentration increases in the atmosphere began to a significant degree about 30 years AFTER the Earth had already begun to heat up again after the little Ice Age (it cannot have been the reason for the change since it started afterwards)
6) CO2 concentrations have continued to increase significantly since 1998 (last big El Nino) but the Earth's temperature has NOT increased since - if CO2 is such a good greenhouse gas, then why hasn't it?
7) The Oceans (about 27,000 greater in mass than the atmosphere) contain about 35,000 gigatonnes of CO2 and they are in rough equilibrium with the ~700 gigatonnes of CO2 in the atmosphere. When the concentration of CO2 increases in the atmosphere due to burning Fossil Fuels, and since it takes about 800-900 years (on average) for the deep oceans to heat up (SO MUCH thermal inertia!!!), the ability of the oceans to absorb more CO2 will INCREASE (Charle's Law of gases). That means that as we increase our CO2 production on the earth and emit them into the atmosphere, the oceans will be relatively LOWER in concentration and the amount that will dissolve in the Ocean (principally in the North Atlantic) will increase (i.e. the "Carbon sink" will increase, and not the opposite)
8) There is HUGE potential for the atmosphere to increase its cooling rate as the earth heats up. The evaporation of water increases (more heat, more evaporation), which transports heat from the surface to the upper troposhere.
So on balance, I would say that Peak Oil is a MUCH bigger threat than Global Warming and CO2 increases to avoid food shortages should be a good trade-off.
Hope I haven't offended anybody, but I wanted to present another side of the story. Sorry that I haven't posted links (I will do that in the future).
Good Work from everybody on the Oil Drum - Impressive web-site!!
Ian
You had better be prepared for a rough welcome by many at TOD, as some here seem to think it irreligious to hold a different view or question anthropogenic global warming in any way.
Before the shouting starts, welcome.
Can we assume that you have some expert knowledge of the extraction methods for oil sands?
What do you think of proposals to use microwave technology for it?
http://alfin2300.blogspot.com/2008/01/peak-oil-meet-raytheon-oil-shale.html
Al Fin Energy: Peak Oil: Meet the Raytheon Oil Shale Microwave
Thank-you Dave, it is a relief to be welcomed instead of laughed at,
I have had some exposure to the various new methods of extraction from the Oil Sands but I am not a real expert, so please take my comments with a grain of salt. If a real expert read this, he/she might laugh. Anyway, as I understand it, microwave technology has some advantages including directionality. However, the big disadvantage is that microwave emitters are very inefficient. I.e. most of their energy is radiated as regular heat (not Electromagnetic Radiation). So it is not that much different than a resistive heater in a well (which may be a very good solution to reach the deeper oil sands). A combination of microwave and other methods (including water injection) has some significant advantages as well.
The REAL problem in the Alberta oil sands is water availability (and water recycling) and the huge upfront capital costs which currently mean very long lead times for production. HOWEVER, the newer technologies truly promise to address both of these critical issues (as well as reducing the cost of carbon dioxide sequestration). The reason that this is so, is that the current "boiler technology" in use for SAGD ("once through steam generators" OTSG), although extremely efficient in terms of a boiler technology is essentially the same technology that powered steam trains across the world in the 19th century. Oil companies tend to be VERY conservative in using new technology. Most firms don't have significant R+D departments. Fortunately, the current economic and political climate is forcing them to get serious about new technologies and they CERTAINLY have the money!
One of these "new" technologies is "Wet Combustion" (has been around in some form since WWII) and injection of the wet combustion gases into the oil sands (instead of pure steam). Pure steam is the product of the OTSGs and is very efficient at transferring heat from above-ground to the underground oil sand formations requiring heat to mobilize the bitumen. The advantage about wet combustion is that the combustors are extremely small per unit heat output AND they do not lose efficiency with size. This is a HUGE advantage. For example, the combustion chamber in a OTSG is typically 10-100X greater in volume per unit heat output compared to a high pressure oxygen-fired wet combustor (new technology development still needed there!). The combustion chamber in an OTSG is pretty close to atmospheric pressure and air, with 78% nitrogen, is used for the combustion (for good reason). All of the water of combustion (hydrogen forms water when it burns in air), is wasted along with all of the carbon dioxide which is vented to the atmosphere. On the contrary, when a wet combustor is used (water is injected into the combustion chamber), the amount of fuel that can be burned is limited mainly by the amount of oxygen that can be injected into the chamber and higher pressures produce a linear increase in the amount of oxygen. If pure O2 is used the amount of fuel is increased by about 4.5 X further. If, for example, we consider the case of a 10atmosphere pressure (147 psi), combustor, that would mean that the combustor volume would be 4.5 X 10 = 45 TIMES smaller (at least) than a comparable OTSG without a loss in efficiency. This is an incredible improvement, and as long as you are using water to cool the combustion process (can't burn up the steel surround the combustor!), there is enough cooling to do the trick as water is the best coolant around. What this means is that a wet combustor can be made very small and very portable (and built OFF-site) and moved around when the job is done. Conservative estimates of capital cost improvements are on the order of 3-5 times lower. The time to install such combustors should be commensurate with the capital cost reductions. Also, water injected into the combustion chamber can be filled with hydrocarbons of any sort and they will tend to burn well. The combustion conditions in a high pressure oxy-fired wet combustor are conducive to burning almost anything (at high temperature, water dissociates and become s a powerful oxidizer). So at least some of the water treatment problems are addressed.
A LARGE CAVEAT though, this technology is still experimental and needs development. Research and development of all kinds of new technologies for the Oil Sands have been sadly neglected until recently (fortunately that is changing!). SO, on balance I am hopeful that the Alberta Oil Sands extraction rates will accelerate in response to Peak Oil. I am not hopeful that it will be enough to compensate for the decline in conventional oil. It should mean that Canada continues to be increase its oil exports for the foreseeable future. There are at least 1 trillion barrels of bitumen in the oil sands, and I haven't even talked about H2S ("acid gas") which has some very promising possibilities.
Good luck to us all!
Thanks for your comments, which seem at least informed, if not expert!
Any further insights on the use of nuclear CANDU reactors, or possibly Hyperion nuclear batteries?
Thanks!
Thanks Dave,
I have a lot less information on Candu reactors, but what I do know is very positive. ALthough they are an old design, the basic fact that they used a more efficient moderator (heavy water) instead of light water means that they can be "tuned" to be a lot less neutron intensive and still produce efficient conversion of Uranium. Although they are many benefits that spring from this basic fact, one of the most important is that they "fail off". That means if the coolant (heavy water) drains from the reactor, the neutron flux is not moderated ("slowed down") enough to keep the reaction self-sustaining and the reaction slows dramatically. One of the drawbacks is that neutron radiation on heavy water causes a small amount of tritium to be produced(a proton and TWO neutrons to form a radioactive hydrogen atom). That tritium is very dangerous because of its 11 year (intermediate) half-life and the activity of a hydrogen isotope in the body (e.g. tritiated water). So when there is a leak from a Candu the tritium that can be released is dangerous. However, to place that danger in perspective, there are orders of magnitude MORE radiation released from a coal-fired plant (e.g. uranium, radium, radon, thorium, etc.) than even the most poorly managed Candu. I do believe that EROEI numbers on nuclear power plants (ie. ~100:1) that I read here on the Oil Drum recently. The amount of energy released by a few grams of Uranium is staggering and equals tonnes of coal. Also, I do believe the numbers on the amount of Uranium in the Earth's crust (i.e. plenty). I spent a summer prospecting for Uranium in the Canadian Arctic (there was a lot of it!) and you don't have to go to the Arctic circle to find it. I truly believe that Nuclear Fission plants are a good source of energy for the foreseeable future. Do enough of us have the foresight to foresee this though?? Tough question.
Ian
Hi Ian - thanks!
However, I was really asking you about their specific use in producing oil from the oil sands.
I don't know if you have come across the nuclear battery idea in this application, but here is some info:
http://nextbigfuture.com/2008/05/hyperion-uranium-hydride-nuclear.html
The CANDU reactor can also burn thorium, I believe, which is a nice trick!
Hi Again Dave,
The problem of the use of a Nuclear Reactor to produce steam is the same as the current very large boilers (OTSGs) but even worse. The amount of heat required for a given SAGD well is about 1.3 GJ/bbl (SOR = "Steam to Oil Ratio" = 3.0). The amount of heat produced by even the smallest CANDU reactor would be enough for hundreds or even thousands of wells. That might SOUND good, but here is the problem: the insulated steam pipes for high pressure, high temperature steam (about ~4Mpa, 600psi, 300C) which is required to stimulate the bitumen to move below ground, are about 30 inches across and they CURRENTLY average about 3miles+ from the OTSGs to the wells. They lose a lot of heat in the winter (especially). If you have a CANDU, your steam pipes would have to be MUCH longer (can't say how long because it would depend on where you built it). ALSO, SAGD wells typically deplete much faster than a "normal" oil well (3-7 years). That means that you have to lay new pipes and rip out the old ones (as well as losing all that heat through the long pipes). Then what do you do with the Candu when the wells are done?
There is ANOTHER, even more serious problem for a CANDU (or any nuclear reactor) for Alberta. Alberta's OIl sands are in an area with very low rainfall. It would be a desert if it wasn't so cold. Nuclear reactors need tremendous amounts of cooling water. Most of the reactors in Canada are on large lakes (e.g. Lake Huron or Lake Ontario) or big Rivers. The biggest river in the Athabaska region is aptly named the Athabaska and current Oil Sand plans already call for the maximum withdrawal from the river of 10% within 5-10 years. By that time, there will be even more environmental pressure on the river (and the residents are already upset - with reason). So there is really not enough WATER for a nuclear reactor in that region.
So, NO, I don't think that a Nuclear reactor is the answer for heat in the Oil Sands (although it is great source for electricity where water is plentiful- like the Great Lakes). I think we should be going MUCH smaller (wet combustion) and more modular/portable (to reduce the capital and transition costs). Nexen/Opti at Long Lake is already producing natural gas from their coke through the "water shift" reaction, so it is certainly possible to use the existing fuels in more novel ways. In my (probably pretty biased) view, the "small is beautiful" model is the way to go. I will check out the Hyperion model tomorrow.
Ian
Hi Ian,
Your arguments about scale and location sound well-founded.
I had assumed that the plan would be not to transport steam, efficient though that would be, but to use the electricity to generate steam on site at the location.
I believe it is possible to use dry cooling for a nuclear reactor, although I don;t know the specifics for the CANDU.
At any rate in the winter the temperature difference should make it rather efficient!
Mo0re practically, I understand that in areas where water is a problem the design can be optimised to minimise water use and carry out a lot of recycling.
Thanks for your insights. My understanding is that technology used in Canada on the oil sands hasn't changed a huge amount since the 1930's. This is a big part of the problem with continued low production.
It will be interesting to see how all of this new technology works out. From the US point of view, it is still imported oil, and we still have a balance of payments problem, regardless of who we are buying it from. If it really does ramp up, I can see a possibility that China will prove to be the ultimate buyer of the output, rather than the US, if our financial problems get out of hand.
It's actually changed enormously.
For a start, there doesn't seem to have been any commercial oil sands production until 1967, so pretty much by definition it's all much more recent than 1930s technology.
In situ techniques are even newer; SAGD was first tested in 1980, and wasn't used with horizontal wells until about 1990. VAPEX seems to have been developed in about 2003. THAI, of course, is still under development, and all of the techniques - even surface mining - are undergoing continual refinement.
Oil sands development isn't slow because of old technology; it's slow because it's difficult and capital-intensive work located far away from existing major infrastructure, and because it only became commercially exciting a few years ago after oil prices started to rise.
Thanks!
Thanks for your comments. See my thoughts above on the Canadian oil sands. It may be that you are right, when things work out. I can see that there are improved methodologies, but also pressures because of all of the pollution.
I agree that peak oil is a bigger issue than climate change, even though there are many readers who would disagree. If climate change is caused by CO2 and is as bad a problem as James Hansen and others are saying, it looks like it is really too late to do anything, anyhow. There is really no chance that we will get back to 1980 C02 levels in any reasonable time frame, regardless of what we may attempt. If we are trying to stop the melting of the Arctic, it is clearly too late, regardless of what we do.
If Hansen's theory is wrong, and climate change is happening but caused by other factors, then the concern about CO2 is misplaced. I increasingly believe the latter may be the case. Regardless of which it is the case, it doesn't make sense to make huge unilateral changes to reduce CO2, when China and others are not doing the same.
Odd way of twisting Hansen's explicit message: that now is precisely when it's not too late to do anything. Nor is he advocating we get back to 1980 CO2 levels. What he's asking is that we work towards a plateau, where CO2 levels still go up some from today, but then level off rather than keep rising forever. He doesn't regard oil consumption as being critical in that, since we'll burn the rest of the readily-available oil no matter what - and precisely how many years we take to do that doesn't matter much to the climate. His main concern is that we stop ramping up coal consumption until we have working sequestration.
If I understand Gail's comment, she's right about Hansen. Since the last IPCC report, the situation has gotten worse and he now advocates backing down to 350ppm (from the current 382 or so). In his recent Senate testimony, he urged that ALL coal burning cease now to deal with a world emergency. Google: Hansen + 350.
The 350 ppm is my understanding of what he is looking at now. I can't see any way all coal burning will stop, in the US or China or most anywhere else. We would lose half of our electric power, and China would lose 70% of its electric power. I think we are kidding ourselves to think that changes of this magnitude can voluntarily be made. If we were talking about a 450 target, then I think there might be a chance.
Gail, impressive as always. And you must be doing something right since first time posters seem to be popping up everywhere.
First of all, A BIG WARM WELCOME to newcomers Byron Calkins, Hegemony and iwylie. Enjoyed reading each of your insights. TOD is a site that tends to draw critical thinkers ... the supply of which, IMHO, reached a peak a few years ago. However, you've renewed my confidence in the renewability of this resource.
BTW, contrary and differing viewpoints can and sometimes do receive very warm (as in hot, ouch!!) responses from other readers. When this happens to you, don't be discouraged! The broad range of thoughtful and intelligent opinion and know-how is what makes this site worthwhile checking everyday. We all learn from one another.
Keep thinking and contributing.
Good to see some young-blooded students joining the fray as well. We've got to get to this demographic if we hope to get anywhere in the future. Welcome and spread the word.
That does not appear to be the case.There's a New Scientist article that discusses that, starting with:
"According to some accounts, the rise in carbon dioxide will usher in a new golden age where food production will be higher than ever before and most plants and animals will thrive as never before. If it sounds too good to be true, that's because it is."
Unfortunately, that's not a valid argument.
Evaporation is the main means by which heat is transferred from the ground, but radiative heat is the only way in which heat is transferred from the planet.
Evaporation and convection keeps the heat in the atmosphere, which is what we're concerned about the temperature of in the first place.
Unfortunately, that's an example of the False Dilemma Fallacy. You're suggesting that CO2 should either always or never cause the earth to warm, but that's falsely reducing the situation two only two of many choices.
As usual, of course, the situation is more complex than that. CO2 levels are believed to be one of many influences on the day-to-day and year-to-year temperatures, but one which has a constant direction (up), unlike the other factors, which tend to be cycles (e.g., el nino). Temperature will fluctuate, but on average increase over time.
Think of it this way: it's possible for 4am in July to be colder than 4pm in April, but that doesn't mean temperature doesn't increase on average between April and July.
It's a very slow equilibrium, though, in part because large bodies of water mix very poorly. If the atmospheric CO2 concentration increases quickly, the oceanic concentration will not keep up:
"The ocean absorbs CO2 from the atmosphere in an attempt to reach equilibrium by direct air-to-sea exchange. This process takes place at an extremely low rate, measured in hundreds to thousands of years."
Of course, it's not necessarily a good idea for oceanic CO2 concentrations to go too high, as that leads to ocean acidification.
An old friend is a climatologist, and he feels exactly the opposite.
(For what that's worth; it's entirely reasonable to examine the different evidence available to you and to come to a different conclusion. It's usually worth strongly considering the views of the experts in the field, though.)
Pitt,
Thank-you for your thoughtful responses. I did want to reflect on little on your comments and give some feedback. You didn't mention whether or not you felt that the positive effects of increased CO2 and a warmer climate were real or not. In response to your points:
1) The first point about the Oceans is probably a good point to start:
*************
The Oceans (about 27,000 greater in mass than the atmosphere) contain about 35,000 gigatonnes of CO2 and they are in rough equilibrium with the ~700 gigatonnes of CO2 in the atmosphere.
It's a very slow equilibrium, though, in part because large bodies of water mix very poorly. If the atmospheric CO2 concentration increases quickly, the oceanic concentration will not keep up:
"The ocean absorbs CO2 from the atmosphere in an attempt to reach equilibrium by direct air-to-sea exchange. This process takes place at an extremely low rate, measured in hundreds to thousands of years." ***************
You have actually (IMO), supported my point. I was trying to explain that the Ocean "carbon sink" would not be saturated any time soon. The fact that the exchange is slow supports that. We have heard many apocalyptic warnings that the rate of the carbon sink from the atmosphere would "saturate" as the concentration of the CO2 rose. I argued the opposite above. The reason is that the atmosphere will increase in concentration faster than the Oceans (obvious because CO2 exchange is slow and CO2 increases in the atmosphere are essentially immediate). That means that the CO2 concentration in the atmosphere will increase relative to the Oceans over time. That means that the concentration differential which drives Charles' Law will increase (more CO2 in the atmosphere relative to the Oceans). That means that the driving force for dissolution will also increase and hence the rate will also increase. CERTAINLY, it would be tough to argue that the rate of dissolution would decrease (lower carbon sink).
The other point is that carbon dioxide is a major component in photosynthesis (CO2 ==> O2). As the CO2 concentration in the Ocean rises, the rate of photosynthesis there has the potential to increase as well (as long as there are sufficient other nutrients). I believe that this is the basis for the rather "dramatic proposal" to increase CO2 absorption through seeding the Antarctic Oceans with dissolved iron.
2) The 2nd comment that I will make concerns the article that you referred to about the increase in CO2 causing plant (and especially crop) growth rates to increase. That New Scientist article has many comments confirming my assertion that CO2 can fertilize plant growth rates, e.g.:
*******************(from your cited New Scientist article):
"These experiments suggest that higher CO2 levels could boost the yields of non-C4 crops by around 13 per cent."
*********************
The article talks about the uncertainty in these numbers because of local temperature variations, water availability, and the type of plant, etc. Of course, that is also true. However, it does not subtract from my point. Plants need CO2 to grow and it can be the limiting factor where nitrogen and water are abundant (and for the right plants), e.g. intensive farming. We KNOW which types of plants those are and we can plan accordingly and we already fertilize with nitrogen (abundantly). Also, the deleterious temperature increases that the article refers to are primarily in the tropics. The tropics are not warming as much as the poles (for good reason). In temperate climates temperature increases lengthen the growing season. There are many areas in Canada and Russia (and even the Northern US, e.g. Minnesota) where lengthening the growing season will increase crop yields (or allow agriculture to start with). If increases in CO2 are taken into account as well as fertilizers, our crop growth rate could be increased. Surely, if we take this into account in our farming practices we can take advantage of this "free fertilization"? If you say that we cannot plan for it, I have to ask you why we couldn't?
3) 3rd point on heat transfer:
*****************************************
The principal means by the which the Earth (and you) transfer heat is through evaporation and convection (cloud formation). You sweat when you are hot and your radiative cooling is VERY MINOR compared to it. Greenhouse gases only affect the small portion of radiative cooling from the Earth.
Unfortunately, that's not a valid argument.
Evaporation is the main means by which heat is transferred from the ground, but radiative heat is the only way in which heat is transferred from the planet.
Evaporation and convection keeps the heat in the atmosphere, which is what we're concerned about the temperature of in the first place.
************************
Global Statospheric temperatures are NOT increasing. (see, for example:
http://spacescience.spaceref.com/newhome/essd/essd_strat_temp.htm
All of the observed temperature increases have occurred at the SURFACE (near the ground). As you say in your comment:
"Evaporation is the main means by which heat is transferred from the ground"
That is exactly my point. It is exactly where the temperature changes have occurred where RADIATIVE effects are very very minor (as you have suggested and I agree). In the Stratosphere, the temperature is not increasing. That is where radiative effects would be significant. If anthropogenic greenhouse warming by CO2 is the main driver for increases in temperature, then why has the stratosphere NOT warmed (where radiative effects would be more significant) while the surface HAS warmed (where radiative effective are swamped by evaporative cooling)???
Surely, that is at least suggestive that something else is going on. Perhaps cloud formation driven by cosmic ray flux decreases? (although not yet proven, it is worthwhile considering the possibility, e.g.
http://news.bbc.co.uk/1/hi/sci/tech/3036032.stm)
4) I will make two more points (combined below). Even if CO2 is the main driver for Global Warming and not the sun for example, then any radiative effects by CO2 have to be logarthmic in nature (at worst). All absorption by electromagnetic radiation (when not already saturated) is governed by the Beer-Lambert Law of absorption:
http://en.wikipedia.org/wiki/Beer-Lambert_law
It is a logarithmic equation which means that the concentration of the absorber must increase by a factor of ten for an increase in absorption by a factor of two. Since the total increase in CO2 since the beginning of the Oil Age (and coal) is about 30-35% (log 1.35 = +13%) - and there are limits to the amount of extra oil that can be burned (Peak Oil and perhaps Peak Coal), it is debatable if there is enough carbon-containing fuel to be burned economically to double the concentration of CO2. However, even if there was, the amount of increased absorption would (at worst) be increased by the log of 2.0, which is 30% (assuming that the absorption lines for CO2 were not already saturated - but they are!!). Since MOST of the observed Greenhouse effect in the atmosphere is caused by water (with good reason, lots of water vapor and it is a great microwave absorber as you may observe when you place food in your microwave), the extra effect of the extra absorption from CO2 will be small. If we assume that the contribution to the current ~30 deg. C greenhouse effect on the Earth were 5% (see article below), then the TOTAL CO2 induced greenhouse effect is 1.5 deg. C. If we increase the effect of CO2 by 13% (13% of 1.5 degC = ~0.2 deg.). If DOUBLE the CO2 concentration, then the maximum effect of CO2 is 30% (logarithmic effect) of 1.5 deg. C, which is 0.45 deg.C. The understanding of exponential functions is not an intuitive human faculty (as has been stated here before). People intuitively think linearly. It is just not the Physics to suggest that CO2 increases can drive linear (or even worse) effects in temperature. Finally, it is worth restating that the CO2 absorption is ALREADY SATURATED. All of the IR radiation at the CO2 absorption lines is already being absorbed!! How can increases to CO2 level change this? It cannot be logical to conclude that increases to "radiative forcing" can occur in absorption lines that are already saturated (ie. ALL of IR radiation at those wavelengths is already being absorbed).
There is a discussion of this and the fact that water is dominant greenhouse gas (by a large margin) at the following web-sites:
http://www.geocraft.com/WVFossils/greenhouse_data.html
http://nov55.com/ntyg.html
Hopefully, this will contribute in some small positive manner to a further reasoned discussion about the relative difficulties that we face as a species going forward (Peak Oil vs. GHG). As a Canadian, I know that energy is critical for survival, especially in winter, (as it is for everyone) and we are a tropical species.
May reason and moderation prevail.
iwylie,
Thanks for your several posts, both on nuclear and climate change. You seem to have quite a bit to contribute!
It doesn't, actually. The problem is with the slow mixing rate of water.
Functionally speaking, only the upper layer of the ocean is able to absorb CO2, as the mixing rate and CO2 transfer rate between the upper and lower layers is so slow. That, as I understand it, is the reason the ocean offers much less of a CO2 buffer than its volume would suggest.
I can't find any good intro links at the moment, but one thing I know about that can give you an idea is salt fingers, which play a big role in redistributing salt through the ocean.
My understanding is that the other nutrients are the limiting factor in almost all cases, meaning more dissolved CO2 would make very little difference. One indication that's correct is the iron-seeding proposal you mention - if iron wasn't a serious limiting factor, adding more wouldn't change the situation.
This is particularly true in temperate and tropical oceans, by the way. I'm told (oceanographer friend) that tropical water is so clear because it's so lifeless. Northern water is much murkier because it sees more storms, and hence sees more mixing, has more nutrients dredged up from below, and hence has more things living in it.
It's basically back to the same problem of how ridiculously poorly large bodies of water mix.
No, I agree with you that, since higher temperature and higher CO2 has different effects on different crops, we have some flexibility to change crops to optimize output based on the changing situation. I'm just arguing - as the New Scientist article does - that higher CO2 is not going to lead to a large increase in agricultural output overall.
I recall reading a major analysis that argued the current projections for climate change would be a modest net negative for agricultural output, although with some areas seeing greater productivity (Canada and Russia were mentioned in particular). I don't know how they took into account switching crops (which is conditional on other factors as well), and I suspect it may be possible to make some improvements to crops by selective breeding/GM, but it seems fairly unlikely that the currently-expected climate change effects would result in any kind of significant net increase to agricultural production.
There appears to have been significant warming in the first 5 miles of the atmosphere:
"Recent analyses of temperature trends in the lower and mid- troposphere (between about 2,500 and 26,000 ft.) using both satellite and radiosonde (weather balloon) data show warming rates that are similar to those observed for surface air temperatures."
That's a good question, and it turns out the answer is quite interesting, at least to me (I didn't know, and had to look it up).
This is a blog post regarding a somewhat similar question, and it basically comes down to:
"What happens in the stratosphere is that at very low temperatures, CO2 emits more radiation than it absorbs, leading to a negative radiative forcing, and to reach equilibrium, the stratosphere must cool."
This is exactly what we've seen - the NASA dataset you linked shows stratospheric cooling, while the dataset I mentioned above shows surface and tropospheric warming. This is also what the climate change models have predicted for decades; take, for example, this paper from 1988:
"According to the greenhouse theory of climate change, the climate system will be restored to equilibrium by a warming of the surfacetroposphere system and a cooling of the stratosphere."
Perhaps counterintuitive, but I long ago learned to accept that intuition is imperfect when it comes to complex science.
Yes; however, that doesn't take into account feedback effects. The blog post I mention above quotes from the IPCC's reports on this:
"for a full understanding of the greenhouse effect and of its impact on the climate system, dynamical feedbacks and energy transfer processes should also be taken into account."
Taking those into account apparently raises the size of the effect by a factor of 3-4, meaning any purely radiative analysis of the situation will miss most of the effect.
Pitt - I tend to agree entirely with this statement. The main problem is that the IPCC do not. In their 2007 Summary for Policy makers they attribute net +1.6 Mw-2 to Anthropogenic factors, dominated by CO2 and a mere 0.12 Mw-2 to natural forces. The only natural force they consider is solar irradiance (Fig SPM2, p4).
The IPCC model the ENSO cycle as internal to the climate - maybe fair enough. But they fail to take into account the PDO and NAO cycles, the solar system cycles responsible for sunspot activity, and orbital effects (that extend beyond simplistic irradiance variations) such as dust in the solar system that may reflect the incidence of irradiation at upon Earth.
So I agree that the direction of CO2 is up. The question is with the warming recorded from 1980 to 1998, how much of that is due to CO2 and how much due to other natural factors - which may now have switched into reverse, over riding the CO2 forcing, and sending temperatures down.
We likely "run out of more carbon to burn" before 2020.
I'm not sure how that disagrees with what I said. (Which, don't get me wrong, is entirely possible - I have a fairly rudimentary understanding of climatology.)
Any cyclic factor would tend to have a zero net effect; only non-random effects which are either not cyclic or whose period is relatively large compared to the duration of the dataset should be expected to have any significant net effect.
It's a good question, and one I don't personally know the answer to.
What I do know, though, is it's almost impossible that that question hasn't been extensively considered by climatologists. A friend of mine working in atmospheric science right now used to work in oceanography modelling the Pacific, so I'm quite sure that cycles such as the PDO and NAO are not unknown to the climatology community.
Accordingly, I trust that they're doing a sensible job taking those factors into account. That trust might be misplaced, but it's the way the evidence appears to point, and it would be very unusual if literally thousands of scientists had so badly failed in their scientific duties, all at the same time, all in the same way, all under heavy scrutiny. Not impossible, but significantly unlikely, at least in my experience.
They undoubtedly have. It is still darn difficult to come up with any decent models though.
Climate mow appears to be subject to abrupt change, tipping points the triggers for which are obscure, which can lead to dramatically different climates within a period of as little as 3 years.
This is rather similar to the situation which confronted biologists when they accepted punctuated equilibrium, rather than the old, comfy world of evolution ticking away at a constant rate in the backgroud.
Prediction became almost impossibly difficult.
Perhaps Teleb's strictures in 'Black Swan' are also relevant, as modelling tends to rely on gaussian distributions, and sharp step changes are outside of most modelling possibilities.
That does not mean that I discount climate change, anthropogenic and otherwise, but the real mystery seems to be why the climate has been so stable for the last 10,000 years, not why it might change.
Even under relatively stable climate conditions a shrug of its shoulders was enough to do for The Old Kingdom in Egypt, with a 200 year drought.
Ian, welcome to TOD. You're clearly not new to either energy and climate debates - surprising it has taken you so long to find us.
You're using some jargon here I'm not entirely familiar with:
What exactly are you talking about here? Asphaltenes = tar which is what you are trying to upgrade to syncrude. Is this some perpetual motion machine. Or toe - heel combustion system?
Normally a revolution or new catalyst is required to achieve this. So how does DCSG differ from SAGD?
So you're beginning to lose me here. You really think that CO2 injected into the shallow sub-surface will remain sequestered. But then later on you point out that CO2 in the atmosphere doesn't matter.
I've now lost the will to continue with this.
Euan
Declaration - I own stock in Encana and may consider selling Monday.
Euan,
THANK-YOU for your excellent questions! You are certainly paying attention, and there is nothing that I like more! Please forgive my obscurity in making those points in the first place. I rushed through them without sufficient explanation. The asphaltenes and petroleum coke are high sulfur fuels (usually more than 5%) that are considered (with good reason) to be "garbage fuels" and for many reasons are usually discarded (land-fill or big piles near the synthetic crude processing facilities). Conventional boilers (OTSGs) generate huge quantities of SOx gases (which are strong acids when they rain down later) when they burn such high sulfur fuels, because the fuel is turned directly into a gas and vented up the stack. In the "bad old days", there was (and probably still is) a HUGE nickel smelter in Sudbury Ontario Canada. It used to produce 1500 tonnes of SOx gas per day. Everything within a few hundred miles downwind was heavily acidified and most of the lakes died by acidification (sulphuric acid, battery acid, is a strong acid).
The big advantage about direct-contact steam generators (DCSGs) is that the exhaust gases (which can include large quantities of SOx) are FIRST filtered through water. The water can include limestone which reacts with sulphuric and sulphurous acids to form gypsum (calcium sulfate hydrate) and calcium sulfite hydrate. Not only does the limestone neutralize the SOx compounds but it also generates extra heat (reducing the need to burn as much fuel). So when the steam comes off the water the SOx has been neutralized by being filtered through the limestone containing water. There are several designs of DCSGs that optimize this process and I cannot go into the details here (not enough space, and I am bound by confidentiality).
The second big advantage of DCSGs refers to the ease with which CO2 is sequestered. As you can tell, I do not think that this is relevant for the climate (or for us). HOWEVER, the government and the customers think it is and since an advantage in carbon seqestration is a very salable feature of a technology (along with the other advantages), and I certainly do not make the laws of Canada (don't even influence them!), who am I not to take advantage of their decisions?? I guess that might be considered immoral. However, I would NEVER stand up and claim a climate advantage from this.
So how does DCSG help with carbon sequestration? It is actually reasonable simple. When the combustion (flue) gases from a regular OTSG get vented up the stack, they are SEPARATE from the pure steam that is injected into the well. Typical CO2 concentrations for OTSGs are on the order of 3 volume% (or 3% on a molar basis). That means that 97% of the flue gases are something else (e.g. Nitrogen, water vapor, oxygen, unburned fuel, etc.). Also the gases are coming out at essentially atmospheric pressure (0.1 MPa). In order to sequester the CO2, it must first be separated from the other gases (or you would have to spend a LOT of extra energy to compress ALL of the gases) and then you usually have to compress the CO2 up to the pressure necessary to push it down into a deep underground reservoir. Pressures are of the order of 4MPa or greater (40 times atmospheric pressure) to get it down a deep hole. The energy cost to compress a gas goes up as the SQUARE of the pressure ratio. You can see that IF the CO2 was already compressed the pressure ratio to get it down a hole would be much lower. That is the case for CO2 that is INJECTED with the other combustion gases and the hot steam. In a DCSG the combustion can occur under pressure (e.g. 2MPa or more) and this is necessary since the combustion gases are being injected down into a hole anyway (a hole with bitumen in it). So when the condensed steam and bitumen come out of the producer well (there are 2 wells in a SAGD arrangement), there is CO2 dissolved in the water under pressure. The separation of CO2 can take place partially because CO2 will come out of the water (go into the gas phase) as the water comes out of the well. The other BIG advantage (other than the relatively high concentration of the CO2 coming out) is that it is already under pressure. It would be easy to maintain the pressure of the CO2 at 1 MPa if it was injected at 2 MPa. That means that the relative pressure ratio to pressurize it again up to 4MPa is only 4 times (4MPa/1MPa) as compared to the OTSG case of 40 times. That means that the relative energy cost of pressuring the CO2 from a DCSG (in this example) is 100 TIMES less!!! (and that doesn't even count the cost of separating the CO2 in its very dilute form from normal OTSG flue gases).
You might ask the question, why does the pressurization of the flue gases for injection into a SAGD well come for "free" with a DCSG. That is a long complex story, but the simple answer has to do with high water content oxy-combustion that does not require compression of large amounts of surplus nitrogen (78% of air). Overall it is a good story, but it DOES require more development and also the manufacture and deployment of the new equipment. This will NOT happen in the short term. We would be lucky if we could deploy large numbers of such systems in 10 years. In the meantime, Peak Oil will be taking its toll.
You did ask one more question and it worthwhile answering it. You asked why a DCSG would reduce the amount of energy needed to extract bitumen. The first part of the answer is that the flue gases that are vented up the stack in an OTSG contain water vapor from the 'water of combustion' (any hydrogen content in a fuel can be turned into water during combustion). The theoretical energy content of a fuel is often stated in two ways: the lower heating value (LHV) and the higher heating value (HHV). When burning methane (most of natural gas is methane), the difference between the two is about 10%. That is the amount of heat that is required to vaporize the ~10% of the flue gas that is water. No OTSG combustion process ever considers recovering ANY of that heat because the water is already in the vapor form (and it is also diluted with all the nitrogen). HOWEVER, a DCSG injects nearly all of the combustion gases into the well ALONG WITH the water of combustion. After injection into the injector well that water vapor heats up the bitumen and condenses into water (along with the other water from the DCSG). So it is directly USED for the main job of water (steam) in a SAGD process. IN other words, the fuel used in a DCSG can be calculated on a HHV (instead of a LHV basis). With asphaltenes and petroleum coke this effect is less (less hydrogen), but it is still significant.
The other energy advantage of a DCSG process is that CO2 is injected directly into the well along with the steam. There have been repeated experiments that have shown ~30-40% increase in bitumen recovery for a given amount of heat used. That translates directly into that ratio of increase in the EROEI. So, if it was 4:1 with an OTSG, you would get 4:1 X 1.3 = 5.2:1 for a DCSG from CO2 alone. Using the HHV equation above, you get another about 10%. There is a further thermodynamic advantage from a DCSG, in that the concentrated contaminated water that is vented from an OTSG (called "blowdown") also carries heat with it. Again there is less of this lost in a DCSG. This explains SOME, but not all of the energy efficiency savings (higher EROEI) of DCSG over the current steam generators (OTSGs).
So overall, the promise of DCSG is better energy efficiency, easier sequestration of CO2 and use of poorer quality fuels (and easier water handling, but that is a LONG story) but at a development cost (and risk) that is not incurred through use of the existing OTSGs. If you owned a multi-billion Oil Sand company that was making more money than you could count, why would you risk it, unless you were forced to??
So I am hopeful for the medium to longer term in Canada (especially given the new proposed carbon laws) that these new technologies will allow ramp up of environmentally friendly extraction of bitumen, but in the short term, we better start giving conservation a serious look. I hope John McCain (or Barack Obama) is really serious about it and is not just mouthing "get elected rhetoric". There will be forced conservation by price as things progress. I am sure it is already happening in some places.
Of course, there are other possibilities for Canada, such a nuclear reactor providing electricity for compression, etc. (heard that here and I haven't thought it through yet), as there is just so much bitumen out there. I hope that we get really serious about new and effective technologies!
Ian
Very interesting, and very new information (at least to me). Thanks!
Thanks for the good summary. One thing I noticed was missing: Biodiesel.
I think this would make a good post sometime in the future, ethanol vs. biodiesel. Comparing various sources of each.
There isn't much biodiesel now. In the US, soy bean prices are already through the roof, as are all other bean prices. WIthout a mandate and major subsidies, it is difficult to see how biodiesel will go anywhere.
Great posting Gail.
One thing to amend would be for you to catch up with the technology being implemented in oil sands for both mining and in situ. For in situ production that will eventually extract 80% of the bitumen, you may wish to check out the site of www.opticanada.com.
Their process will revolutionise the extraction and processing (use little natural gas and recycle nonpotable water).
Keep up the good work.
Thanks for writing. I will have to look into it.
If in situ production at high percentages can be made to work in Canada, it seems likely that there are a number of other areas in the world where the same technology will work, including some places in California and Texas. You may remember I was involved with a post on the Toe to Heel Air Injection method in August 2007.
Gail,
In situ combustion (ISC) could be applicable. I've designed several such air injection projects in convention oil reservoirs in Texas. Actually, most in the oil industry are not too knowledgeable of ISC or that most of the best economical successes were in Texas and N. Louisiana. Compressing air is rather expensive and requires a significant fuel expense but many conventional projects appeared economical at $50/bo.
I think the primary problem with anticipating it's effect on ramping up tar sand production in the long term relates to the distribution of the tar in various portions of the field. I've read accounts that the current extractions are naturally focused in areas of high concentrations. The same reports say as much as 80% of the tar in place is in smaller and more dispersed reservoirs but there was no support to back up this claim.
Granted I offer a big IF, but if the lack of concentration in the tar sands inhibits recover (as is does in similarly limited convention oil reservoirs)even though ISC may be a practical and economic approach, it may not deliver volumes proportional to inplace reserves.
That's a good point.
I noticed in visiting Wamsutter with its tight gas installation, that they are very much into using 3-d seismic imaging to try to pinpoint where they should put their wells. The tight gas does not seem to be uniformly distributed either, and they end up with a huge number of wells, each targeting a productive pocket.
I don't know if this approach would work for tar sands. It certainly would add to the cost.
Thanks for the work Gail
Recommend clarifying your Myth #4: re:
"Requires huge amount of natural gas
In limited supply"
The technology is not limited to using natural gas. It is possible to use the bitumen itself to provide the heat. e.g. see Nexen's Long Lake project where they are using a gasifier.
http://www.longlake.ca/project/technology.asp
Might be better stated:
"Conventionally uses large amounts of natural gas.
Gasifying bitumen for heat needs more capital."
I think the other approach that is being considered is nuclear. It requires a lot more capital.
Maybe the solution is
"Conventionally uses large amounts of natural gas.
Other methods require more capital."
Gail - thanks for the updated presentation. I'm hoping to present some of the material to members of our church and possibly town officials if I can find the right group(s).
For me it has always been very powerful to see production per year curves for individual fields, countries, and the world curve. I would especially love to see the aggregate curve for all nations that have passed peak (can't find it now, it looks like http://www.theoildrum.com/uploads/28/TypeIII.png but with the most recent data).
The question that is then brought up is, "Are the remaining (11?) countries that haven't passed peak immune from the production curves that the other 50+ exhibit?" A rhetorical question for most here. :-)
This could go before the "World oil production has stalled" slide. Also, the "World oil production has stalled" slide would have more visual power by going back in time (1900?) and down near zero on the y axis - show the whole curve (giving up the detail of the past few years.
I believe that these four graphs - US lower 48 production, countries past peak, world discoveries and world production - tell the core of the story. We simply ask people to imagine where the world production graph is heading after seeing the other three graphs.
One other small note - people now are lumping in the OCS with ANWR so addressing that briefly might be useful.
Thanks again (and thanks to the people who signed up today and inspired me to do the same after a few months of reading the site).
Eric
Regarding the countries that have peaked, I haven't put together such a slide. Such a slide requires some judgment as to what to put where. I think that the slide you have is probably adequate for discussing the point with a church group. You will note that the total production is only a little over 40 million barrels a day, so an educated observer might point out that more than half (if you are looking at total liquids) is missing.
There are a few other quibbles one could make. China is not yet post peak. It is still increasing, even in the first quarter of 2008. Also, Canadian conventional crude oil production has peaked, but when you include oil sands production, it is increasing. If you take China and Canada out, the amount graphed is less than half of world production, even on a crude and condensate basis. One could now arguably add in Russia to the post-peak group, but this is still debatable, since we don't have a full year of decline, and the country is trying to increase its output.
I have preferred just to show some sample countries that are post peak, so that one can see both the ups and the downs of production, and the fact that enhanced oil recovery is not doing all that much.
I am working on an OCS post. Will probably mention ANWR also.
Gail, I don't have a link, but I recall a recent, more pessimistic EIA revision to its 2030 all liquids projection from 117 mb/d to 112 mb/d. Eyeballing your slides #18 and #20, they appear to show the higher number. My apologies if I recall incorrectly.
I prepared this update about ten days ago. The new EIA numbers came out this week.
There is a limit to how many revisions of this type one can make. I will think about your suggestion.
Gail,
Absolutely great report! I glanced thru the comments and couldn’t find these points made, my apologies if I’m repeating.
Small use of renewables Slide 8. It would be good to show how the United States fairs against other countries like Germany, Spain, Denmark and other top renewable players. This would be icing on the cake.
OPEC no longer controls the price of oil. Slide 13. Since OPEC production can no longer keep up with demand, they have lost their control on crude oil prices. Now the price is more under control of speculators than producers and consumers, and will continue to be so until consumption falls under production. That can only happen when there is a fundamental shift in US energy consumption.
If you need help in PowerPoint to jazz it up, let me know, I’d love to help!
Thanks for the suggestions.