The Disconnect Between Oil Reserves and Production
Posted by Gail the Actuary on March 6, 2008 - 11:00am
This post includes some ideas of Matt Mushalik, plus some of my analysis. Matt is a retired civil engineer and regional planner from Sydney, Australia.
If a person looks at published oil reserves, it is easy to get the idea that there are huge amounts of oil left to be extracted. One would think that there is no way that peak oil should be a concern. Once we look at the situation a more closely, we discover that published oil reserves really aren't all that helpful in telling us about future production. In fact, the evidence suggests that oil shortages may not be many years away.
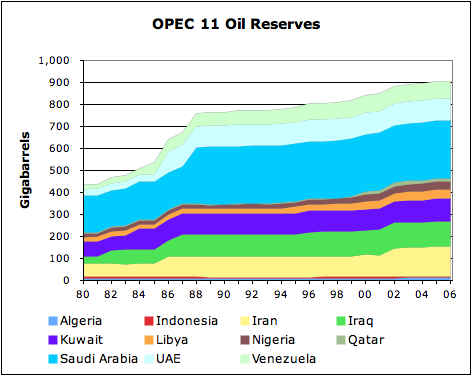
1. How much oil reserves are shown in published reports?
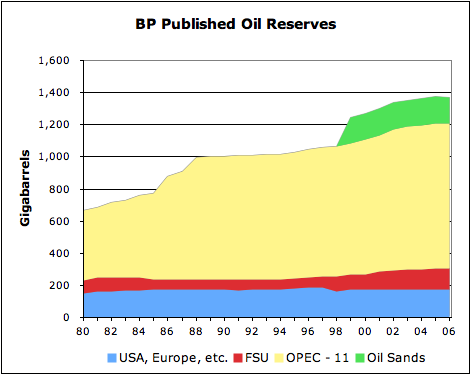
Most reports show reserves similar to those shown above, which were compiled by British Petroleum (BP). The major categories shown on Figure 1 are
• Canadian oil or tar sands. Generally considered a resource, rather than a reserve. (Shown separately by BP.) Oil sands resource was first listed by BP in 1999, even though commercial production began in 1967.
• OPEC 11. Excludes Angola (added to OPEC in 2007), and Ecuador (added recently).
• FSU. Former Soviet Union.
• USA, Europe, etc. Everything else other than Canadian oil sands, OPEC 11, and FSU. Includes Australia, Canada, China, Mexico, and many other counties.
In this analysis, the term "gigabarrels" (abbreviated Gb) is used to mean 1,000 million barrels, or 1 billion barrels in USA terminology.
2. How does the distribution of actual oil production compare with the distribution of published reserves?
It is very different:
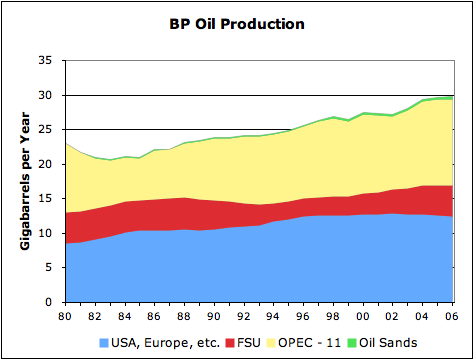
Production from the Canadian oil sands is just a thin ribbon, year after year, in spite of the apparently large size of the available resources. OPEC 11 has far less production than might be expected by their "proven reserves." USA, Europe, etc. has much higher production than might be expected based on the size of their reserves. If one graphs the ratio of production to reserves, one obtains the following:
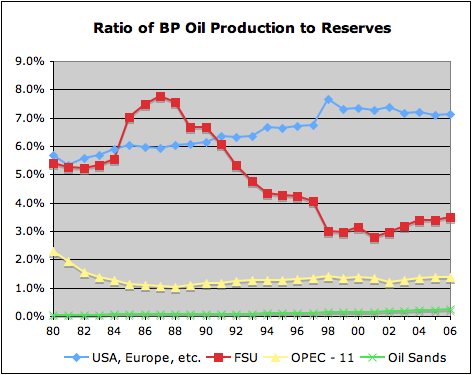
It is clear from this graph that the ratio of production to reserves varies considerably from group to group. It can also vary over time, as shown by the fact that the ratio for FSU is shifting downward over time.
There seems to be an anomaly in the BP data in 1998, which was the year production for FSU was shown by country for the first time. In 1998, there was a 23Gb increase in FSU reserves, and corresponding decrease in reserves for the USA, Europe, etc. group. Apparently, reserves for one or two countries got shifted between the two groups at that time. This anomaly causes the jump in the 1998 production to reserve ratios in Figure 3.
3. Aren't published reserves a leading indicator for future production?
One might expect reserves to be a leading indicator, but when one looks at historical data on an aggregate basis, it is difficult to see much evidence that this is in fact the case.
• USA, Europe, etc. Oil reserves are essentially flat from 1980 to 2006, while oil production first rose, then peaked and began to decline. One would never guess the rise and fall in oil production from the reserves.
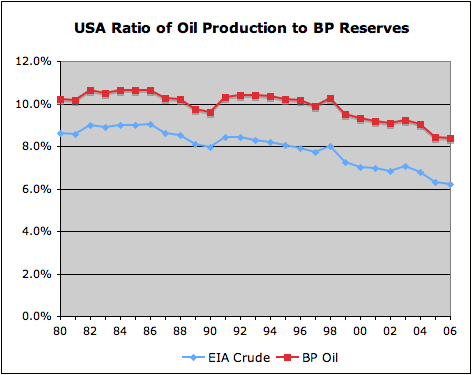
• USA by itself Both oil production and oil reserves have been falling since prior to 1980. Oil production has tended to fall more quickly than oil reserves, as evidenced by the decline in the production to reserve ratio over time. If reserves were a leading indicator of depletion, one might expect this ratio to rise rather than fall over time.
• OPEC 11 Several OPEC members publish very high reserve numbers, but have never offered production at the level one might expect from the quoted reserves.
• FSU Russia quotes its reserves at "P3" level, a level that is quite a bit higher than the level mandated by the US Securities and Exchange Commission (SEC). Besides P1 or proved reserves, which are all the SEC permits, it includes amounts that are expected with improvements in technology and economics, and even amounts that may be possible in the future, with future technology. The big drop in the ratio of production to reserves in recent years may indicate a more aggressive view of what may be possible in the future.
• Oil sands The hot water extraction process similar to that used todaywas patented in 1928, and the first large-scale commercial extraction began in 1967. While a huge amount of the resource is present and there has been a great deal of investment ($10.4 billion in 2005), production remains low -- currently a little over 1% of world oil supply. According to Statistics Canada, 2007 production is expected to increase by 2.2% over 2006 production.
4. Does everyone use the same rules in determining oil reserves?
No. Companies which follow the US SEC rules are required to set reserves at the P1 level -- the amount that is clearly available with current technology and current economic conditions. Availability must be demonstrated by actual production or commercial formation tests. Some countries use P2 reserves -- reserves that are at the "expected" level. Others use P3 reserves, incorporating amounts that may be possible with future technology and higher oil prices. I am not aware of aggregate data regarding the difference in these reserve levels, but some company level data suggests that at times they can be very large (for example, here and here).
Now that companies are having increasing difficulty replacing their SEC reserves due to depletion, the SEC is considering modernizing its rules. The changes are expected to increase the amount of reserves companies can record.
Reserve amounts reported by countries to statistical organizations are generally not audited. BP reports whatever countries report to it, without adjustment. When these amounts are published in newspapers and books, they are often referred to as "proven reserves," even though they use different definitions and are not audited.
Based on US data, the data BP publishes appears to be on a crude + condensate + natural gas liquids basis. Biofuels are excluded, as are processing gains.
5. Is there any evidence that the oil reserves for OPEC are overstated?
There is a great deal of evidence that this is the case.
• Matt Simmons obtained copies of more than 200 scientific papers published by scientists working on Saudi Arabian oil production. Based on his review of these papers, Simmons came to the conclusion that reservoirs in Saudi Arabia were at an advanced stage of depletion, and that the reserves were significantly overstated. His findings were published in the book Twilight in the Desert in 2005.
• Several of the OPEC countries adjusted their reserves upward in the 1980s, without any new oil discoveries, at a time when there was discussion about how production quotas should be allocated. It was believed that having higher reserves would be beneficial when quotas were assigned, so each country in turn raised its reserves. Logically, reserves should be declining in recent years, as oil is pumped out, and virtually no new fields are added, but this is not happening.
• Dr. Sadad I. Al Husseini, former Executive Vice President of Aramco (Saudi Arabia's national oil company), gave a presentation last October in which he stated that OPEC oil reserves are overstated by more than 300 Gb. If the amount is 300 Gb, it would correspond to about one-third of current reserves. His presentation says more than, so this is a floor, not a best estimate.
• A report by the reserves committee of the Kuwait oil company shows only 24.2 Gb of proven reserves (48.1 Gb if non-proven reserves are included) at the end of 2001, while published reserves as of the same date were 96.5 Gb. This was only 25% of the published level.
• The amount of oil produced by OPEC, relative to the amount of stated reserves, is very low. Some of this may be the result of very heavy oil that cannot be produced very quickly, such as that found in Venezuela (similar to the Canadian oil sands). Some other oil may be bypassed, because of war and sanctions, as in Iraq. Even allowing for this, the reserves would be much more reasonable in relationship to production if they were half of their stated amount, or even less.
• While OPEC claims extra capacity, its actions are not consistent with having much extra capacity. It seems likely that much of the claimed extra capacity relates to oil that is difficult to refine. No buyers are available, because no refineries can handle the particular impurities of the oil.
6. Is there a way of representing the disproportionate nature of the reserves and production graphically?
Matt Mushalik has prepared a graph showing the disproportionate nature of reserves and production. According to his calculations, 45% of oil production comes from only 190 GB of reserves. If these should deplete, there will be very serious implications for world production.
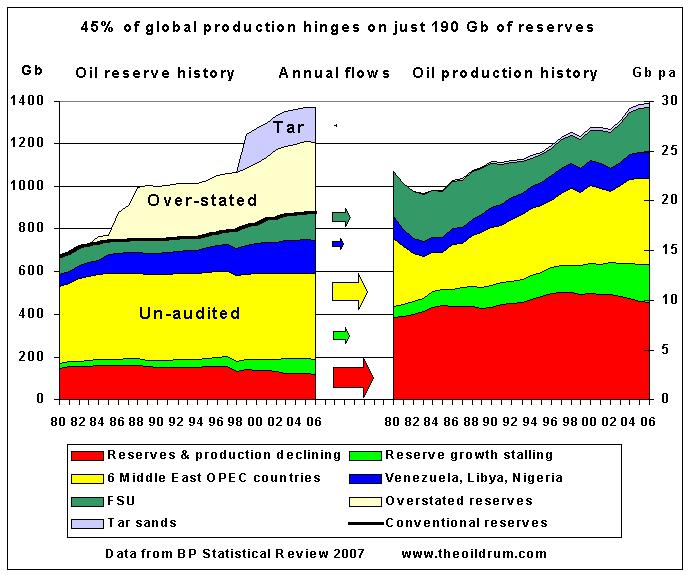
Matt's groupings are a little different from mine. He shows several of the OPEC countries separately and groups the remaining countries by whether their reserves are increasing over time or decreasing over time. Matt has written about the disconnect between reserves and production in World's Fragile Oil Flows From Declining Reserve Base.
7. Doesn't the US Geological Service (USGS) say that huge amounts of oil are yet to be discovered, and that current reserves will prove to be too low, rather than too high?
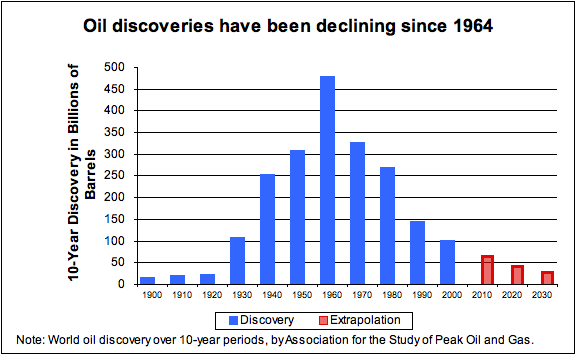
Yes. The latest USGS study does show 649 Gb of undiscovered oil and 612 Gb of "reserve growth". The methodology of this analysis is seriously in doubt, according to a report by Jean Laherrere. In this report, USGS does not adequately reflect the fact that the rate of discoveries has been falling.
The USGS also determines expected reserve growth in an inappropriate manner. They determine reserve growth based on historical experience for companies using SEC reserves. They apply this approach world-wide, without considering the type of reserves reported by other countries. In countries where reserves are inflated, this adjustment has the effect of inflating them further. If the ratio of US production to reserves has been declining over time, it is likely this approach will even overstate future US reserve growth.
8. Which of the groups "USA, Europe, etc.", FSU, and OPEC are past peak production?
• USA, Europe, etc. The grouping USA, Europe, etc. is fairly clearly past peak production. The USA, the North Sea, and Mexico are all past peak, as are Canadian conventional production and Australia. The only other major producer that is not past peak is China, and its production is increasing very little. Angola and Ecuador, which have recently joined OPEC, are shown in this group, but even with their inclusion, production is dropping.
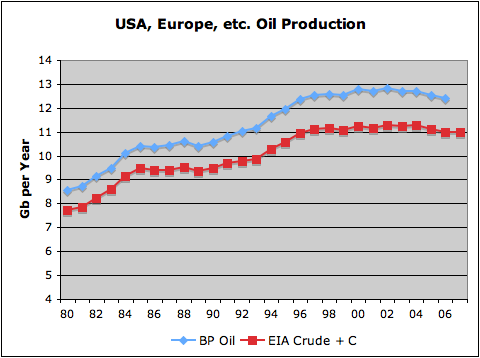
It is logical that this group should peak first, because it includes most of the heavy users of oil, and they generally extracted their own oil first.
EIA data through November 2007 is shown because it gives nearly the full 2007 year, while BP does not yet include 2007. The reason BP data is consistently higher than EIA data is because it includes natural gas liquids, while EIA data includes only crude and condensate. Since EIA does not show a subtotal for FSU, it was necessary to estimate this amount by combining data for the available countries, and adding an estimate for countries not shown separately, based on BP data for this segment.
• Former Soviet Union Oil production for the FSU does not yet appear to have peaked.
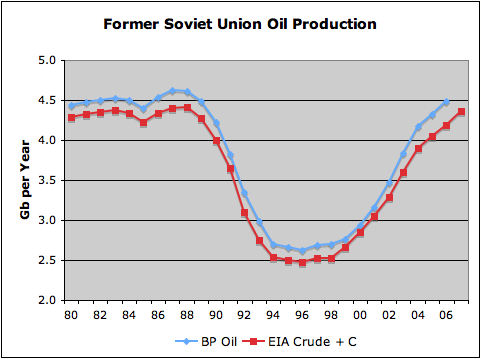
Production dropped in the early 1990's, and is now getting back to the level it was previously. It is not clear that it will ever exceed its previous peak. There are frequent reports that Russian production is expected to level off or decline in the future; the smaller countries are limited in their production capability by infrastructure limitations. Thus, increases in the future are likely to be small, at least in relationship to declines in production of the USA, Europe, etc. group. Thus, this group is not likely by itself to save us from peak oil.
• OPEC 11 It is possible that OPEC-11 is past peak, but this is not yet certain. BP indicates a small up-tick in OPEC 11 production in 2006, but EIA data shows a decrease in both 2006 and 2007 production.

If one looks more closely at OPEC 11 production using Matt Mushalik's graph of incremental EIA production (showing just recent changes in production), one can see that that while Saudi Arabian oil production is not as low as it was in early 2007, it is nowhere near where it was in mid-2005.
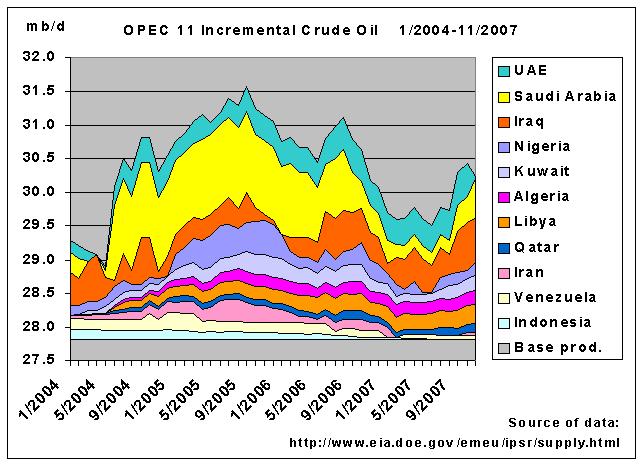
The lower Saudi production raises questions about OPEC 11's ability to raise its production. This is one to watch--once OPEC 11 is past peak, it is very likely that the world is past peak. We know so little about "real" OPEC reserves that reserve levels cannot be used to eliminate this possibility.
9. Can the Canadian oil sands save us from peak oil?
Can the perpetual sliver ever be anything else? It is difficult to see how Canadian oil sands production will expand very much, very quickly. According to the Master's thesis of Bengt Söderbergh, natural gas availability is likely to limit oil sands production in the long term. With or without the natural gas limitation, there are many other concerns, including environmental impact, greenhouse gas emissions, and very high continuing investment. Optimistic estimates of production are about four times current production by 2030. This would be about 5% of current world production--still not very much.
It is possible that one of the new production techniques, such as Toe to Heel Air Injection, will prove to be effective. If this happens, oil sands production may increase by even more than that forecast in the current optimistic target. If such an increase does occur, much of the benefit is likely to be after 2020. Such an increase could theoretically help mitigate the downslope after the peak in world oil production. The increase, should it occur, is likely be too late and too small to prevent the peak.
10. Does this type of analysis say anything about depletion rates?
Possibly. Cambridge Energy Research Associates (CERA) published an analysis indicating that if one looks at a mixture of fields that are increasing and decreasing, the overall decline rate is 4.5%.
If CERA looks at the decline rate for a mixture of increasing and decreasing fields, it sounds like CERA is looking at the depletion rate with respect to reserves at a point in time. This is in contrast to a decline rate, which one generally thinks about as occurring after individual field's peak or plateau.
While CERA made its calculation with individual field data, another approach would be to start with aggregate data relating to the (production / reserves) ratio, such as BP data. A person would then make adjustments to the aggregate data. One adjustment would be to remove reserves relating to fields that are not yet in production from the total reserve amount. Another adjustment might be to put reserves on a P2 (that is expected) basis, if companies report them on a P1 or P3 basis. Another adjustment is a small timing adjustment - the payments during one year should relate to reserves at the end of the previous year, instead of the end of the current year. Ratios before adjustment are shown in Figure 3.
The ratio before adjustment for the USA, Europe, etc. group is 7.1% (Figure 3). It seems likely that even after adjustment, it would be higher than 4.5%.
The ratio before adjustment for the FSU group is 3.5%. Two adjustments are needed:
1 .To reduce the reserves because reserves are on a P3 basis, and thus are higher than the expected or P2 level.
2. To reduce the reserves by the amount relating to fields not yet in production.
Both of these adjustments would tend to reduce the denominator of this ratio, and thus increase the ratio. With these adjustments, it is likely that the FSU ratio would also be over 4.5%.
OPEC reserves, as published, are too unreliable for this approach to work. If a person had a better analysis of reserve figures for OPEC, it could perhaps be applied.
11. What should we do now?
Given the likely shortage of oil in the future, and the likely environmental impacts whether or not there is an oil shortage, it would be best to start taking action now to reduce usage of oil and other fossil fuels.
We are now running out of time to implement urban rail solutions as is being done in the Australian City of Perth. In Perth, rail lines run alongside the freeways. Rail stations have bus terminuses on top the rail stations, and kiss & ride and park & ride facilities nearby. This is ideal for getting to the station in various ways and a quick train-ride to the city.
Contact
- Content: editors at theoildrum dot com
- Tech support: support at theoildrum dot com
License

This work is licensed under a Creative Commons Attribution-Share Alike 3.0 United States License.
Good overview, Gail & Matt!
In relation to 9. Canada Oil Sands
Soderbergh's thesis shows oil sands production peaking at about 3.6 mbd in Fig 15.10, page 93.
For comparison, David Hughes, a geologist with Natural Resources Canada, believes that the peak will never exceed 2.5 mbd due to natural gas, water, diluent and infrastructure constraints.
http://globalpublicmedia.com/node/823
http://www.aspo-usa.com/fall2006/presentations/pdf/Hughes_D_OilSands_Bos...
Interesting Matt Mushalik is ending up with numbers similar to mine using a completely different approach.
I think this makes a good companion article to the current one
http://www.theoildrum.com/node/3301
But my approach.
http://www.hubbertpeak.com/hubbert/nehring.pdf
Given that most of the large discoveries are in the past when he published this paper and he is the only person known to have predicted peak correctly.
He has a world URR of 1250 GB with peak in 1995 given the trends in consumption at the time of writing.
His paper gives 1700-2000 GB using a study by Nehring as the basis. I urge people to read this paper since he did account for a lot of the sources we are using now.
In anycase starting with this the next step it to justify higher reserve estimates since then considering that most of the large discoveries are in the past.
My conclusion is that if we do actually have these additional reserves then probably the production rate from them will be low. The oil sands is the poster child for this situation but it holds for fields with 90% water cuts also.
On that note I also included this paper as a critical resource which puts global water cut at 80%
http://www.touchbriefings.com/pdf/2590/Ferro.pdf
Hubberts own estimate was 1250GB
http://www.aspo-ireland.org/index.cfm?page=speakerArticles&rbId=9
So given that we have produce over 1000GB by now I believe its actually 1100GB or so by now.
I estimated we are down to the last 150GB of "fast" oil that can be produced at a high rate.
Surprisingly close to the 190 GB Matt is reporting for 45% of our production.
And I have the same conclusion once this is gone production will drop by about 50%.
Given this approach and my approach its pretty clear that we may have only 150-190GB of the "good stuff" left that can be produced at a high rate. The actual amount remaining after that discussed a lot on the oil drum. I'm of the opinion a lot of it is paper barrels and whats not probably wont be produced at a rate close to days. Its at least 50% lower.
Next of course one big factor that caused us to delay peak from the 1995-2000 range has been increased ability to extract. This however just increased real depletion rates and results in a faster decline.
My conclusion is even though we may have just recently passed peak we may have actually used up most of the oil that can be produced at high flow rates on the front side.
So post peak will see a swift decline over less than a decade to production levels much lower than today if its even produced considering the political implications and the effect of such a swift decline on a oil based economy.
So thanks for the paper. Two quite different approaches seem to lead precedence to the scenario of a possible swift decline in production rates post peak.
Memmel,
I've recently seen a comment by someone (can't find it now) that the world peak in light sweet oil was in 1998.
I would love to see this backed up by evidence. Any idea's?
I'm pretty sure many disagree with your assessment. However to those I would like to say that Russia at the moment is producing full throttle, 9. something mbd, while at the same seems to be depleted for something in the range of 85%.
From peakoil.com, courtesy of the ever vigilant Steam_Cannon. We've had a number of threads on LSC peak there:
It's Official! Light Sweet Crude MAXED OUT: OPEC
Have non-Opec, and global light sweet crude oil both peaked?
Lloyd’s List – Past Peak for Light Sweet Crude
Great! Thanks. You are one cool dude, man.
Am I correct in the assumption that once light sweet peakes and declines, EROEI goes down?
The dude continues to abide.
Glad you like the chart. Says it all. The peak in LSC is a keystone of my rather infrequent peak oil rap - tying that in with the constant reports of refinery shutdowns we hear about. Would like to see an article charting the history of those, too.
Staniford contributed a small piece on LSC peak here, too, when he was still a guest contributor.
Ahem. The quote is "The Dude abides." This misquoting aggression against one of my favorite movies will not stand, man. (:
Thanks, Gary.
EROEI goes down, just because of the rising water cut and adding new smaller wells in higher to reach locations. Things that would add to the processing after production (higher sulphur, lower gravity) would reduce EROEI further.
The mix of oil types is moving to the ones that trade at a discount to the light, sweet types. Thus, the funds oil companies are receiving from the sale of oil will tend to lag indexes of a particular type of light, sweet oil (say WTI or Brent). The amount spent on processing goes up, so the cost to the consumer doesn't get much benefit of the price spread to lower grades.
Relative to average price of crude, the price of consumer pays probably goes up, because of lower EROEI.
Thats the other part of the problem. We seem to have figured out how to keep production rates high even though overall depletion may be well past 50%. Symmetric HL models give the peak at around 60% URR if you remove the symmetric constraint peak at 70-80% of URR is not unreasonable. Note that per field depletion rates as high as 20% or even higher is no uncommon only new finds and the magic of reserve growth keeps the overall depletion rate low. So regions like the GOM that had been bringing on new smaller fields until the last ten years or so would see the depletion rate climb from say 8% to 20% very quickly once the basin is fully developed.
So if I'm right about whats going on we will see production in the GOM start to drop off fairly quickly this already seems to be happening. Same of course with the North Sea.
Since the reserves in the ME are in general not backed by new discoveries then they should follow the same trend although at a later date.
So believe it or not the key is US and North Sea production if I'm right we will see a acceleration in the production decline rate for these regions as the underlying depletion rate grows to the field depletion rate because of lack of new fields.
As long as you could bring on new fields or use technology like horizontal drilling water/gas injection to revive older fields the overall production decline rate follows HL. However once you have saturated the basin the decline rate deviates from HL simply because the underlying depletion rate has increased over time and HL assumes a constant depletion rate.
As far as Russia goes a lot of the fields are watered out and production rate is controlled by the water handling rate. These fields follow a different depletion model. More in line with HL. I don't know the break down in production in Russia between old fields produced at the maximum of water handling and new fields produced at maximum depletion. I think they have also saturated some basins. In general I expect Russia should remain fairly close to HL but I don't know enough about its basins and how they are produced. However the recent increase in reserves and the fact they are still decline shows that the expect increased production from technology and are not getting it.
So the fact that Russia is now deploying new methods and is unable to increase production lends credence to the assertion several people have made that technology mainly increases depletion rates.
http://www.eni.it/wogr_2007/oil_production_quality-world-18.htm
memmel,
Thanks for all of those links. I think all of them are very worthwhile reading.
The water issue is clearly a problem. Besides the Ferro paper you link, as anyone tried to summarize the material available on it?
Not to my knowledge the water cut issues in the US are well known and documented frequently.
Other than that surprisingly considering its effect on production rates its pretty much ignored by the peak oil community.
Gail,
Pardon my layman's approach to math.
Knowing that they fudged the figures around circa 87 we could make an assumption that they were half honest before then. So adjust the OPEC graph down between 80 and 88 to make that slope fairly linear. That may give some sort of "scenario modelling" figure to plug into world reserve model. Indeed you could use "rule of thumb" adjustments to all suspected dishonesties in the system. This may produce a fairly accurate picture of reality.
If they use the same technology to extract oil then we could adjust their reserves down to a level that puts everyone in the similar reserves/production ration. If the two adjusted figures are in the right "ballpark" region we have probably got a useable set of unfudged numbers.
Just a thought, (looking at all those pretty colours does funny things to my head)
The main problem I see is 1980 does not go far enough back. I'd like to see production from the ME before it was nationalized.
We actually have the data in general production declined from the 1970's but its not a lot lower than when the same companies that are producing at the higher rates in North America etc where in control. In short nothing much changed except reserve estimates.
The 1950-1980 production data is in my opinion important for the thesis of this paper since it includes nationalization of resources.
BP gives production back to 1965, but reserve history only to 1980. EIA International Petroleum Monthly shows production back to 1970 - no reserves.
Simmons sheds a lot of light on this pre-bogus/post-bogus ME reserve change from when Aramco was run by the American oil companies in the 70s to the Saudi nationalized version of the '80s. There was a U.S. Congressional hearing in 1979 as a follow up to their 1974 hearings into overproduction damage to the Saudi fields in dealing with the demand surge of that time. They found that the problems of '74 had gotten worse. They didn't want to publicize these unsettling developments, so they muffled it from "hearings" to " A Staff Report to the Senate Subcommittee". As Simmons noted:
"The staff report did not hide, however, the huge reduction in the outlook for Saudi Arabia's maximum sustainable oil production. Gone were the confident expectations of the early 1970s that Aramco's oil output could rise to 20 or 25 million barrels a day. Gone too was a revised downward estimate that a plateau of 16 million barrels a day could be sustained for years. By late 1978, the realists at Aramco were predicting that even a rate of 12 million barrels a day begun in 1985 would lead to declining production by 2000 to 2005." Twilight in the Desert, p 383 App. C
This was in 1979 that these American Aramco personel were making this bold projection. It was based on 110 billion barrels of realistically producible reserves. And the report stated it wasn't likely that large new reserves would be found, which has been the case per Simmons. I somehow get the feeling they were a little more honest and/or knowledgable than their subsequent Saudi counterparts. The production curve has followed the 1979 projection closely despite the reserves being doubled, tripled, and what not.
Think of it. Hubbert's model had just been proven correct in predicting the U.S. peak when this government investigation spanning '74 and '79 came to the same conclusion as Hubbert on an approaching global oil production peak. So what does our government, whom we hire to look out for our well being, do with this information? Well, they hid it of course. They put it under lock and key lest we might get prepared. Honest to God, that's what they did!
"The notion that Saudi Arabian oil reserves could be produced at 10, 12, or 15 million barrels a day for 50 or more years was utterly dismissed by the subpoenaed papers that formed the basis of this staff report. What a misfortune it was that this report received no media coverage and these key papers were locked away from public view for next 25 years - years during which the entire world grew more and more convinced that Middle East oilfields were so prolific they could be produced at virtually any rate through the first quarter of the twenty-first century."
The supporting documents for this report were deemed "sensitive" and put under seal for another 50 years. Yet another brilliant energy policy coup by our wise men in Washington.
Thanks for posting this! Now that you mention this, I remember reading about this in Twilight in the Desert.
Saudi Arabia has produced about 81 Gb between 1979 and now. If it has 110 Gb in reserves than, just a subtraction would bring 29 Gb of remaining reserves. There have probably been some discoveries, plus some reserve growth, given the conservative reserves of the 1970s. Ace's reserve range of 60 to 100 Gb from his post a few days ago would seem a lot more reasonable than the published reserve of 264.3 Gb.
I second that idea..
Lucifer,
It does seem like one could work backward from production to get an estimate of reserves. For countries with easy-to-extract oil, it would seem like might expect to extract at least 4% to 5% out each year. If countries can't, you start wondering about the accuracy of the reserves.
Dear Gail,
Excellent work. I think it's resonable to assume that the published reserve figures are greatly exaggerated. There is evidence for this, but by how much? This is the crucial and civilization altering question! I suspect even the major producers probably don't really know the answer. They may not even desire this knowledge, prefering instead the comfort of hope and the warming glow of optimism.
I imagine they have a bias towards an optimistic evaluation, as the consequences of having, admitting and publicising, substantially lower reserve levels are profound, both for the major producers and consumers of oil. It's extraodinary how people as individuals or groups can internalize attitudes that fly in the face of objective reality.
The following is anecdotal, yet indicative and one can makes generalised conclusions about the mountain we have to climb. Yesterday I heard an interview with a spokeman for a european energy ministry. He continually refered to data from the IEA relating to oil reserves. The journalist asked him, 'When will the oil run out?' whatever that really means? He replied that 'Reserves, according to the IEA, aren't the problem, we've got enough reserves for another forty to fifty years. The problem is one of lack of refinary capcity, we've not invested enough in refinary capacity. Also we in the West and in the oil producing countries haven't invested enough in exploration, drilling and infrastructure. There is no real shortage of oil, only a 'shortage' of capcity.'
But what does the statement that we've got enough oil for another forty or fifty years really mean? Did he mean that in forty years it'll all be gone or that in forty years it'll start to run out? That in effect Peak Oil is forty years away, or is it happening now and the decline to almost nothing will take forty years?
The answers he gave were as vague as the questions directed at him. I kept waiting for more detailed and supplementary questions, but they didn't come, and this was an interview with the spokesman for the energy ministry conducted by a 'serious' journalist that specializes in questions relating to energy policy!
If mainstream, establishment, figures like these have so little knowlegde about a subject they are supposed to be 'experts' in, and they have such a weak theoretical foundation, what hope is there? It's like there is a form of institutionalized, structural, intellectual conservatism, inertia, ignorance and denial, built into the 'dna' of our current 'system'. We are heading down a road, and we are not going to change, at least not as long as this 'concensus of ignorance' is dominanting the discourse.
Realistically, challanging and changing 'establishment' attitudes, ideology and dogma, about oil and a host of other things, is going to take an awful lot of effort and a great deal of time, we are talking about decades here, at least under normal circumstances. Perhaps, maybe our best hope for the future is a situation where 'normal circumstances' no longer apply, and the rigidity of our socio/economic/political system is profoundly weakened and everything is open to question and up for grabs?
The ministry official you are talking about might or might not understand the full implications of PO. Even if he does understand it he is never going to publicly make an announcment on it. Their job is to keep up the status quo by making optomistic predictions much like CERA does.
People have an image of pools of oil in the ground. All one has to do is insert a suitably sized straw, and pump the oil out. The oil will come out at the same speed until it is all gone - this method works with swimming pools; it must work with oil.
I guess we need to emphasize the role of water cut and of pressure. It just doesn't work the way people thinks it works.
The OPEC 11 data in fig 3 is pure fantasy.
Percentage of Reserves production would be 4% at least,
From figure 2; OPEC 11 production = 13 Gb -> equiv to 4% reserves gives RESERVES OPEC 11 circa 300 Gb.
300 Gb
Just to entertain an old fella could someone tell me what OPEC 11 reserves = 300 Gb implies.
I think these are only figures for BP
OPEC-11 stated reserves were 905.5 Gb at 12/31/2006. If they should have been 300 Gb, this implies that they were overstated by 605.5 Gb, or that they are really only 33% of the stated amount.
At 300 Gb, they would be about equal to the reserves for the rest of the world (ex tar sands, which are really resources). With this change, the worlds stated reserves would drop from 1208.2 to 602.7 -- just about exactly half of what BP was reporting.
Gail, if the estimate of 602Gb is right, where would that put the world on the Hubbard curve? If we assume a similar curve to North sea oil, or Texan, when would we expect to see a sharp drop in extraction?
And, given projected increases in consumption in oil-exporting countries, when would we expect greatly reduced exports?
I am not really at all familiar with the relevant figures, so perhaps you will forgive me asking - the present oil consumption rate is about 85 million barrels a day, I understand, so that is around 30Gb a year,or 30 years at current rates.
Is that about right? - I realise of course that this would include expensive and hard to get at oil, and extraction rates would drop sharply before we got down to zero!
Apologies if this is all a bit basic for most in this thread, but I would like to get my head around the basics of the discussion here - not one on which I am very informed.
Well, if you are removing 300 Gb of bogus reserves from the 2P total reserves it means we have reached production mid-point for conventional oil (1200-300= 900 Gb). Growth in alternative fuels and tar sands as well as reserve growth may buy us a few years and extend the plateau. But clearly the solution lies on the demand side now.
Thanks for the reply - it seems then I have not misunderstood.
How far past mid-point was it that Texan and North sea production crashed?
They didn't. Oil production declined about as gently as it had risen.
Banal comments on the oil supply usually confuse the size of the tap with the size of the tank.
I forget who first used this metaphor, which I like a lot.
Well actually there is a connection, somewhat anyway. The more tanks the more taps you can have. And if you have a few very big tanks then you can put very large multiple taps in each. The relationship is never 1 to 1, nevertheless the relationship between reserves and extraction rate cannot completely be disregarded.
Of course different types of reserves have completely different flow rates, or tap sizes. Oil sands, despite being very large cannot flow very fast. But if we lump all "fast oil" fields together then there is a definite relationship between the size of the reserves and the amount of oil they can extract, and do extract, from those fields each year.
Completely disregarding this relationship between reserve size and extraction rate is a serious error. And that is exactly what most people are doing when trying to estimate Middle East reserves. Kuwait, for instance, is now extracting every barrel they possibly can and getting about .9 billion barrels per year. That would give them a R to P ratio of over 110 to 1. If they truly had over 100 billion barrels of reserves they could do a lot better than that.
After all, isn't that what this whole thread is all about?
I hope you do not consider my comments banal.
Ron Patterson
You mean, for example, a relationship like P=a(1-Q/Qt)Q ?
C'mon Ron, consider the audience...
David, perhaps you were just being sarcastic. If so I apologize. Sometimes sarcasm is lost om me. :-(
Ron Patterson
And of course HL is assuming a fixed depletion rate. If the depletion rate is increasing or to put it another way the ability to extract gets better then HL will be a high estimate.
Its reasonable believe that in general we are capable of extracting oil at least twice as fast as we did in the 1960's.
Thus even HL could have inflated URR estimates by about 50%.
A more realistic adjustment could be 25%. You pretty much have to go to the shock model to test changes in depletion rate.
However the current shock models that have been presented include a lot of these dubious reserve increases and assume they will be extracted at our current production rates. Thus since it includes backdated discovery data at least in the current form its not going to give you a correct answer.
Maybe increasing water cut could be used in the shock model.
In my opinion the right model that is robust against corrupt data would use production data, water cut/gas injection and a reasonable estimate of increased extraction efficiency to estimate total URR and the production profile. HL is a partial solution. I don't think backdated discovery should be used since as this post indicates its probably garbage.
Despite the fact that non opec production shows a higher depletion rate I'm not convinced that its not inflated.
Fixed, no. Variable and determined by the HL relation, yes.
HL depletion rate is P/Q = a(1-Q/Qt), where P is production rate and Q is cumulative production.
Definitely not fixed, although, as you say, possibly optimistic.
Well, I screwed that up.
HL depletion rate is actually P/(Qt-Q)=aQ/Qt
Otherwise my comment was correct.
Well, if "optimistic" = "high". ;-\
Hmm P also decreases as Q increases thats why I'm saying fixed.
The HL depletion rate is aQ/Qt
It increases linearly with Q from 0 at Q = 0 to a at Q=Qt
That's not fixed, either as a function of Q or as a function of time.
My bad sorry its not depletion rate.
a's a constant :)
Its the logistic growth rate.
http://en.wikipedia.org/wiki/Hubbert_Linearization#Principle
If the production rate is increasing such that K is decreasing.
The rate of depletion is increasing because A is not constant.
Your right I misidentified a/K.
Hmm how to say it right.
If the logistic growth rate is increasing because your extracting faster and faster over time then HL will give a inflated urr. This is whats not constant my bad. Your able to increase production rate and get a inflated URR result over time.
As and example take a field with 10 wells and then add another 10. URR has not changed but by increasing the effort the effective URR looks larger. As long as the rate your increasing your effort is fairly linear then you still get a linear HL plot.
For reasons outside the scope of HL the rate at which you can increase your rate of extraction is itself linear. Only so many new drill rigs can be produced each year etc.
So as it got harder to extract we increased or efforts to extract fairly linearly.
Another way to look at it is we are say working 10 times harder to extract oil today compared to say 50 years ago.
If you look at the curve int the link its actually sinusoidal drifting above and below the effective k value. This drift around the effective URR has been used to attack HL.
But my interpretation is that as production has declined new technologies have been developed and deployed and the drilling campaigns increased to combat production decline.
The US is unique in that these methods where developed as needed. I.e we drilled in the GOM only once the onshore fields played out then moved on to deeper water and more advanced extraction on land.
Here is Russia it has a K of 10.38 % the US has a K value of 6%
http://www.theoildrum.com/story/2006/1/27/14471/5832#41
We would expect that the K values would be fairly constant regardless of the region studied.
In fact they vary quite a bit.
http://www.theoildrum.com/story/2005/9/29/3234/46878
Its interesting that the K for KSA is about the same as the US even though they supposedly are conservative and the US is not.
While two countries for who for political reason are know to not have extracted as efficiently as possible Iran and Russia have K's around 10%.
Interestingly although Norway is grouped as a fast producer it actually has a high K value of around 18%. However they are very conservative in reserve estimates and experience real reserve growth and also employed water injection offshore. So maybe they are not a fast producer as claimed but have actually been the most conservative.
This concept that the K values have meaning could well be bunk.
Its a lot easier to just say HL has constant depletion rates :)
Addendum:
I know that high K values are generally seen as fast extraction but both the USSR Iran and Norway have high K values and symmetric production curves. While the US/KSA have low K values. Yet we know the US has put enormous efforts into extraction. Thus the assertion is KSA is the same.
http://graphoilogy.blogspot.com/2006/03/mexicos-ability-to-export-oil.html
Mexico which has been somewhat half and half on technology has a K value of 7.4%
They did do nitrogen injection in Cantrell but in other places they have not employed the latest technology.
The thesis is that the high K values are probably symmetric extraction while the lower the value the better chance that eventually the production curve is asymmetric.
The conjecture is that a natural K value for symmetric production is around 10-15%.
Ghawar has a K of 7.79%
http://www.theoildrum.com/node/3050
And yes I'm aware this is wacky :)
But we know the US with a K around 6% has not been conservative with its extraction thus..
I looked at Hubberts paper again.
http://www.hubbertpeak.com/hubbert/1956/1956.pdf
A important thing to note is that for world peak he had the maximum production at about 13GB a year less than half of what we do today. This fits with my assertion that we are pumping about twice as fast today as in the past. Given that he got much close to the peak production rate for the US. His URR estimate range is 150-200GB for the US
I don't have the wells drilled per year but I did find average depth which is probably a better indicator that we are working to find oil.
http://tonto.eia.doe.gov/dnav/ng/hist/e_ertwo_xwde_nus_fwa.htm
Notice that the depth had already started to increase by the 1965 this indicates that the period of working harder for oil had already started well before the peak. And in fact overlaps the low bound estimate for peak. Although we fixate on the date of peak production real production did not change all that much around the peak.
Thus inflation of the K value by systematic increases in the effort exerted to keep production up looks like a viable concept. For the US this means the real URR could be closer to the 150GB estimate than the 200GB. And right now the US is even producing more oil than HL would predict. This can be attributed to high prices. Thus its reasonable to expect US production to return to the HL curve or below in the near future. This could be at a rate of production about 50% less than today.
If anything the low HL K values for the US which is known to have exhaustively exploited its reserves and for KSA may not be indicative of ample reserves instead they may indicate that the production effort has been steadily increased via technical advances thus resulting in inflated URR estimates. We know also that KSA has also aggressively adopted advanced extraction methods. In many cases they are actually using more advanced methods than the US on a large scale.
The K values for Iran and Russia are higher and yet we know these two countries have not been aggressive in their extraction attempts simply because of political reasons. So I stand behind my conclusion that K for both the US and KSA are probably inflated via technical progress. A intermediate example is Mexico which has done some advanced methods on its largest field but not systematically. Thus lower K values than 10% indicate technical induced inflation. Indeed for Mexico the production curve will be asymmetric as Canterell declines.
So back to the paper. If Reserve estimates are inflated it seems the US may have also inflated its estimates and even HL may give inflated results thus if inflation is a serious issue we can expect the US to go into rapid decline basically any day now followed closely by middle east production.
David,
I associate the comment, "It's the size of the tap, not the size of the tank," with Steve Andrews of ASPO-USA.
Gail
Thank you
"One might expect reserves to be a leading indicator, but when one looks at historical data on an aggregate basis, it is difficult to see much evidence that this is in fact the case."
actually, "a lot" of reserves are estimated based on emperical analysis (decline curve analysis, oil cut vs cummulative, etal) so these reserves could not be considered leading indicators.
memmel cites an 80% water cut worldwide. so past performance is the basis for "a lot" of oil reserve estimates.
i doubt this applies to opec. who knows what they are basing their reserves upon ?
I suspect that there are investors who place quite a bit of reliance on reserves - have more faith in them than those who have looked closely at them would have.
Where is the analysis on the consumption side of the equation?
My view is that we will consume 100% of what is produced. If you or I cut back on what we use, the price will be lower by epsilon, and someone else, perhaps less fortunate, will have the oil to use.
All one needs to know is supply -- consumption follows.
Well, I think we'll consume everything that is prodcted almost by definition, since oil storage is expensive.
Only if price is expected to increase a lot, so storage can be paid, people will save some of it.
Gail and Matt,
Thanks for one more piece of the puzzle. As we have known for years now, it isn't the size of the potential supply but the size of the actual supply (produced) that is important to the economy. You clearly show how the two are not related. Clearly we have a problem now in meeting demand. So usable supply needs to increase or demand decrease or both or oil prices will just keep going up no matter what is in the ground.
The only positive note I can find anywhere in this reality is that because the oil is difficult to extract rapidly there will be some supply for a long time. That should allow us to transition to non petroleum if we decide to.
There will be some supply, but how it will be divided up is not clear. I think countries can only count upon their own supply, and not even that, if they have given rights to some outside oil company.
Whether the US will be able to continue importing two thirds of its oil supply, and pay for it with IOUs, is an open question.
Interesting.
If you take the top three graphs and make the assumption that the US/Europe production to reserves rate should be expected of the FSU and OPEC (not a bad assumption), then you can reverse the calc and determine what the reserves would be to match the %age rate.
At 2007
For FSU = 57Gb (vs 115Gb claimed)
For OPEC = 171Gb (vs 900Gb claimed)
Now you would have to make allowances for fields being left purposely undeveloped, etc. - but these variances are too great to be finessed away. As a minimum you would have to assume that OPEC was overclaiming its reserves by at least 100% of the true figure.
Nice post.
Staking reserve figures is misleading because information about flow rates is lost. Fast oil sources (good reservoir + EOR) will achieve high flow rates but will be short lived. Immature hydrocarbon resources (tar sands, shale) will achieve small flow rates for a long time.
IMO, an important quantity is the ratio of the maximum flow rate to the URR.
For instance, Canadian tar sands is a slow source: URR~175 Gb but the maximum flow rate will be around 3 mb (3*365/10/175=0.625 %).
Norway's production, based on modern offshore infrastructure, is a fast source: 3.42*365/10/32= 3.9 %
The US, the most modern and drilled country in the world: 11.7*365/10/278= 1.54 %
If we assume the US as a model for the world and that 82.0 mbpd is the maximum achievable flow rate (C+C+NGL), we get: 82.0*365/10/1.54= 1.94 Tb which is quite close to URR estimates for the world.
If you look at Ghawar, maximum production at ~5.5 mbpd and URR believed to be around 110 GB:
5.5*365/10/110= 1.83 %
Now, the historical maximum for Saudi Arabia is 11.1 mbpd in 2005, we get the following URR estimates using the US or Ghawar figure:
11.1*365/10/1.83= 221 Gb
11.1*365/10/1.54= 263 Gb
hmm...
The Saudi Aramco link you cite above is broken; I googled the PDF and got zero. Please remove the link.
Thanks!
Another computation:
OPEC-11, max production= 34.2 mbpd in 2006 (BP):
34.2*365/10/1.54= 811 Gb
Cumulative production is ~200 Gb which means that reserve are around 600 Gb which corresponds to the corrected official reserve number:
2P official reserves: 900 Gb
Spurious reserve increase: ~300 Gb
Note that the total amount of discoveries for OPEC is around 700 Gb (Laherrere, 2P).
If you assume extraction efficiency or the depletion rate has increased with time. It drops these reserve estimates by quite a bit.
This makes sense since they are able to keep a high production rate even as 33% of the reserves have been used. So intuitively it makes sense that extraction efficiency has increased as the real reserves have been depleted.
So using your approach I'm saying that the extraction rate has followed this trend 1.5%->3.9%
Using this you could fit Ghawar's production on top of a reserve level closer to 60GB instead of 110 which goes back to what I'm trying to say even the corrected numbers could still be inflated by 40-50% if you want to get a conservative low estimate then use 25%.
So instead of 110 for Ghawar for example its reasonable to suggest the reserve is 83GB.
Which is in line with a lot of models.
http://www.theoildrum.com/node/3050
And shows HL as being high exactly like I'm saying.
So again you have another way to show that real reserves could feasibly be a lot lower than whats been assumed.
Regarding 9. Can the Canadian oil sands save us from peak oil?
The THAI pilot plant has been in successful operation for over a year http://www.cbc.ca/national/blog/special_feature/the_federal_budget/innov.... Conceptual plans for the first commercial 100,000 BPD plant at May River are sitting on the desks of the Canadian agencies while the company “continues to work with these agencies to encourage the development of an efficient regulatory approval process which reflects both the particular design of the May River Project and the more streamlined regulatory approval process for conventional heavy oil development.” http://www.petrobank.com/webdocs/whitesands/whitesands_pub_disclosure.pdf
It is a mystery why the government (who provided $19mm to fund the original pilot) is not clearing the way for this environmentally responsive, low cost technology to move forward. However, as Chris Bloomer says, if Canada doesn't need the oil, there are other extra heavy oil resources out there besides the Alberta Oilsands.
If one looks at the history of the oil industry, technology has always trumped other restraining factors in the end.
"If one looks at the history of the oil industry, technology has always trumped other restraining factors in the end."
like running out of oil?
how is that technology trumping declines in the North Sea or Cantarell these days? Has technology reversed declines in Texas and I wasn't informed?
I'd like to know that they have the process wholly under control before declaring it "environmentally responsive." The largest coal fire in the world is burning under ca. 3000KM in China.
rainsong posted recently that Petrobank aren't quite seeing the results they hoped for, too:
"URR was estimated 70% + of oil in place."
that statement might give one the sense that ......what seems too good to be true............well, you know.
70 % of ooip ? for starters, it is not o, but more like "g" ..........(goo) that is in place. many have argued that ghawar will only recover 40% ooip. the largest field ever discovered, with an oil viscosity lower than that of water, cant achieve more than about half, well ok 4/7, the recover of the worst , probably most viscous goo, field ever ??????????
The claims that THAI will produce less CO2 emissions compared to conventional tar sand extraction is really questionable. The description of the process states that the high pressure air will burn the "coke" fraction of the tar to provide heat and pressure that moves the lighter tar to the horizontal well (extraction) pipe. The coke is actually the heavier tar that has much less H (hydrogen) compared to C (carbon) in the molecule. The lighter fractions of tar that have greater H to C ratio (higher API) are supposed to be extracted.
As the tar with greater carbon content is burned, more CO2 is produced. The problem with emissions, I suspect, is that these CO2 and other unoxidized hydrocarbons are coming out of the extraction pipe. I can't possibly imagine that all those burned gases would remain underground with only the lighter tar (bitumen) coming out. I believe this process cannot control the burned gas emissions as well as predicted and in fact emits more CO2 than conventional tar sand production & upgrading.
It seems like it takes a long time to get a new method used widely. The National Petroleum Council estimated in its report Facing Hard Truths about Energy that it takes on average 17 years for a new technology to be used widely.
Part of the problem is that one has to go through several distinct steps with a new technology. First there are laboratory tests. Then there is a pilot project, like the ones that Petrobank has had for over a year. Then there is a small scale commercial project, like the 100,000 BPD plant that Petrobank would like to get going. Until the wrinkles can get ironed out in the 100,000 BPD plant, no one wants to invest many many millions in a larger scale project.
I agree that the technology seems to have merit. If we are looking at peak oil now or in the next few years, I don't think THAI will be far enough along to prevent it. It may help the downslope, though.
"it takes on average 17 years for a new technology to be used widely."
ok, insitu combustion(in conventional oil reservoirs) has been tested for at least 50 yrs*. the problems are well documented. horizontal drilling has been used for over 20 yrs and i think you would agree is in widespread use. so you combine the two and what do you get? imo, a technology that will never be in widespread use.
* one of the 1st attempts, if not the 1st, would be plum bush creek field in colorado in the '60's.
If a full blown energy crisis happened the red tape will be cut quickly.
Thanks for your support in helping us spread Gail's work around the web...
http://reddit.com/info/6b435/comments/ (sci)
Thanks Gail & Matt for this very detailed and informative article.
A few thoughts:
From Figure 1, the blue color graph of usa and europe seems to show about the same 180 billion reserves through out the time between 1980 and 2006 (am i reading it right?). Why not decline in their reserves when in case of europe all the major discoveries such as norway and north sea were made before 1980 (am i right?) and in case of usa too we know that no big reserves are found after 1980? Same with fsu.
From Figure 11, Do BP data show information about oil only or also include oil equivalents that is NGL too? May be the small tick-up in production of 2006 is because of increasing NGL production.
The BP data seems to include NGL, but not NG.
The small uptick in 2006 may be a combination of things - the inclusion of Angola in this group instead of OPEC, greater NGL, and the depressed output in 2005 due to hurricanes. The total is close to level.
The reserve disconnect was addressed by the late L. F. Ivanhoe in 1996 in the first issue of The Hubbert Center Newsletter.
http://hubbert.mines.edu/news/Ivanhoe_96-1.pdf
or http://hubbert.mines.edu
Ivanhoe projection is almost exactly like what I'm saying.
Page 7 of the pdf.
Notice how you have the steep drop and long tail.
And you see by 2015-2020 or so your down 50%.
Cool :)
Why in Figure 6 is production at 30mmbbl/d (millions of barrels per day)?
Should this value not be in Gb/anum. It's my understanding that current crude oil production is around 85mmbbls/d
I think thats million million or Gb not million.
The left side is reserves, which is in Gb. The right side is production, which is in million barrels per day. MM is a thousand times thousand, or million. I usually spell out million. Matt uses MM.
You are right, spAde, the legend on the right hand side in Fig. 6 should show Gb/annum.
Gail will correct it.
The graph has now been fixed to show Gb per year on the right axis.
Many thanks for the post by Gail and Matt. I am so impressed with the intelligence and dedication you people show in chipping away to uncover the true picture. It is such a contrast with the facile contributions of the majority of the energy correspondents in the MSM. I would have thought at least some of them would have a minimal sense of curiosity about what is actually happening.
I recently rediscovered a paper which made a huge impression on me when I first read it at the beginning of the 1970s. It was called "The Future of Oil" by Harry Warman and was published in the Geographical Journal in September 1972. Warman was BP's Chief Geologist at the time. He had bought into the Hubbert analysis and supported it with his own geological experience. He was a very interesting early peak-oil proponent.
I have often wondered what happened to Warman and his ideas. The actual details of his work may only be of historic interest now but they represent another tragically missed opportunity. I have an impression that BP was nearly a great company. But at present, under the money-men there would be little to regret in its passing.
I would be interested in getting that paper and trying to transcribe it. Some of the papers from the early 1970's have mucho insight.
Don't, repeat, do not rely on the MSM to suddenly 'see the light' and begin to write stories about Peak Oil, it's origins and consequences. This is not what they are there for. It isn't about uncovering the 'truth' or describing what's really happening. That is part of MSM mythology, the formal rationale and justification for their existance. Unfortunately 'reality' is quite different and depressing. The MSM is an integrated part of a system that serves the interests of a privilidged elite, and disproportionally reflects, presents and protects, elite interests, values and attitudes. Basically the media 'manufactures consent' as Chomsky would say.
On a whole range of issues the media and journalists aren't curious or really interested in 'what's really happening' at all. They do not challange the fundamental assumptions relating to the basic structure and values of our society. They do the opposite. The MSM is really soviet style propaganda designed to obscure rather than inform or enlighten. Propaganda in the service of power.
May I ?
Energy = Power = Politics = Smoke&Mirrors
Add infinitum add nausea ...
Cheers
Sun
It would seem that you folks, esp khebab and memmel, have a good feel for what the rectified numbers are. It may be useful to "put out" your own pseudo-report on the whole global reserves / production situation. Don't refer to other organizations numbers in this psuedo-report, defudge the numbers to the best of your abilities and draw up a report based on those numbers, go the full monty and register an organisational name "Association for the Realistic Presentation of Oil Future: ARPOF, rip the format of EIA et al in your stationary, hook up with some fringe journo, go on television, nice suit, brillcream, lapel badges. Get on South Park. Change the World.
Pictures from home:
The Transperth 206 is carrying approx 100 persons at 140 kmh, The Cooper is carrying one person at 100 kmh.
I'm not sure I have a realistic number it all depends on what the truth is.
And this needs data transparency.
However the potential for steep declines post peak is decidedly non zero.
Simmons assigned a 25% chance for TSHTF scenarios. I'm at about 75%.
Even if its only 10% probable considering the effect steep declines would have on our civilization its worth it to force the world to become transparent on its oil supplies.
Ivanhoe's paper as I commented has almost exactly the curve I deduced.
http://www.theoildrum.com/node/3664#comment-312850
Note this is not a lot different from Bakhtiari's prediction which has been the best performing one to date.
http://www.theoildrum.com/node/2143
Maybe get Ivanhoe's paper and replicate the work ?
It would be neat too use a version of the shock model and a HL analysis.
But this gets back to the current paper and a whole stream of peak oil papers that have repeatedly questioned the reserve numbers. They just are not plausible.
Its a pretty safe bet you can cut out the 300GB addition by OPEC but even then its probably still inflated by quite a bit.
We can be fairly certain that our reserves of easily producible oil are about 1250-1500 barrels. We have produced I think 1130 by now. Which puts us at 90% depleted of easily producible oil. This is inline with what the world water cut should be about now.
I'd like to see WHT, Kehbab, Stuart etc the serious modelers take a look. If nothing else a review of Ivanhoe's paper has merit you don't have to believe me.
But if this is right then so what ?
Its already to late to do anything about it via a political process.
I wish I had been peak oil aware in 1996 and read Ivanhoe's paper but given his prediction about the only thing to do is focus on West Texas's ELP and local electric rail/trolley car infrastructure.
I'm interested in knowing if I'm right or not since I'm pretty proud I was able to deduce the same conclusion as Ivanhoe on my own. But other than that I think its too late to do much but focus on yourself and immediate community.
Think global act local. Buy manure and garden tools.
Thanks for the link to Ivanohe's projection:
I was not aware of that work, his result seems similar to the shock model:
A quick and dirty overlay indicates significant differences on the discovery curve:
Unfortunately, the paper does not contain enough details. In particular, I don't understand the breaking point in 2012, why 2012?, the decline afterward seems to follow the decline in smoothed discovery curve. Another problem is that he's not talking about reserve growth and unconventional oil sources (tar sands) which are likely to make the decline post peak less steep.
My best guess as to why the break point is he is assuming that production can be maintained up to some depletion percentage at that point you have enough regions going into steep decline that you get a steep drop off. Eyeballing the area it looks like the break is around 70-80% produced.
Its interesting to me at least that he also a asymmetric curve.
Another important point which I brought up in my other post is he has the peak production rate much higher than Hubbert predicted for the world but has simply made the curve asymmetric.
A breakpoint like that has to be caused by an economic discontinuity of some sort. Any stochastic factors applied cannot by themselves create a discontinuous change in slope. How Ivanhoe could then have predicted that specific breakpoint years in the future is puzzling.
(it really has the look of a curve that was swagged for dramatic effect)
Its common is the prescription drug market.
http://www.altruists.org/static/files/wizom16%20-%20There's%20a%20Generic%20in%20my%20Sharkfin%20Soup.htm
And here also
http://www.icmrindia.org/casestudies/catalogue/Business%20Strategy/BSTR2...
Its also a good model for respiration.
http://erj.ersjournals.com/cgi/reprint/7/2/318.pdf
http://capno.chez-alice.fr/theory.htm
Basically the underlying premise is that the system reaches a saturation point followed by a swift decline.
The physical process of respiration is not all that different from oil extraction. One is effectively movement of air in a sponge with extraction and the other is movement of oil in a sponge with extraction.
Respiration is a very efficient extraction process thus it makes sense that as we continue to increase our efficiency and we have the same finite volume constraint that oil extraction would approach the same curve as respiration.
What's missing from our two-dimensional graphs (and 1 input model) is the exponential population growth multiplied by internet driven "demand" for higher standard of living and inability of infrastructure at some point to keep delivering it. Think Dubai.
That missing part (the Black Swan) of the model might drive Westexas' ELM projections over a cliff. Exponential internal consumption growth in an export land (ELM) and collapse of that society & its production infrastructure swamps the normal production trajectory. Think Iraq. How is its actual production matching with model predictions?
However, there is nothing magical about year 2012. Breakdown could happen tomorrow.
The main point is that there are unseen effects (above-ground factors) that can easily cause the simple production model to break down due to infrastructure collapse.

Just to the left of the overpass in the picture, about 1/4 mile downriver on the far bank, is the site of the past Conoco Minneapolis river terminal where I started my career. Spooky, very spooky to me, no idea how many times I had passed over that bridge.
After a several year hiatus, I now am doing work for a major oil company again, sigh. I promise not to become a shill...
What's even spookier is how quickly national attention shifted away from the bridge collapse.
Remember all the noise that national leaders made the day it happened?
By golly, we're going to inspect!
We're going to inspect in the hills.
We're going to inspect on the beaches.
We're going to inspect so much that Winston Churchill will look like a church mouse.
So what happened?
A lot of talk and no walk.
A lot of hat and no cattle.
Our "Yes we can/will" infra-structure has already collapsed. We just don't see it yet.
Understanding of peak oil can by itself have a huge impact. Once lenders understand peak oil, they will be much less willing to make 20 or 30 year loans. Exporters will be much more interested in hoarding what they have. There is likely to be a big popping of the debt bubble that has built up over the years. The impact on oil production, and all kinds of manufacturing, could be quite dramatic.
There is also the point when food supply exceeds demand. This will send prices through the roof, and wreck financial markets. Without financial markets, it may be difficult to finance big difficult-to-produce sites like Brazil's Tupi.
the graph doesn't support the idea of an imminent crunch. If you shade the area between the 2 lines before they cross, and compare it to the area after they cross until 2010 the former area is a lot bigger. On this graph you wouldn't expect a crisis until around 2040.
Not sure what your trying to say. The key is production rates not overall area.
No one is arguing we are not going to be able to extract quite a bit of oil for a long time. Even if production starts to slow at later stages say 80% URR you still have 20% of all the oil ever produced left.
The thesis is that if you can "over produce" or get very efficient in your extraction process then you get a efficiency curve similar to respiration or patent/generic drugs.
I'd argue the reverse makes more sense to people who are skeptical. If we are not on one of these high efficiency shark fin like curves now then price will ensure we enter one. Thus if we are around 50% urr as most people claim we should be able to hold close to the production rate out to 2030 or so and Cera is correct.
I just don't see symmetric arguments as correct. I think this has the right form but the big question is how much oil do we really have. Given the curve and the fact we hit plateau now and the fact we have made tremendous advances in technology I'd argue that it means we are well past the 50% URR mark. Otherwise technical advances and simply working harder should have kept oil production increasing.
I don't follow. One thing common between the Ivanhoe prediction and my model is that we both make a point that the areas underneath the discovery and production curves always equate. I cannot vouch that he did not make any mistakes, but I double and triple-checked my results to make sure that the equivalence identity held between the curves.
Can't tell if this is a reply to me or not. But yes the areas are equal by definition. Just Ivanhoe shows a lot lower reserve level and is showing what I call technical overextraction leading to asymetric production.
The comment was for "weatherman". The model discovery curve is higher because it uses more backdated data, and assumes worst case statistics which acknowledges that large fluctuations could occur.
Travel time Mandurah - Perth - Rail 48 mins, Car 68 mins (morning peak).
Watched that mini movie "The Story about Stuff", that I found linked @ TOD recently.
It is a really good public presentation. That short, lighthearted, to the point approach is a real refresher.
Has anything like this been done for peak oil.
When Louis de Susa posted a multimedia presentation @ TOD the other day there were quite a few people in comments willing to pitch in to put multimedia productions together, myself included.
Go forward, move ahead, try to correct it, it's not too late, to whip it, whip it good.
My latest on unifying reserve growth with discoveries:
http://mobjectivist.blogspot.com/2008/03/creaming-curves-and-dispersive....
The Use-it and Luz-it comic strip here

Question: Is this the way Gail started her career? :-)
Nice comic! Maybe my second career. I have been an actuary a long time.