Peak Oil Update - January 2007: Production Forecasts and EIA Oil Production Numbers
Posted by Sam Foucher on January 15, 2007 - 11:00am
An update on the last production numbers from the EIA along with different oil production forecasts.
 and various forecasts (2001-2027)")
World oil production (EIA Monthly) and various forecasts (2001-2027). Click to Enlarge.
What's new:
- Michael Smith from the Energy Institute (World, CO+NGL, 2006)
- Michael Smith (Saudi Arabia, 2006)
A French version is also available on TOD:Canada here.
A pdf version of this article is available here.
Notations: ")
Fig 1.- World production (EIA data). Click to Enlarge.
Table I - Production estimate
(in millions of barrels per day (mbpd)) for October 2006 taken from
the EIA website (International
Petroleum Monthly). 1Moving Average
on the last 12 months.
The cumulative change in production estimates are shown on Figure 2. The 2005 annual production for all liquids has been revised up by 0.5 mbpd since first estimate. NGPL estimates increased. CO+NGL production has been revised down for 2006 so far.

Fig 2.- Cumulative change in production numbers since first estimates are issued for each month. Click to Enlarge.
The share of CO is now only 86.68% of the total liquid production.

Fig 3.- Share of each liquid category to the total liquid production. Click to Enlarge.
 and various
forecasts (1940-2050)")
Fig 4.- World oil production (Crude oil + NGL) and various forecasts (1940-2050). The light gray box gives the particular area where the Figures below are zooming in. Click to Enlarge.

Fig 5.- Production forecasts assuming no visible peak. Click to Enlarge.

Fig 6.- Forecasts by PeakOilers based on bottom-up methodologies. Click to Enlarge.

Fig 7.- Forecasts by PeakOilers using curve fitting methodologies. Click to Enlarge.

Fig 8.- Year-on-Year production growth. Click to Enlarge.
Table II. Summary of all the
forecasts (figures are in mbpd) as well as the last EIA estimates.1Productive
capacities.
I've added a simple domestic consumption forecast based on a population forecast by the UN and a constant number of barrels per capita at (see here for details). In order for exports to remain at their 2005 level and assuming the aforementioned consumption model, production needs to grow by (orange dotted line on the charts).
 and various
forecasts (2001-2020)")
 and various
forecasts (2001-2020)")
Fig 9.- Saudi Arabia oil production (EIA Monthly) and various forecasts (2001-2020). The EIA estimate is a productive capacity (PC). Click to Enlarge.
Table III. Summary
of all the forecasts (figures are in mbpd) as well as the last EIA
estimates.1Productive capacities.
November 2006
October 2006
September 2006
- mbpd= Millions of barrels per day
- Gb= Billions of barrels (109)
- Tb= Trillions of barrels (1012)
- NGPL= Natural Gas Plant Liquids
- CO= Crude Oil + lease condensate
- NGL= Natural Gas Liquids (lease condensate + NGPL)
- URR= Ultimate Recoverable Resource
EIA Last Update (October)
Data sources for the production numbers:
- Production data from BP Statistical Review of World Energy 2006 (Crude oil + NGL).
- EIA data (monthly and annual productions up to October 2006) for crude oil and lease condensate (noted CO) on which I added the NGPL production (noted CO+NGL).
The All liquids peak is now July 2006 at 85.49 mbpd (previously May 2006 at 85.21 mbpd), the year to date average values in 2006 (10 months) are down from 2005 for all the categories except for the total liquids which now equals 2005 production. The peak date has changed for Crude Oil + Cond. and is now May 2005 at 74.15 mbpd (see Table I below).
")
Fig 1.- World production (EIA data). Click to Enlarge.
| Category | Oct 2006 | Oct 2005 | 12 MA1 | 2006 (10 Months) | 2005 (10 Months) | Share | Peak Date | Peak Value |
|---|---|---|---|---|---|---|---|---|
| All Liquids | 84.79 | 84.87 | 84.60 | 84.56 | 84.56 | 100.00% | 2006-07 | 85.49 |
| Crude Oil + NGL | 81.49 | 81.60 | 81.41 | 81.37 | 81.41 | 96.12% | 2005-05 | 82.08 |
| Other Liquids | 3.29 | 3.27 | 3.18 | 3.19 | 3.15 | 3.88% | 2006-08 | 3.54 |
| NGPL | 8.00 | 7.77 | 7.86 | 7.90 | 7.85 | 9.43% | 2005-02 | 8.05 |
| Crude Oil + Condensate | 73.50 | 73.83 | 73.55 | 73.47 | 73.57 | 86.68% | 2005-05 | 74.15 |
Revision Pattern
The cumulative change in production estimates are shown on Figure 2. The 2005 annual production for all liquids has been revised up by 0.5 mbpd since first estimate. NGPL estimates increased. CO+NGL production has been revised down for 2006 so far.

Fig 2.- Cumulative change in production numbers since first estimates are issued for each month. Click to Enlarge.
The share of CO is now only 86.68% of the total liquid production.

Fig 3.- Share of each liquid category to the total liquid production. Click to Enlarge.
 and various
forecasts (1940-2050)")
Fig 4.- World oil production (Crude oil + NGL) and various forecasts (1940-2050). The light gray box gives the particular area where the Figures below are zooming in. Click to Enlarge.
Business as Usual
- EIA's International Energy Outlook 2006, reference case (Table E4, World Oil Production by Region and Country, Reference Case).
- IEA total liquid demand forecast for 2006 and 2007 (Table1.xls).
- IEA World Energy Outlook 2006 : forecasts for All liquids, CO+NGL and Crude Oil (Table 3.2, p. 94).
- IEA World Energy Outlook 2005 : forecast for All liquids (Table 3.5).
- IEA World Energy Outlook 2004 : forecast for All liquids (Table 2.4).
- A simple demographic model based on the observation that the oil produced per capita has been roughly constant for the last 26 years around 4.4496 barrels/capita/year (Crude Oil + NGL). The world population forecast employed is the UN 2004 Revision Population Database (medium variant).
- CERA forecasts for conventional oil (Crude Oil + Condensate?) and all liquids, believed to be productive capacities (i.e. actual production + spare capacity). The numbers have been derived from Figure 1 in Dave's response to CERA.

Fig 5.- Production forecasts assuming no visible peak. Click to Enlarge.
PeakOilers: Bottom-Up Analysis
- Chris Skrebowski's megaprojects database (see discussion here).
- The ASPO forecast from the last newsletter (#71): I took the production numbers for 2000, 2005, 2010, 2015 and 2050 and then interpolated the data (spline) for the missing years. I added the previous forecast issued one year and two years ago (newsletter #58 and #46 respectively). There was no revision since August 2006.
- Rembrandt H. E. M. Koppelaar (Oil Supply Analysis 2006 - 2007): "Between 2006 and 2010 nearly 25 mbpd of new production is expected to come on-stream leading to a production (all liquids) level of 93-94 mbpd (91 mbpd for CO+NGL) in 2010 with the incorporation of a decline rate of 4% over present day production".
- Koppelaar Oil Production Outlook 2005-2040 - Foundation Peak Oil Netherlands (November 2005 Edition).
- The WOCAP model from Samsam Bakhtiari (2003). The forecast is for crude oil plus NGL.
- Forecast by Michael Smith (Energy Institute) for CO+NGL, the data have been taken from this chart in this presentation (pdf).

Fig 6.- Forecasts by PeakOilers based on bottom-up methodologies. Click to Enlarge.
PeakOilers: Curve Fitting
The following results are based on a linear or non-linear fit of a parametric curve (most often a Logistic curve) directly on the observed production profile:- Professor Kenneth S. Deffeyes forecast (Beyond Oil: The View From Hubbert's Peak): Logistic curve fit applied on crude oil only (plus condensate) with URR= 2013 Gb and peak date around November 24th, 2005.
- Jean Lahèrrere (2005): Peak oil and other peaks, presentation to the CERN meeting, 2005.
- Jean Lahèrrere (2006): When will oil production decline significantly? European Geosciences Union, Vienna, 2006.
- Logistic curves derived from the application of Hubbert Linearization technique by Stuart Staniford (see this post for details).
- Results of the Loglet analysis.
- The Generalized Bass Model (GBM) proposed by Prof. Renato Guseo, I used his most recent paper (GUSEO, R. et al. (2006). World Oil Depletion Models: Price Effects Compared with Strategic or Technological Interventions ; Technological Forecasting and Social Change, (in press).). The GBM is a beautiful model that has been applied in finance and marketing science (see here for some background). The estimation in Guseo's article was based on BP data from 2004 (CO+NGL).
- The so-called shock model proposed by TOD's poster WebHubbleTelescope . You can find a description of his approach on his blog here. The current estimate was done in 2005 based on BP's data.

Fig 7.- Forecasts by PeakOilers using curve fitting methodologies. Click to Enlarge.
Production Growth
The chart below gives the year-on-year production growth (or decline) for each month. Growth has been weak (below 1%) most of the year but went back in positive territory since last July.
Fig 8.- Year-on-Year production growth. Click to Enlarge.
| Forecast | 2005 | 2006 | 2007 | 2010 | 2015 | Peak Date | Peak Value |
|---|---|---|---|---|---|---|---|
| All Liquids | |||||||
| Observed (EIA) | 84.56 | 84.56 | NA | NA | NA | 2006-07 | 85.49 |
| Koppelaar (2005) | 84.06 | 85.78 | 86.61 | 89.21 | 87.98 | >2011 | >89.58 |
| EIA (IEO, 2006) | 82.70 | 84.50 | 86.37 | 91.60 | 98.30 | >2030 | >118.00 |
| IEA (WEO, 2006) | 83.60 | 85.10 | 86.62 | 91.30 | 99.30 | >2030 | >116.30 |
| IEA (WEO, 2005) | 84.00 | 85.85 | 87.64 | 92.50 | 99.11 | >2030 | >115.40 |
| IEA (WEO, 2004) | 82.06 | 83.74 | 85.41 | 90.40 | 98.69 | >2030 | >121.30 |
| CERA1 (2006) | 87.77 | 89.52 | 91.62 | 97.24 | 104.54 | >2035 | >130.00 |
| Lahèrrere (2006) | 83.59 | 84.82 | 85.96 | 88.93 | 92.27 | 2018 | 92.99 |
| Lahèrrere (2005) | 83.59 | 84.47 | 85.23 | 86.96 | 87.77 | 2014 | 87.84 |
| Smith (2006) | 85.19 | 87.77 | 90.88 | 98.94 | 98.56 | 2012-05 | 99.83 |
| Crude Oil + NGL | |||||||
| Observed (EIA) | 81.45 | 81.37 | NA | NA | NA | 2005-05 | 82.08 |
| IEA (WEO, 2006) | 80.10 | 81.38 | 82.67 | 86.50 | 92.50 | >2030 | >104.90 |
| ASPO-71 | 80.00 | 81.90 | 84.48 | 90.00 | 85.00 | 2010 | 90.00 |
| ASPO-58 | 81.00 | 82.03 | 83.10 | 85.00 | 79.18 | 2010 | 85.00 |
| ASPO-45 | 81.00 | 80.95 | 80.80 | 80.00 | 73.77 | 2005 | 81.00 |
| Koppelaar (2006) | 81.76 | 82.31 | 83.68 | 91.00 | NA | >2010 | >91.00 |
| Bakhtiari (2003) | 80.24 | 80.89 | 80.89 | 77.64 | 69.51 | 2006 | 80.89 |
| Skrebowski (2006) | 80.90 | 81.42 | 82.59 | 87.32 | NA | >2010 | >87.92 |
| Smith (2006) | 80.53 | 82.81 | 85.45 | 91.95 | 88.60 | 2011-02 | 92.31 |
| Staniford (High) | 77.45 | 77.92 | 78.31 | 79.01 | 78.51 | 2011-10 | 79.08 |
| Staniford (Med) | 75.81 | 75.94 | 75.97 | 75.52 | 73.00 | 2007-05 | 75.98 |
| Staniford (Low) | 70.46 | 70.13 | 69.71 | 67.92 | 63.40 | 2002-07 | 70.88 |
| Loglets | 81.12 | 82.14 | 83.02 | 84.65 | 83.26 | 2012-01 | 84.80 |
| GBM (2003) | 76.06 | 76.27 | 76.33 | 75.30 | 67.79 | 2007-05 | 76.34 |
| Shock Model (2006) | 80.76 | 80.43 | 80.01 | 78.27 | 73.74 | 2003 | 81.17 |
| Constant barrels/capita | 78.81 | 79.73 | 80.66 | 83.42 | 88.01 | 2050 | 110.64 |
| Crude Oil + Lease Condensate | |||||||
| Observed (EIA) | 73.65 | 73.47 | NA | NA | NA | 2005-05 | 74.15 |
| IEA (WEO, 2006) | 70.80 | 71.78 | 72.77 | 75.70 | 80.30 | >2030 | >89.10 |
| CERA1 (2006) | 76.49 | 76.89 | 78.60 | 82.29 | 83.83 | >2038 | >97.58 |
| ASPO-71 | 73.10 | 74.45 | 75.87 | 78.00 | 72.00 | 2010 | 78.00 |
| ASPO-58 | 73.00 | 73.80 | 74.65 | 76.00 | 69.50 | 2010 | 76.00 |
| ASPO-58 | 72.80 | 72.56 | 72.25 | 71.00 | 63.55 | 2005 | 72.80 |
| Deffeyes (2004) | 69.81 | 69.81 | 69.71 | 68.90 | 65.88 | 2005-12 | 69.82 |
Saudi Arabia
The Figure 7 below gives Saudi Arabia production for crude oil and NGPL (data from the EIA: Monthly Energy Review for CO and the International Petroleum Monthly for NGPL).- IEA World Energy Outlook 2006 : forecasts for CO+NGL and Crude Oil (Table 3.2, p. 94).
- IEA World Energy Outlook 2005 : forecast for All liquids (Table 3.5).
- EIA, International Energy Outlook 2006 : World Oil Production Capacity by Region and Country, Reference Case, High and low prices scenarios, 1990-2030 (Table E1, p. 155).
- Forecast by Michael Smith (Energy Institute) for CO+NGL, the data have been taken from this chart in this presentation (pdf).
I've added a simple domestic consumption forecast based on a population forecast by the UN and a constant number of barrels per capita at (see here for details). In order for exports to remain at their 2005 level and assuming the aforementioned consumption model, production needs to grow by (orange dotted line on the charts).
 and various
forecasts (2001-2020)")
 and various
forecasts (2001-2020)")
Fig 9.- Saudi Arabia oil production (EIA Monthly) and various forecasts (2001-2020). The EIA estimate is a productive capacity (PC). Click to Enlarge.
| Forecast | 2005 | 2006 | 2007 | 2010 | 2015 | Peak Date | Peak Value |
|---|---|---|---|---|---|---|---|
| Crude oil + NGL | |||||||
| Observed (EIA) | 11.01 | 10.71 | NA | NA | NA | 2005-04 | 11.06 |
| IEA (WEO, 2006) | 10.60 | 10.83 | 11.03 | 11.60 | 13.30 | 2030 | 17.30 |
| IEA (WEO, 2005) | 10.62 | 10.85 | 11.09 | 11.90 | 13.62 | >2030 | >18.20 |
| EIA Low Prices (IEO, 2006) | 11.79 | 12.45 | 13.11 | 14.40 | 15.01 | >2030 | >18.60 |
| EIA Reference Case (IEO, 2006) | 11.87 | 12.57 | 13.27 | 14.46 | 14.79 | >2030 | >17.10 |
| EIA High Prices (IEO, 2006) | 11.41 | 11.82 | 12.19 | 12.65 | 11.06 | 2010-01 | 12.70 |
| Smith (2006) | 11.16 | 11.39 | 11.78 | 14.08 | 14.38 | 2018-01 | 14.50 |
| Crude Oil + Lease Condensate | |||||||
| Observed (EIA) | 9.55 | 9.23 | NA | NA | NA | 1980-11 | 10.41 |
| Consumption | |||||||
| Cont. Barrels/Capita | 1.71 | 1.75 | 1.79 | 1.92 | 2.14 | 2050 | 3.43 |
Next update in February.
Previous Update:
December 2006November 2006
October 2006
September 2006
Khebab@theoildrum.com
![[-]](/images/thread_collapse.gif)


Consider this a reminder to positively rate this articles (using the icons under the tags in the story title) at reddit, digg, and del.icio.us if you are so inclined. (email me at the eds box if you have questions about this).
Also, don't forget to submit this to your favorite link farms, such as metafilter, stumbleupon, slashdot, fark, boingboing, furl, or any of the others.
I can assure you that the authors appreciate your efforts to get them more readers.
Khebab-very well done!
Figure 3 was very interesting -the total of all liquids that is actual crude oil has declined from 92% to 86% - most of this difference has been made up by natural gas plant liquids (which makes sense, seeing that we have ramped up Nat gas production since 1980). It would be interesting (though probably impossible) to take these numbers and look at the decline in net energy delivered to society - as presumably the 14% of total liquids that are now NOT crude oil or condensate, require more energy to create which is taken out of the total pie.
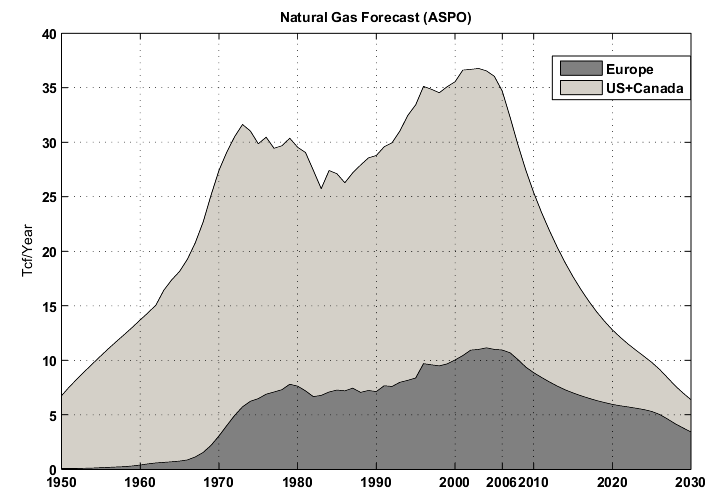
It will also be interesting to see the impact of NA gas cliff on the NGPL component - though the world as a whole may still get a good boost in this area.
Nice job (again)
But on a per capita basis it is surely declining. You know, Olduvai and all that Jazz…
Thanks Nate,
Re: as presumably the 14% of total liquids that are now NOT crude oil or condensate, require more energy to create which is taken out of the total pie.
Besides, it could be interesting to know how much diesel fuel has been used to produce ethanol which is counted in the "Other Liquids" category.
Re: It will also be interesting to see the impact of NA gas cliff on the NGPL component - though the world as a whole may still get a good boost in this area.
I agree, NGPL production is almost flat since February 2005 but seems to have increased a little bit lately.
Besides, it could be interesting to know how much diesel fuel has been used to produce ethanol which is counted in the "Other Liquids" category.
We discussed this some yesterday in another thread. The answer to this is 'not much'. The bulk of the energy input is derived from natural gas.
What else could have been done with the natural gas?
The number Austex came up with was 23% of the BTUs for a gallon of ethanol was from gas/diesel.
Unfortunatly he didn't save his work and only posted the results.
Last night after the fact I found this piece of analysis that I did not see the other day when I was trying to calculate the crude oil inputs. By far the most detailed and thorough piece of work that I've seen to this point. Many of the numbers are justified as well, which I did not see much of the other day. Check it out if you have time. It's few years old, but should still be fairly applicable to today's situation
http://www.ncga.com/ethanol/pdfs/energy_balance_report_final_R1.PDF
If you don't have time, in his conclusion (pg 55/56) it's stated that the makeup of btu's comes from 7.3% petroleum, 75.2% coal/natural gas, and 17.5% captured solar energy by the corn.
I'm thinking these percentages do not include transportation of feedstock and finished product which is why my conclusion came out with a higher percentage.
The link refers to the energy balance of corn ethanol. Until the recent foolish burst of subsidized ethanol production from the US, the single largest producer of ethanol was Brazil and it was done with 100% sugar cane.
Sources that I have frequently posted here cite energy balances of 8-10 from sugar cane-based ethanol rather than the 1.2-1.3 from corn.
So even if crude based inputs constitute 50% of the energy input into sugar cane based ethanol production, they woudn't be more than 5-6% of the BTUs in the final fuel.
So instead of double counting, in the case of sugar cane, it is more like + 5% counting. Biodiesel presumably comes somewhere in between.
I believe that the world could derive 5-10% of the BTU content in all liquid fuels from sugar cane without much damage to the environment (and ideally with improvement to health). This would be a significant offset to waning oil supplies and would have little actual oil content.
By the way, I think it makes sense to count and track both C & C figures as well as all (net) liquids, but for different purposes. C&C is the best measure of peak oil. All (net) liquids is the best measure for how mankind will cope with it.
'By the way, I think it makes sense to count and track both C & C figures as well as all (net) liquids, but for different purposes. C&C is the best measure of peak oil. All (net) liquids is the best measure for how mankind will cope with it.'
A succint and important point, well worth keeping in mind as the inevitable decline of crude production will lead to a number of different directions in how that reality is accepted, from starving those who can't pay for a tank of gas (based on the data that the corn required for one tank of vehicle fuel is equivalent to what one human requires for a year) to utopian visions of peaceful powerdown, or in the German expression, 'Frieden. Freude. Eierkuchen.' (a slightly nonsensical expression meaning 'Peace, Joy, and Pancakes' - or if you are from Berlin, then 'Peace Joy, and jelly filled Doughnuts' - sort of like 'happily ever after,' it tends to refer to something very desirable, but which will never really occur.)
Explain the basis of this belief, please. How much topsoil is lost annually to achieve this process? How much silting occurs annually to achieve this process? How much water table damage occurs annually to achieve this process? What level of salinization occurs annually? Under what population scenarios? Under what consumption scenarios?
Please provide the data for your conclusion, as I do not believe the statement you made.
Thank you.
I found that graph quite interesting as well. There has been a tendency for some to characterize the growth in 'All Liquids' as being much steeper and more recent than this graph displays. Although growing, All Liquids has obviously been a significant percentage for quite a while. I don't see the 'market forces' all the sudden kicking in here.
So far it looks like Bakhtiari gets the cigar for being the most accurate. His prediction, CO + NGL, made over three years ago, (3003) is now spot on. He predicted that the peak would be right now, well actually 2006, and so far it is.
Peak CO is still 2005 but it is so close we must say we are on the peak plateau. When we come off this plateau which way will we turn? Bakhtiari says it will turn down. That is my guess also.
Bakhtiari is an Iranian and knows more about Iran and the Middle East than anyone giving us reserve numbers today. Well, that is true in my opinion anyway. Others may to choose to believe the IEA or the EIA but one glance at the graphs above should instantly tell us how accurate we can expect their prediction may be. Only a Freddy Hutter would believe those absurd numbers.
Bakhtiari On Middle East Oil Reserves:
http://www.evworld.com/view.cfm?page=article&storyid=980
Ron Patterson
I forgot to add, Bakhtiari has the plateau lasting through 2007 and turning down in 2008. I think this is very significant. We cannot expect a sharp drop (or rise) anyway soon. As some nations peak, others are still increasing production, but only slightly. Russia, if not already peaked, is likely to peak in 2007. China is likely at peak. Of the major producers, other than Russia only Brazil, Angola and the Caspian area are yet to peak. Canada is a big question mark. I think they will likely increase production but so slowely it will have little or no effect on the peak date.
Ron Patterson
This is why I feel that the ongoing debate between WT and RR is irrelevant. Maybe there will be a new high in the next year or so or maybe there won't. But it will not be sustainable and will be overtaken relatively quickly by declines in other world producers. Let's wait and see, but it is really only a technical point IMHO.
As I noted down the thread, the midpoint between Deffeyes' most likely pick for the world peak and Robert's earliest pick for the world peak is about five months away--July 1, 2007.
This is why I feel that the ongoing debate between WT and RR is irrelevant.
You would be correct if what we were debating is the peak date. It is not, but those who believe it is see the debate as essentially nitpicking.
The debate, from my perspective, is about the quality of data you use to support your argument, and how well that data withstands scrutiny. I will leave it at that.
Except that WT model implies that the treadmill of depletion is speeding up as the giants peak and decline. This leads to a small cliff off the peak plateau as the decline rate of the giants have a large impact on production.
This mini cliff will have huge repercussions economically.
In later posts you mention that we have handled the peaking of various giants with increased production form other sources but the problem is the timing I don't think we can handle ghawar/canterell collapsing in the end 2007/2008 time frame along with worldwide depletion.
To me this post plateau dip is the important issue. WT implies a big drop you disagree. A 14% decline or better from both Ghawar and Canterell at the same time cannot be made up in the time span IMHO. And its this initial roll off peak which is the most critical.
"...I don't think we can handle ghawar/canterell collapsing in the end 2007/2008 time frame along with worldwide depletion."
Why not? Gas will become expensive and people will drive slower, less and buy smaller cars. That alone can reduce gas consumption by 10% in the US, if necessary. We are not looking at 20% annual decline but at a few percent initially and 5-10% later. As world oil consumption declines, a new equilibrium between price and utility function of oil will be found. Currently the utility of most of the oil we burn in the US is 0. We burn it to make us feel better about ourselves by driving a larger than necessary vehicle. I bet that the average consumer can replace one gallon of gas with one dose of Viagra and probably not notice the difference. Or, maybe, he will notice the difference. Viagra will actually give him the better erection the SUV ads promised.
At current prices, one dose of Viagra costs considerably more than a gallon of gasoline -- however you want to factor that into your argument...
Don't forget to calculate the utility of Viagra vs the utility of a gallon of gasoline. Viagra gives an old guy an erection, gasoline does the same for the young male.
Pfizer is applying to have Viagra sold over-the-counter. This should allow them to drop the price somewhat as they are anticipating huge sales increases (pun intended).
I was more thinking about the energy required to produce one dose of viagra. I bet it can be done for less than one tenth of a gallon worth of gas. Pharmaceutical chemists are welcome to give us an estimate of the net energy required to make sildenafil citrate.
The direct energy needed to make the actual tablet might be small, but when you include the entire energy utilization chain: employees, food, transport, r&d, packaging, etc, its probably in the several gallons per viagra tablet.
I wonder what the half-life of that stuff is.....
This makes no sense to me; if it took more than two gallons of gasoline to deliver a tablet of a drug, the drug would have to cost more than than two gallons of gas (and there are numerous other costs involved, plus a large profit). Since it doesn't, it can't be requiring that much gasoline to produce. Generic viagra (not legally available in the US, yet) costs a small fraction of what the branded product does, so we can be pretty sure that the energy is much less than that.
In Stuart's thread of Dec 8, the point was made that price increases in the last few years haven't reduced consumption significantly. In order for price to really affect consumption, first it has to be high enough to really hurt. Since 3.5% of our typical budget now is spent on motor vehicle fuel, and 15% of our vehicle expenses are fuel, it would require a pretty big jump. It needs to be combined with a recession, and there needs to be an expectation of continuing shortage. Political leadership is also a factor.
There may be 'stealth' effects over a period of time with higher gasoline prices that don't show up in immediate consumption figures. Families have to spend a continuously larger portion of their discretionary budget on gasoline and probably run up the credit card balances even more. And spending elsewhere will be cut down, all leading to greater chance of recession which would definitely cause a slowdown in gasoline consumption. You would get sort of a 'slingshot' effect with a buildup in the economy of pressure from the higher gasoline prices, resulting in no immediate drop in consumption, but the whole economic machine would eventually falter.
It's already been tabulated and hasn't changed since last month. $10/barrel increase or decrease in oil affects Real GDP 0.45% over 24 months.
All I can say is your not considering the impact on the third world and resulting political fallout.
A fairly sudden and continued increase in price caused by the elimination of any spare capacity will not be easy to deal with.
The effect of the WT model is that we will run into a situation that leaves us no spare capacity at best and at worst a real shortage of a few mbd compared to normal demand. The result is a price spike followed by nominally high and destructive oil prices along probably with the dawning understanding that peak oil is real.
Getting the masses to believe in addressing peak oil while we have time to mitigate is a good thing while even the chance of the world suddenly becoming peak oil aware because we are really post peak is not good.
Thats the big reason I believe in addressing peak oil earlier than later.
Mitigation needs to start today not when the world believes peak oil is imminent. Even the most optimistic analysis puts peak oil within 30 years
half this for safety and we would have 15 years to wean ourselves of oil.
Even with this its time to start working on moving away from a oil based society.
Its a chicken and egg problem if we start to seriously work on moving away from oil I think that we can and will get good numbers on remaining reserves.. And this will of course give us a clear picture on the time we have to transition. The reasoning is that the first step in mitigating peak oil will be to of course force all oil producers to become transparent.
If we don't then we won't get real numbers until peak is blatantly obvious.
I doubt that educational efforts to explain PO will have any lasting or even significant effect on consumer behaviour. As long as fuel is cheap - and right now fuel is still very cheap - most people will not abstain from buying oversized cars. I did point out in other posts that people I know and work with follow consumer patters with anti-correlation between income and vehicle mass/engine volume. The more educated they are, the more efficient cars they drive. But this is probably mostly motivated by the need of PhDs to send their kids to expensive schools (and thus moderate all their other expenses) rather than an insight into the workings of PO. There is considerably less moderation on the side of people with far more limited incomes who would actually profit more from conserving fuel and their income.
The driving factors in the US as well as in Europe (and I would assume Japan) towards higher fuel efficiency are fuel price and regulations, not insight and rational response to foreseable events. I don't see any serious efforts in the US to limit waste outside of a few state settings (like CA) but even those fall far short of efforts in Europe. I also don't expect a $/gallon tax hike on transportation fuels which is the least that would be required to save tens of billions of dollars which need to be invested in effective fuel economy measures. The US had a hard landing with vehicle economy in the 70s and it is waiting for another hard landing now. Just like then, there are plenty of automobile companies waiting to supply the burn victims with soothing economy models to reduce the pain. Just like then the US industry will implode on its own failings. I am sure they have greased enough politicians already to bail them out.
I agree, so far Bakhtiari's forecast has the best performance (in terms of number of predictive years and quality of the fit). Also, surprisingly, the old ASPO forecasts (ASPO-46 and 58) are quite good for CO.
I agree with this assessment. I had mentioned after Khebab's post a couple of months ago that Bakhtiari's curve looked the best fit. At the moment it looks like 2007 might be a "quiet" year for peak oil with low prices for much of the time dampening public and political concern. As long as KSA and OPEC can get away with saying that they are "voluntarily" limiting production to prop up prices, many people who don't want to accept the peak oil argument, won't.
As previously posted on TOD Europe, I think the real fun and games will come next year (maybe in the second half of the year), as we start to come off plateau, prices rise, economies struggle to cope and OPEC (maybe) can't get the output up to control them. Then watch financial markets, the $ and real estate prices tumble.
Hi Ron,
Bakhtiari’s model is quite apart from the other for it includes economic constraints resulting in an earlier peak. By 2003 the soon-coming cycle of deep-offshore production was still very unclear and I believe was hardly well incorporated in WOCAP, thus I think a new run with present data would probably give different results. Lets hope Bakhtiari does so, as he indicated some time ago.
Freddy is a very important member of this forum, that kind of comments not only fail to recognize that but also diminish the level of openness of the debate.
I agree Luis, but everytime Freddy replies to one of my posts his comments are far worse than anything I could possibly dream up.
The above degrading comments are typical of Freddy Hutter and I was still stinging from them this morning. And that is why I took off on Freddy. However if you could possibly persuade this very important member of this forum, to be a little more civil, then I would be very glad to do likewise.
Ron Patterson
Hey Ron, don’t try to justify something bad with another bad thing.
If you don’t like Freddy’s conduct, you shouldn’t repeat it on the first place. If every one did so this would be a very sad forum.
Freddy is well known for his excessiveness. Like everyone does with the Oil CEO / Hugo Chavez / James Bond character, why don’t you just ignore Freddy when he looses it?
We didn't just ignore him.
We banned him.
Thank you!
And you acted correctly BUT now he is back. Same as before but just a tad less offensive. Not much but a tad.
Isn't InfinitePossibilities just as bad? When are you banning him?
Huh? You're kidding, right? I haven't been around all that long but InfinitePossibilities seems to be one of the more rational and objective posters here. Unlike most, he seems to have at least a basic grasp of economics, something more peak oilers would do well to emulate.
My impression that the reason so many people have such a big problem with Hothgar and Infinite Possibilities, and not with I'm Skeptical, for example, is ideology.
We are shocked when a commenter insults someone we agree with, but cheer the same behavior when it is done against someone we don't.
Frankly, I do think some of the commenters whose only role here seems to be insults should be reprimanded privately first, then banned.
But we should encourage disagreement, avoid groupthink and not censor people by banning or insults. I do think a lot of people with differing viewpoints have been chased away by hostile commenters, many of whom don't ever contribute much intellectual product themselves.
I think some of my favorite commenters here are people I frequently disagree with and would sadly have to abandon TOD if it became a one sided choir.
It's my impression that ImSkeptical has an ideology similar to Hoth and IP.
I think the problem is not ideology, but social skills. If you're rude, people will take offense. Kevem is a doomer, but he's not popular here, either, because he's rude.
I think the problem is not ideology, but social skills
>> Or maybe both.
It's my impression that ImSkeptical has an ideology similar to Hoth and IP.
>> How about any poster whose posts are so predominantly insulting that we can't even tell what their ideology is, gets banned?
Freddy also referred to Kenneth Deffeyes and Matthew Simmons as "Scumbags."
There are a lot of terms I would use for people that describe Deffeyes and Simmons as "Scumbags," but "very important" is not one of them.
These gentlemen certainly have credentials and are well spoken. But IMHO, it is disgusting for them to use their notoriety and misinformation to imply a Peak that has not happened and is not going to happen in the near future. IEA has published new monthly, quarterly and annual Supply records for 2006.
There are media reports circulating that Simmons takes the subject further and infers immenent economic Depression on the short term. They may or may not be wrongly attributed but they are out there.
It also troubles me that both at times seem to use the narrow definition of C&C to allow them wiggle room to hype the MSM reporting at conferences etc that the globe has Peaked. It misrepresents the marketplace and causes confusion and cynicism.
They are both irresponsible and know better.
M King Hubbert got it wrong in the 1976 National Geographic. A 1995 Peak at 110-mbd. Colin Campbell is infamous for upward revisions. Todays Peak Oil awareness efforts do not need two idiots "crying wolf". And one has to question their motives and character.
With a little care and due diligence, the problems ahead surrrounding Peak Oil can be laid out w/o the ties to dieoff, fiat currency and economic collapse that abounds in Peakster promotions.
It is fortunate that MSM has degraded to tabloid style journalism of late and has been a willing partner in exposure of the apocalyptic scenarios. It may fool the consumer and gullible. But decision-makers, govt's and stakeholders will simply dismiss the topic and its apparent junk science...
With a little care and due diligence, the problems ahead surrrounding Peak Oil can be laid out w/o the ties to dieoff, fiat currency and economic collapse that abounds in Peakster promotions
I think it's unfortunate that people have gotten involved in the debate that are unobjective. People have been calling for the collapse of civilization since it began.
Logical people can see through these arguments and dismiss these people as idiots, and rightfully so. Unfortunately, the real issues regarding the possibility of peak liquids get dismissed by most people since the premise is currently connected to these idiots
Well, another who thinks Simmons and Deffeyes are itiots. Actually I don't think Simmons and Deffeyes are predicting the end of civilization as we know it.
That being said, is that the best you guys can do. That is, to call us guys who predict that the decline of fossil fuels will cause a subsequent decline in the population of humankind idiots? Is that idiocy?
One good argument is worth a thousand vile names. Instead of calling us vile names, please just answer our arguments instead! My argument can be found here: http://dieoff.org/page137.htm Either answer it or shut up! At least please treat those who disagree with you with a little respect instead of calling us idiots, scumbags or frauds.
Ron Patterson
Are you going on record and stating that Simmons and Deffeyes are predicting civilization collapse and and a mass dieoff? Please post the link as I have not seen them say this.
Or more likely, are you just attempting to twist my reply into implying that I'm referring to Simmons and Deffeyes?
Damn! Man read what I said. I said, (cut and pasted from my post):
But you say you have seen them say this. I have not! But I am predicting that but not based on anything Simmons or Deffeyes said or wrote. I am predicting that based on forty years of studying the overpopulation problem, reading about one hundred books on the problem, and a hundred or so other reasons. Three great references come to mind. "Overshoot" by Catton, "The Spirit in the Gene" by Morrison and "Energy and Human Evolution" by David Price: http://dieoff.org/page137.htm
You can read Price's essay in less than 20 minutes. If you are too lazy to do that then please don't bother me anymore with your unfounded faith.
Ron Patterson
Dude, whatever. I was NOT referring to these two guys as idiots, and you know it.
I'm done responding to you. Good night.
Why am I not surprised? At least I do read both sides of the problem. I have read Bjorn Lomborg's "The Skeptical Environmentalist". I have read Julian Simon's "The Ultimate Resource". I read web pages, much longer than Price's essay, daily who think peak oil and us doomers are all wet, every day. I read both sides of the argument. People who read only one side of the argument cannot possibly make a logical argument for their position. They cannot because they are totally ignorant of the real problem.
As I said it would take only about twenty minutes to read Price's essay. I can understand that you are not willing to read a whold book, though people who truly wish to understand both sides of an argument find that absolutely necessary. But to be so just damn lazy as not to read a 20 minute essay outlining the position opposite to yours is absoluely unbelievable. You MUST shut out from your mind any and all opposing positions. You will hear no opinion that contridicts your own.
Ron Patterson
Wow man. I posted that comment, read it, realized it was rude, and changed it. It must have been up for what, all of 30 seconds or so......... Do you hang around TOD all day hitting the refresh button on your browser every 15 seconds?
As far as the dieoff literature is concerned, I’ve read it already.
Will humans dieoff? Of course, they die everyday. There are millions starving in the world right now. It’s likely to get worse as peak forces the more fortunate to spend more of the available resources fending for themselves.
Will the human population collapse? If a catastrophic event occurs, quite possibly. I don’t they will because of peak oil. To think that people in industrialized nations will sit around waiting for death while doing nothing is naïve. Because of fear, greed, etc, they will evolve processes in order to sustain themselves.
Beyond these facts, I believe connecting the issue peak with dieoff and civilization collapse and presenting this to the masses is a foolish strategy that will have you labeled and dismissed quickly.
Now I really am moving on as I've got my TOD fix for the day
>Will the human population collapse? If a catastrophic event occurs, quite possibly. I don’t they will because of peak oil.
None of us believe that the day after Peak production that civilization will collapse over night. What we believe is that at some point, energy production will fall to the point where systems that are heavily dependant on fossil fuels will begin fail. This will lead to several changes:
1. Decline of Economic growth, later declining a global economy as businesses, goods are dependant on cheap fossil fuels are no longer sustainable. Whole industries fail, such as airlines, causing high unemployment. Higher energy prices means business must charge higher prices for goods and services which make them less affordable. Consumers cut back on the amount of goods and services they buy which results in higher employment. Higher unemployments leads to further consumption cuts, causing more job losses.
2. Declining food production as farmers are no longer able to afford or obtain fertializers and pesticides to maintain high production rates. Today farmers are already having difficult with the high costs of fertializers. Poor Populations that are already dependant on Western food production will stop recieving food as production rates fall resulting in massive starvation and die-offs. Global Food production has been on a steady decline since the late 1990s (the same time oil and gas prices began to rise). This trend will continue as oil and gas prices continue to rise.
3. The rise of disease cause by mal-nutrition. Much of the disease during the dark ages in Europe was related to declining food production caused by the little ice age. Disease will likely originate in the poorest regions and will spread to adjoining regions. Already we are faced with drug resistance superbugs, which will continue to evolve into more difficult to treat diseases. With the lack of money due to high energy costs and high unemployment, outbreaks will become difficult to control. Drug resistant diseases will eventually spread to Western cities which could result in wide spread death or long term illnesses that affect the population's long term health and moral.
4. Accelerated distruction of the environment as the high cost of fossil fuels leads to increase consumption of dirty fuels and consumption of bio-sources in a non-renewable fashion. e.g. people start burning wood, coal, and peat instead of oil and gas. Higher air and water pollution will lead to increase illness amoung the population. The environmental destruction will also later decrease the planet's carrying capacity to maintain large populations perhaps for many centuries.
5. Decreased geopolitical stability resulting in increased genocide and war. As populations are squeezed and pressed into a corner caused by shortages and declining economies, they will fight back, causing further distruction and death. We can see this is already on the rise this decade especially in Africa. This is more related to population overshoot but declining energy resources will almost certainly accelerate it.
6. Loss of energy as a tangible commodity. As the availability of oil and gas decline, its only natural for the nations that have remaining reserves to dramatically cut production in order to preserve them for future domestic consumption and trade. Within just the past few years we can see a dramatic rise in nationalization of oil and gas assets around the world in prepretion. Conservation of remaining reserves will likely cause dramatic loss of imports for many nations that are utterly dependant on oil and gas. Severe distruptions of imports will lead to very high employment and increased violence and drug use as the population is unable to make the physical and psycological adjustments. Local, State and Federal gov'ts will have difficult maintaining the infrastructure and delivering basic services when they are needed most. Disruptions in fuel to transport essential goods will lead to shortages causing further turmoil and social instability. Violence, Riots, murder will become the norm.
>Because of fear, greed, etc, they will evolve processes in order to sustain themselves.
These are the reasons why a die-off is likely to occur. Those with the will and the means, will do whatever it takes to maintain their lifestyles at the expensive of many others.
>I believe connecting the issue peak with dieoff and civilization collapse and presenting this to the masses is a foolish strategy that will have you labeled and dismissed quickly.
No doubt about that. Regardless of what the masses wish or want to believe, they will not change events. Perhaps if die-off was taken as a serious threat much of the problems could be addressed instead of a "every man and women for themself" strategy as you less than eliquently pointed out. Its always better to deal with your problems before the deal with you.
In my opinion this "die off" belief system would have far fewer converts if more people had at least a basic understanding of economics. At the very least, more people would realize how unlikely the above scenario really is.
I have seen zero evidence that the airline industry will fail post-peak. Individual airlines might fail, but then that happens regularly enough pre-peak. Airlines will keep flying because they will get their fuel from any of a) the tens of millions of bpd that will still be pumped out of the ground, b) bio liquids, c) coal to liquids, etc. The industry may contract somewhat in order to support higher ticket prices necessary to support more expensive fuel, but it will not fail.
The fertilizer / food argument is also a bit of a non-starter. It has been demonstrated that fertilizers can be created with no need for fossil fuels. It's true that food prices may go up--the poorest of the poor will be affected, mostly by requiring them to increase the percentage of their income spent on food. Other possible effects on the world's very poor include decreasing nutrition. Believing that billions of people will die of starvation is just nonsensical, however.
I just thought of this in regards to economics. If the economic system helps us in regards to finding new alternatives why hasn't the economic system found a cheaper and more abudnant energy source than oil to lauch growth to a higher rate?? Wouldn't economics be proactive in this instance??
Economics is about resource allocation. It can cause energy to allocated from less profitable to more profitable uses. It can cause scientific and engineering talent to work on energy-related research rather than something else. It can drive investment to produce more energy. But it can't magically create new sources of energy just because they would be nice to have. Clearly, more effort is now going into research into alternative energy sources than has gone into them in the past. We can see some results from those efforts. But there is no reason to think that there is a more-attractive alternative to oil waiting to be found in the near future. Economics can encourage the search, but it can't bury the treasure.
Why find something cheaper than something cheaper than water?
Oil is STILL increadibly cheap and will remain that way a long time after Peak, at least in relation to other sources. Higher resource rices will even help the world economy for a while (which they probably have since 2003). The question is one of degree - Oil will deplete quickly enough. Can the human endeavour "replace" the resource? This is the question that economics can never answer. Neither can Kunstler, for instance.
Maybe it is just me but I think the reason to find something other than oil is because there is a ton of money to make. Do you think people would not have a demand for something other than oil if it were cheaper?? I think that would be a pretty easy sell to most of the world which result in a fair amount of money for someone.
You are exactly right.
This is THE (did I say THE?) argument called "economics" (in a capitalistic world). If I can make money supplying something cheaper/better, I will. But the entire question here is CAN I?
DEMAND is not the problem. It would be bought, IF it were there.
SUPPLY is the issue here.
Have you found something cheaper than oil (even if oil is $200 or more) that you can sell and make a bitch of money doing it? If you had, you probably wouldn't be posting here, anyway, right?
Well, neither has anyone else. At least not on a scale which would effectively replace oil.
Rising prices will certainly create a shitload of economic activity which will tie down a large portion of our resouces to finding THE MAGIC REPLACEMENT to oil and natural gas. At first it will probably work. At first the "economists" will probably be right - start building the 28 THOUSAND nuclear reactors necessary to make the economists right!! But hurry up! Post Peak will probably be too late!
Well, I think you get the message.
Conservation, Wind, Solar, Hybrids, Nuclear, Geothermal, Biomass will all nibble at the corners of the problem. They will all BOOM BOOM BOOM. Til they don't boom any more, i.e. til the system collapses.
Have fun riding the wave! It's been fun up to the crest, now, hasn't it?? If you're even still reading this post..
Cheers, Dom
Right. If oil was trading at $200 per barrel, it would be unsustainable from a supply crunch side because then shale oil, coal liquefaction, and other synthetic oil infrastructure would be going up like mad.
If it was sustainable demand, it would put coal electricity out of business because all the coal would be swallowed up for synthetic fuel production. When the coal runs out, you can crack CO2 hout of limestone and H out of water in thermochemical methods fed by nuclear process heat, run over cobalt catalysts, and generate as much diesel fuel as you want.
Why not? We have nearly half that much in fossil infrastructure allready for similar capital costs and it will be replaced through standard depreciation anyways.
What, when the sun dies?
Right, why not build 28 THOUSAND Nuclear plants in the next 30 years?
That's 1000 FINISHED plants per year.
"What, when the sun dies?"
Actually, I was thinking a couple years before the sun dies
and even a couple years before the sun cooks the earth (scheduled in ca. 1.5 billion years).
This was the argument back 5-10 years ago, that oil only has to be SUSTAINABLY higher than $30 per barrel, and all the alternatives will kick in. Well, I would say that the price has risen a good while over $30, and the alternatives now need oil prices SUSTAINABLY over $80. Please continue watching the phenomenon that rising prices also induce rising necessary prices - over the next couple of years/decades, of course..
"the alternatives now need oil prices SUSTAINABLY over $80."
What makes you think that? Do you have a link or reference with that kind of breakeven point?
There are a lot of CTL projects starting up, which generally project breakeven points of less than $40. I saw one recently (unfortunately my link is broken): They said $4B and 4 years construction time for 96k/day. That gives a capital expenditure premium of $9.20 at 7% interest, or very roughly the cost of refining oil into fuel. That’s likely to have a very fast payback.
Most estimates are $6.5B and 5-7 years construction time for 80k/day, which gives a capital expenditure premium of $15-20/barrel, which is not bad given that it creates clean diesel with no further refining.
Wind is now the single largest source of new generation: wind is 47% of new generation planned for 2007 (adjusting for capacity factors). See http://www.nei.org/documents/Energy%20Markets%20Report.pdf page 8, keeping in mind that wind has a short planning horizon, so 2008 and beyond will rise a great deal - only 2007 is really useful for comparison purposes.
Wind electricity for EV's costs only about 2.5 cents per mile. The only barrier to electric vehicles is the battery. GM says that the batteries they're looking at now have the specs they need (Saft and A123systems) for an affordable EV, but there's still work needed to develop the battery packs, electronics, and do the testing (crash, environment, durability). Automotive development takes 3 years minimum to go from prototype to manufacturing for anything new (think Pinto gas tank - car execs certainly do), but these batteries are in use now for other things (power tools, especially).
Alternatives to oil cost less than $40 per barrel. The only barrier is the length of time to scale them up. That's why the date of peak oil is indeed important.
This is the classic fallacy that is committed over and over again on this site.
What you fail to understand, is that supply, demand, and price are all inextricably linked. The large increase in the price of oil over the last two years has served to reduce demand - a classic demand-side effect. If the price goes up further demand will further reduce.
Simultaneously, we are seeing an incredible boom in the production of non-conventional and alternative liquid fuel - a classic supply-side effect.
Consider also, we have a situation where it appears that less oil was being produced recently than was the case a year ago. "Signs that we have peaked" some people say. And yet, where's the predicted doom and gloom? Supply still equals demand. Market forces at work.
It would help Ener Ji, if you at least made some attempt at an argument. The word "economics" is no argument at all.
No one is really worried about whether we can fly coast to coast 20 or 30 years from now. We will have far greater problems to worry about. And is has not been demonstrated that fertilizers can be created without a need for fossil fuel. Sure we have horse manure but not enough to matter. The production and delivery of fertilizers requires massive amounts of fossil fuel. So does the planting, cultivation, harvesting, processing and delivery of all crops.
But methinks you are the one with a need to understand basic economics. Fossil fuel is not just the energy that produces everything we consume, but in many cases it is the feedstock as well. When fossil fuel starts to decline, there will be less energy and feedstock to produce these things. They will not be produced. The people who worked in these industries, producing, delivering and selling these things will be out of a job. This will mean less money to buy the things that still are produced, which will mean more layoffs. It will be a vicious circle causing a massive depression.
If you overlaid a graph of world population with a graph of the increasing use of fossil fuel, it would be hard to tell which is which. And it is just absurd to think the population will continue to climb, or even remain flat, when fossil fuel begins to decline in earnest.
You know, I read so many very short put-downs of the consequences of peak oil. But no one ever attempts to argue with Price. The reason is very simple. He puts all those very short and silly arguments to shame because his argument is scientific and air tight.
http://dieoff.org/page137.htm
Ron Patterson
Ron Patterson
Note that this graph is "Energy Use" vs. population, not "Fossil Fuel Use" vs. population.
And of course correlations in and of themselves don't prove much of anything anyway.
I have noted in my edited post that this is total energy.
Do you really think that the energy/population relationship is just one of correlation? The "Green Revolution" that kept us from hitting a Malthusian wall last century was primarily due to energy availability and cost (particularly Fossil Fuels), at least from my reading. That implies a direct cause and effect relationship that would have significant influence on the post-peak human ecology.
IIRC the main improvement was better forms of wheat.
dbl post
Exactly wilbert. And nobody expects total energy growth to stop when the pop'n peaks in 2050. All projections show growth as per capita income grows in asia and africa after 2050.
Do you have that in table form?
Yes. You can download it from http://www.paulchefurka.com/peakoil/Population_and_total_energy.xls
Goodness, where to even begin? I'm afraid I have limited time, so let's tackle something basic:
When oil peaks, fossil fuel use could keep right on increasing thanks to increased coal usage. There's also abundant forms of non-fossil fuel energy sources available (solar, wind, fission, etc.) so there is absolutely no reason to believe that there will be less energy available.
If we're trying to predict how people will react post-peak that's really all irrelevant, however. The really important things to keep in mind are the substitution effect, the Price Elasticity of Demand (PEoD), Price Elasticity of Supply (PEoS). A good understanding of excess profits and economies of scale / scope would also be quite helpful.
I have yet to see a "doomer" who has a good grasp on the above concepts. I believe that is because it is impossible to BE a doomer and understand the above concepts. An understanding of the above concepts will enable you to make some predictions about how people will react to peak oil when it hits us. Curling into a ball and dying will not be one of them. ;-)
I agree with you that almost no one "wants" to curl up into a ball and just die.
But what you want and what happens are often two different things.
Interesting analogy with the use of Fidel Castro, step back.
However, you really make my point for me. Fidel's does not have a market-based economy because it has a despot at the top who can allocate resources as he sees fit.
Luckily, most of the rest of the world operated (to varying degrees, admittedly) as a market economy. What that means in the simplest terms is that market forces work to allocate resources efficiently and to maintain stability.
"No one ever attempts to argue with Price. "
Well, they should, because his arguments fall down in a lot of places. Perhaps the most important is the following paragraph:
"Visionaries support the potential of wind, waves, tides, ocean thermal energy conversion, and geothermal sources. All of these might be able to furnish a portion of the energy in certain localities, but none can supply 75% of the world's energy needs. Solar thermal collection devices are only feasible where it is hot and sunny, and photovoltaics are too inefficient to supplant the cheap energy available from fossil fuels."
He provides no evidence for this, and he can't. Here's a counterargument:
http://gristmill.grist.org/story/2006/12/17/212637/60
"Again, there are renewables other than wind. But just as a limiting case, it is interesting that we could provide 95% of our power from wind -- reliably -- for between 5.6 and 8.6 cents per kWh. Note that existing hydroelectric could provide about 80% of the remaining 5 percent, with biofuels or natural gas-powered generators providing the remaining 1 percent. Alternatively, we could provide 5% of our electric needs with sustainable biofuels. (Whatever arguments we have about biofuels on a large scale, does anyone doubt we could produce enough sustainably to power 5% of our electricity needs?)"
A less important argument is that human population growth is exponential, and unending. This just isn't true - ask any professional demographer or population planning expert. Pop growth for the world as a whole now is roughly linear, and slowing pretty quickly. The UN's website is a good reference for this. Here's one discussion just for developing countries: http://www.un.org/esa/population/publications/WPP2004/WPP2004_Vol3_Final...
ballz.ababa.net/rocco23/anal-rape.htm
ballz.ababa.net/rocco23/animal-rape.htm
ballz.ababa.net/rocco23/anime-rape.htm
ballz.ababa.net/rocco23/asian-rape.htm
ballz.ababa.net/rocco23/ass-rape.htm
ballz.ababa.net/rocco23/black-rape.htm
ballz.ababa.net/rocco23/bondage-rape.htm
ballz.ababa.net/rocco23/boy-rape.htm
ballz.ababa.net/rocco23/brutal-rape.htm
ballz.ababa.net/rocco23/cartoon-rape.htm
ballz.ababa.net/rocco23/celebrity-rape.htm
ballz.ababa.net/rocco23/date-rape.htm
ballz.ababa.net/rocco23/duke-rape.htm
ballz.ababa.net/rocco23/erotica-rape.htm
ballz.ababa.net/rocco23/family-rape.htm
ballz.ababa.net/rocco23/fantasy-rape.htm
ballz.ababa.net/rocco23/forced-rape.htm
ballz.ababa.net/rocco23/free-rape-sites.htm
ballz.ababa.net/rocco23/free-rape.htm
ballz.ababa.net/rocco23/gang-rape.htm
ballz.ababa.net/rocco23/gangbang-rape.htm
ballz.ababa.net/rocco23/gay-rape.htm
ballz.ababa.net/rocco23/hardcore-rape.htm
ballz.ababa.net/rocco23/incest-rape.htm
ballz.ababa.net/rocco23/interracial-rape.htm
ballz.ababa.net/rocco23/japanese-rape.htm
ballz.ababa.net/rocco23/lesbian-rape.htm
ballz.ababa.net/rocco23/male-rape.htm
ballz.ababa.net/rocco23/nun-rape.htm
ballz.ababa.net/rocco23/porn-rape.htm
ballz.ababa.net/rocco23/prison-rape.htm
ballz.ababa.net/rocco23/rape-bondage.htm
ballz.ababa.net/rocco23/rape-cases.htm
ballz.ababa.net/rocco23/rape-club.htm
ballz.ababa.net/rocco23/rape-fantasies.htm
ballz.ababa.net/rocco23/rape-fantasies.htm
ballz.ababa.net/rocco23/rape-forum.htm
ballz.ababa.net/rocco23/rape-galleries.htm
ballz.ababa.net/rocco23/rape-hentai.htm
ballz.ababa.net/rocco23/rape-images.htm
ballz.ababa.net/rocco23/rape-incest.htm
ballz.ababa.net/rocco23/rape-index.htm
ballz.ababa.net/rocco23/rape-movie.htm
ballz.ababa.net/rocco23/rape-movies.htm
ballz.ababa.net/rocco23/rape-paysites.htm
ballz.ababa.net/rocco23/rape-pic.htm
ballz.ababa.net/rocco23/rape-pics.htm
ballz.ababa.net/rocco23/rape-pictures.htm
ballz.ababa.net/rocco23/rape-poems.htm
ballz.ababa.net/rocco23/rape-porn.htm
ballz.ababa.net/rocco23/rape-prevention.htm
ballz.ababa.net/rocco23/rape-scenes.htm
ballz.ababa.net/rocco23/rape-sex.htm
ballz.ababa.net/rocco23/rape-sites.htm
ballz.ababa.net/rocco23/rape-storys.htm
ballz.ababa.net/rocco23/rape-tgp.htm
ballz.ababa.net/rocco23/rape-thumbs.htm
ballz.ababa.net/rocco23/rape-trailers.htm
ballz.ababa.net/rocco23/rape-video.htm
ballz.ababa.net/rocco23/rape-videos.htm
ballz.ababa.net/rocco23/rape-vids.htm
ballz.ababa.net/rocco23/rape-xxx.htm
ballz.ababa.net/rocco23/rape.htm
ballz.ababa.net/rocco23/rp2.htm
ballz.ababa.net/rocco23/sleep-rape.htm
ballz.ababa.net/rocco23/top-100-rape.htm
ballz.ababa.net/rocco23/wife-rape.htm
ballz.ababa.net/rocco23/xxx-rape.htm
Ron, I am of the same mind-set, i.e. that it is important to read both sides in order to come to the right conclusion. I've found very little serious writing to answer PO claims. What is written in response to the PO movement does not directly address the most important claims of PO. I read Michael Lynch's stuff which is one of the better efforts I could find to debunk PO, though in my mind it failed. Anyway, I'm wondering if you could recommend any good sources for studying "the other side". Have you found anyone who has made a half-way decent attempt to address the issues raised by the PO movement?
Phineas, there lots of web sites that try to debunk peak oil but no whole books on the subject, that I can find anyway. Borg does mention the subject but says once oil gets above $40 shale oil will kick in and provide the world with all the oil it needs for the next 500 years. Understand that Borg's book and Simon's books, all attack the theory that the environment is in a damn mess. They all say everything is fine and getting better. They do not address the energy problem in particular.
All the web sites, and all the books for that matter, sing the same story. They all concentrate on reserves, adding all the oil sands and shale oil to the mix. They all simply think all that shale oil and oil sands oil is there for the simple taking. Just tap it and it comes gushing out, enough oil to last for one thousand years. And of course, they all buy into theos "vast Middle East reserves" argument.
Phineas, there are no valid arguments anywhere to be found against peak oil. It is a fact of geology, nothing more. The only debate is when. And it should be obvious to everyone that the "when" is somewhere between 2005 and 2012. My money is on 2005 but I would not be surprised to find that it may be 2007. No later than that however.
The true debate Phineas is what will be the consequences of peak oil and all the other environmental problems? And as far as I am concerned, that is the only debate.
I have been thrashing this straw for over forty years. Not peak oil mind you, but peak people and all the consequences of overpopulation. And there are many books telling us that there is no overpopulation problem or environmental problem. Borg's book "The Skeptical Environmentalist" is the one touted most often. I have read it and I think it is a joke.
But my advice to you, and anyone else for that matter, is don't concentrate on peak oil and try to figure out if that is a valid theory or not, that is a lead pipe cinch. Concentrate on the "Big Picture". Read "Overshoot" if you can find a copy and "The Spirit in the Gene" and the David Price essay, "Energy and Human Evolution." And if video clips is your forte there is no better place to start than here:
http://big-picture.tv/index.php?id=62&cat=&a=147 There are about fifty different video's here but Lester Brown's is by far the best. He points out it is the "synchronicity" of all these things coming together. You know, peak oil, peak water, and all those other environmental problems.
So that still leaves the question open, are there any good arguments everything will eventually turn out okay? No, there are no such arguments, not in books or on the web. It would be impossible because we have already passed the "okay" point. Everything is already a disaster and getting worse by the day.
Sorry I could not be of more help.
Ron Patterson
Thanks Ron. It's just still surprising to me that there is no sophisticated attack on PO. At least with the anti-GW people they jump on real (but misleading) data, quote bogus scientific studies and make some kind of attempt to refute the actual claims of environmentalists. If you don't look too hard, one could be impressed by their "scientific methods".
The original defence setup agin GW was to prevent hundreds of billions of dollars being spent to prevent something that was cyclical or an event that was unstoppable.
In the case of PO, the financial rewards have been immense to the oilco's and national oilco's. Russia has almost paid off its entire IMF debt.
The "fear of shortage" that caused some of the post 2003 price rise on top of the geopolitical "fear factor" has exponentially raised profits. Oil exec's admit the profit was obscene. With a $40 comfort zone, they were making a ton of money at $60 they have said.
The PO movement is good for profit. Any new migigation regulations pale in comparison to the Net. They luv u guyz!!!!
Phineas:
Wait a month, and you have on the market what might well be the first book-length attempt at refutation.
http://www.petro21.com/research/research.cfm?tab=content&id=301&client=n...
Thanks Asebius, I must have this one.
Ron Patterson
"The world’s oil future will be wholly at odds with Peak Oil’s ultra-pessimistic scenarios due to global upstream realities and industry fundamentals that will determine most-likely crude oil supply trajectories. Peak Oil’s dismal views contrast with commercial drivers to exploit large world resource endowment, consistent reserve growth, new oil field developments en route, and exploration dynamics that together will shape future crude oil supply growth."
Sorry, the book probably goes on the lines of CERA and is not concerned with a Post Peak world. It denies Peak Oil, if the recension is right.
From one of the comments:
"The Battle For Barrels lucidly shows that not all is known on potential oil reserves-in-ground, and Peak Oil is very wrong on its view that such reserves are now fully known and finite."
Of course - they are infinite. How wrong we are.
Hey, I cut and pasted your words into my post then you edited the post and changed your words. (Actually they were very confusing and I suspected you had made an error. You obviously caught that error and edited your post.) You can preview your post before you post and avoid this error in the future. No, I have not seen Deffeyes or Simmons say anything of the sort and I am not twisting your words. But you are doing a good job of that yourself.
Ron Patterson
Okay:
Dubious claim.
Dubious claim.
Dubious claim.
Dubious claim.
And that's all from one paragraph. Yes, I did read further -- through the whole document, you're not presenting an argument, you're just stating things you believe as if they're unassailable truth. As if, somehow, your personal faith can substitute for actual evidence.
Sorry, but the depth of your faith is not a compelling argument.
At the end of the story of the boy who cried wolf, the wolf really comes and it is the fault of the adults that the boy gets killed because they knew (or should have known) that the wolf was a real danger. There are at least two lessons to be learned from that story: don't cry wolf unless you see one and there are wolves, even if you don't see them.
Now, I agree that all this dieoff crap belongs into the mental institution and that is ultimately where some of these people will end up. However, that does not mean responsible politicians and citizens do not have an obligation to point out that there is a need for far more efficient energy policies. The need was there in the 1970s, 1980s, 1990s and it keeps getting more and more urgent. Among the wolf criers are probably some of those who are genuinely frustrated about not having been heard when it was time to mitigate the problem efficiently and cheaply.
I don't see anyone crying wolf here.
WT export land model is fairly sound.
The question here seems to be the exact date of peak oil.
1.) I don't see huge increases in oil supply in the near future thus demand and supply will continue to be at best balanced.
2.) Most models put peak around 2010-2015.
This is not a lot of time to mitigate.
I personally find the evidence for peak oil now that includes all factors fairly compelling and feel that any strong dip post peak could cause a lot of problems.
In general weaning our society off oil has so many pluses its hard to argue with doing it even if oil production was not peaking.
In any case we (the US) should have started aggressively mitigating oil use back in the 70 when the US peaked.
If we hand moved to renewable energy then we could have continued to have plentiful oil to use where it made sense for 100's of years if not thousands.
In short moving away from oil was the right thing to do in 1975 and is still the right thing today. I don't understand why people who have recently peak oil aware are so entranced by this straw man cry wolf argument.
And as far as the real date for peak oil the first step to mitigation would be to force data transparency so we can understand the problem at that point we can take action. The only thing the actual date of peak oil effects is the relevance of some mitigation plans nothing else.
I am confused here. Who are the two idiots, Simmons and Deffeyes or Hubbert and Campbell? From the sentence above it appears you are calling Hubbert and Campbell idiots but since Hubbert has been dead for many years and is not presently crying anything, then you must mean Simmons and Deffeyes.
Please clarify the matter. I sure want to know who are the true idiots here? Who's motives and character are you questioning?
But you are very clear on who is irresponsible and know better. No need to explain that point.
Ron Patterson
Glad to oblige. Idiots are those who attempt to promote Peak Oil (or Climate Change or fiscal restraint) with a dire sense of urgency by using baseless, exaggerated, alarmist consequences for non action ... often w/o including time lines that can be used to challenge their scenarios.
It does not include folks that have made an error in targets or holds that view.
I don't know why I'm replying but I feel compelled.
Shit happens Freddy ask anyone that was in a concentration camp in Nazi Germany or probably easier one of the Vietnamese boat people. Or even better on of the faceless Mexican immigrants we scorn.
I find your "American" attitude both repulsive and dangerous.
Now each any any of these dire scenarios has a certain probability of becoming reality everyone needs to decide using their own intellect how probable they are. A big part of why the world hates us is the attitude that America can never fail. But never assume things will always be rosy for Americans we have had hard times here in the past and we will again someday.
Anyone can figure out that China and India together growing at 10% plus will put a real squeeze on the "American Way" pretty soon now regardless of other issues. The world can't support 3 billion American lifestyles. Other issues such as Peak Oil global warming etc etc etc will only inflame the process.
Freddy might want to think about events unfolding in Mexico.
Thats a doomer scenario building if I ever saw one. The people are crying for BREAD (but in this case tortillas) since our corn is going thru the roof and beyond.
That is scary and Freddy doesn't get a clue.
Mike, please take 25 minutes and read the two recent links given to us by Ron Patterson and u will see quickly why there is no foundation for comments from Ron like this afternoon's:
"Everything is already a disaster and getting worse by the day."
He is one of the idiots that i described earlier that have no sense of time line for events to unfold; yet propagates impending doom with a sense of urgency.
I have been a proponent of resource conservation for several years; and i was one of the first north american members of Pollution Probe. Ron and Duncan and David Price can post a million pages at the die-off site but it won't make it happen. They have no background in economics nor technology nor futurism. All they have going for them is their vulnerability to the boomer based phenom of instant gratification. Their problem is psychological based. Their desire is to see the world implode in their lifetime. But wanting it won't make it happen quicker.
And that is what really pisses them off. The anticipation...
Pride and Duncan don't understand the Second Law of Thermodynamics and thus wrongly attribute it to population growth. Further their effort was based on per capita energy production crashing in y2k.
Pride wrote in 1995 and Duncan in 1989. Duncan forecast that per capita energy production was at PEAK (there's that word again!) and would be down 7% by y2k. Sorry sucker. Didn't happen. And so he has rewritten his essay as Ron posted yesterday. All the recognized projections show this ratio increasing to 2075.
Their population projections are similarly misguided. Pride's comparing human growth to reindeer is hilarious. So is his postulation that all nations and all regions would collapse simultaneously. While some regions and nation states have lost their self sufficiency due to globalization to reduce inflation and promote trade of their own goods, it would not take more than a generation for them to rebalance. The collapse scenario also wrongly assumes that their is an equal for all nations and peoples as cultures. This is wrong at both the high per capita income end as it is for the low end that don't have far to fall at present should they not be able to compete for energy resources.
I agree that Earth cannot support billions of people. But the crash in population won't come due to Peak Oil. or Energy prod'n per capita.
Pride's silly graph says human pop'n will grow 'til they can't eat. Wrong. All population scholars agree that earth will top out in 2050 due to natural fertility patterns. But why let peer reviewed studie ruin a good movie screenplay, eh?
The Earth has not seen plague or fammon for long times. They will come back. Aids and SARS are precursers to die-off scenarios that will befall us. But it won't be of the 80% variety that Ron, Pride and Duncan are selling as gloom merchants.
They have the story "almost right". But are out by about a few centuries as depletion of resources kicks in. And their visions of everyone living like mennonites in an agrarian society or in cabins in the usa mountains are similarly ridiculous.
One thing we have learned by reading the work of the futurists of the 20th century is that they all got the timing wrong. Almost Nothing happens as fast as predicted.
And idiots that come to TOD and tell us it's happening within a decade at the most (or two) and they're ready and they have their guns and rifles and nato-whatevers are just whacko's that need our pity and guidance ...
Finally i will say a word on mexico. For two decades the WTO has been attepting to get rid of usa/european style agri subsidies. Brazil has proved that their absence is workable. The WTO wants developing world farmerst to earn a better living by getting better commodity prices. All the peer reviewed studies say we have suplus capacity in agriculture and can do more with less. The whiners in mexico are just the start. But in the end they are only whiners and are not starving. Disposable income will absorb the planned adjustments.
Louis de Sousa wrote:
Freddy wrote:
Well Louis, it is nice to see that this very important member of this forum conducts himself in such a gentlemanly manner. His kind of comment, I am sure you recognize, does not diminish the level of openness of the debate.
How did Duncan get dragged into this debate? And what the hell do you know about David Price. Dr. Price will not see the world implode in his lifetime because he died in 1999.
http://www.mnforsustain.org/author_price_david.htm
And this other essay by price proves he knew his economics, even thoughhe was an anthropologist by trade.
http://www.mnforsustain.org/price_d_malthus_false_hopes.htm
Price, not pride you blooming idiot. (Sorry Louis but I just could not help myself.)
The essay that I posted yesterday, was written 1995 and never rewrote it, owing to the fact that he was dead. This just goes to prove Freddy, that you are not just an idiot but a liar as well.
Again, it is Price, not Pride. And the reindeer example was to show how any population, be it human or reindeer, will explode when it is supplied with unlimited food and no predation. Price never suggested that all nations or regions will collapse simultaneously. That is just another lie you made up. Nowhere in the essay does Price suggest that nations are equal. In fact he never even discusses individual nations at all.
Freddy, I don’t think you even read the essay. You could not possibly get it so wrong if you had even bothered to read it.
Freddy wrote:
Snicker, snicker. That line was written by a man who calls two Ph.Ds, Doctors Ducan and Price, idiots.
Ron Patterson
No for Freddy that was one of his better posts :)
No seriously at least he tried to be a bit more reasonable.
Hell if I were to guess a collapse scenario I'd have to say that a unstable economy caused by peak oil and other factors such as global warming will eventually lead to a epidemic somewhere in the world. Strained supplies could easily result in a epidemic/economic down spiral as happened during the plague in Europe.
Assuming our population keeps growing and also assuming greater economic strain the chances of this happening with the next 20 years is probably close to 100%
http://www.scielosp.org/scielo.php?pid=S0042-96862002000600020&script=sc...
The question is not that something very bad will happen if we continue business in usual but what.
Studying deer poulations does have merits, contrary to how much Hutter may scoff. One of the most interesting studies of recent years involved the tracking of spontaneous democratic organizations in deer herds.
http://www.newscientist.com/article.ns?id=dn3248
Fammon? That is pretty funny.
Fammon rhymes with mammon which "is a word used in the Bible to describe riches, avarice, and worldly gain."
Telling.
"Snicker, snicker. That line was written by a man who calls two Ph.Ds, Doctors Ducan and Price, idiots.
Ron Patterson"
Who the f*ck is Dr Ducan???
Get on the same page, pleasssssse.
The two die-off writings that u posted yesterday above from Duncan and Price and that u say are the basis of your worldly belief system are total rubbish. Anecdotal unfounded musings. Explains a lot...
Ron,
It seems to me that when the technotopians and those "knowledgable" in economics assert that "doomers" are "believers" it is a cased of the pot calling the kettle black. For they are the ones claiming that human beings are not subjects to the laws of physics. After listening to the fascinating, almost common sense Albert Barlett lecture about Exponential growth, it is obvious that it is very close to midnight for the human race (to use Bartlett's analogy). I'm a big picture guy, and what I see is that humans cannot continue to grow exponentially, energy descent is knocking on the door. So yes, it is time for the human race to "grow up" as someone mentioned yesterday, but all evidence points to an extremely rough time ahead as endless growth economics is dealt a death blow. An equilibrium will eventually be reached, but that may end up being small comfort indeed.
Or I could be wrong and humans are indeed special and mathematics doesn't apply to us! Yippee!! I guess that makes us a supernatural superorganism!
Basically most people literally think that humans are so very clever that even exponentials can't fucking stop us! And that's childish hubris, George Bush style.
Dr. Albert Bartlett: Arithmetic, Population and Energy
http://www.globalpublicmedia.com/lectures/461
Silly, who is arguing that exponential growth will increase forever? In fact, human population growth is currently slowing down and is predicted to stabilize at around 9 billion somewhere around the middle of this century.
Of course, that's a long way away and a lot could happen between now and then. One plausible scenario is that economic development, particularly in poorer countries, leads to a global birth rate that is slightly lower than the replacement birth rate and that the earth's population slowly decreases.
So you may be right, in the end. In 2500 we may well have a human population on earth that's equivalent to the population pre-industrialization, but it will be due to entirely different reasons!
Ridiculous speculation. We certainly have the raw materials. All thats lacking is infrastructure to sustain such productivity.
Hmmm, when I last checked this planet could support approximately 1.4 billion USA consumption lifestyles based on available resources (agricultural land use, water use, energy use, etc). Sorry, I don't have links handy but you'll find several that verify that if you look.
One prerequisite would be a sufficiently cheap, usable and available energy supply, we seem to have burnt close to half of the best we've found so far. One way or another we must conjure viable alternatives quite soon otherwise that 1.4 billion potential lifestyles is likely to decline somewhat - in number, consumption 'quality', or both.
(edited for punctuation)
Out of curiousity, would you have us react/prepare for peak oil once it is here? Much research shows (and its on my to do list) that humans only react to things that are present and urgent. This is fine for putting out a fire on your stove, but changing infrastructure necessary to mitigate peak oil might require some 'false' urgency ahead of time to generate appropriate actions
Besides, your projections, and all those of an optimistic tenor (IEA, CERA,etc), look at geology and assume the rest of the world functions as is - there are numerous things that could occur that would never allow us to see true geological peak. And as Hirsch and Bezdek (among others) pointed out, we need 10-20 years to prepare BEFORE peak oil.
I know your not asking me but thats one of the big things humanity is actually facing over the next 50-100 years. In a sense we are as a species being forced to collectively grow up and take responsibility for our actions, collectively we are leaving our childhood.
Their is a very good chance that humans that exist 50-100 years from now will have a very different and hopefully more rational shared viewpoint than we have today. Its sad that it looks like we will need to come close to destroying our planet to make this transition but considering our nature not surprising. Hopefully people like Freddy will become less common in the future. I'm optimistic that its learned behavior not genetic or it may take a while for our poor species to mature.
But it seems that I am not the only one who thinks that sometimes Freddy Hutter likes to beat a dead horse?
Having said that, I still can't completely make up my mind about KSA. They did have "magical" jumps in their production in the past, indicating production reserves far greater than most producers. On the other hand, I am inclined to believe "the rumors" about Ghawar from which pretty much everything else about KSA peaking seems to follow.
The good news in all of this is that despite flat or even declining world production we have seen enough waste destruction so far to make up for the increasing gap between exponentialist's forecasts and reality at a price level which is not unrealistic for most of the developed world. I do recognize the hardships for the developing world, though.
I don't think there is anything magic about the 4.45 barrel/capita*year in terms of world oil consumption. We can see people on equal economic development levels get by with vastly different volumes and not be stressed significantly more or less. Local consumption seems to be much more a function of how well governments control the wasteful behaviours of their citizens. The US does a very poor job while Europe and Japan do a much better one. Most everywhere else the limits are probably set by income more than regulations.
I've been looking without success for 2006 data indicating that "third world" consumption is down. IEA shows the OECD consumption down but non-OECD (I assume this approximates the poorer countries of the world) consumption steady. Can anyone point me towards current data?
Jjhman, I don't think there is any good data to be had on third world consumption. However if you take world production, which is slightly down in 2006, and subtract OECD consumption, which was down even more, that would indicate that third world consumption was actually up for the first nine months of 2006. (The EIA demand data is always one month behind production data, so we only have damand data through September.)
That being said, all this is dependent on the accuracy of world production data of the EIA. Now we can assume that OECD demand data is pretty accurate because every OECD nation reports their imports and consumption. Not so for the third world. But it would seem to me that if the price of oil is having an effect on most OECD nations, it should have an even greater effect on third world nations.
Which would lead us to doubt the accuracy of the data from many national oil companies as to their production numbers.
To sum it all up, the EIA data on production is not accurate but it is the best data we have. They are at the mercy of the data that is given to them. So is third world production down? I would bet a pretty penny that it is, but there is no way to really know. Or at least that is my opinion. If someone else has any data on this however, I will bow to them.
Ron Patterson
Is there a way to separate out China and India from the non-OECD consumption? We know that China's consumption is up significantly, so the third world might be down significantly when you take China and India out of the mix.
Growth is a better predictor for future oil consumption than wealth. THe us and europe are wealthy but growth is modest and their consumption is therefore flat, as opposed to the previous 2%/a incrase, on account of price. China and india are growing fast and therefore oil consumption is growing fast, too, of course not as much as if oil was still at 25/b. African countries already in recession are now in depression - and oil imports are slashed even buses, ambulances and police cars are parked - as oil price rises, but they never imported much, anyway.
OECD does not include China or India, whose consumptions have exploded over the last several years. So, if non-OECD members China and India are way up (which they are, China by as much as 10% of its prior consumption in one year), then the remaining non-OECD nations must be down to compensate if non-OECD is steady as a whole.
(Note: The http://www.oecd.org website is not responding for me today but http://www.oecdobserver.org/ is responding and has the member nations listed as well. You can find other OECD data there as well as references to China and India since their consumption is so large relative to the rest of the world.)
Your opinion of Mr. Hutter is yours and not necessarily that of the rest of the community. Do not assume that the rest of us concur in your assessment.
What on earth are you thinking? He is a proven liar.
Bakhtiari says it will turn down. That is my guess also....
That struck me as the most realistic as well.
TrendLines does not include model forecasts that time has shown to be in gross error. I currently display 13 Outlooks.
The TrendLines Peak Oil Depletion Scenarios does not include the Bakhtiari WOCAP Model as we suspect it to be fraudulent. He seems to have changed his definition due to his gross miscalculation of 2005 Supply. We have illustrated many times on many forums that the original Supply figures he used in 2003 mirror his original definitions. His supporters misguidingly use (since) upward revised current figures (for Y2k to 2003) to validate his study. Thus, it is considered that its projected Peak Rate has been surpassed and we've dismissed this Model.
Similarly, we do not include the Web Hubble Telescope Shock Model (aspo based) as 2005 Supply figures already dismiss its 2003 Peak.
Your comments on IEA & EIA tend to exhibit your bias. Along with Michael Lynch & Jean Laherrere, these Agencies are within 10% of their 1996/97 targets in 2007. The 2010 Ivanhoe target is similarly intact altho its Peak Rate may be understated.
OTOH, the 1976 M King Hubbert forecast for a 110-mbd Peak in 1995 and pre-y2k forcasts by Colin Campbell have Peak Date targets that have passed us by and are irrelevant.
Of course you would suspect Bakhtiari as being a fraud, just as you believe Deffeyes and Simmons to be "scumbags". After all, they do disagree with you. Most of us here have a much higher opinion of all three however. Dr. Ali Samsam Bakhtiri’s credentials are impeccable. To call him a fraud is just unbelievable.
I know a lot of people disagree with my opinion, as well as the opinions of Simmons, Deffeyes and Bakhtiari. However I believe they are simply mistaken, they are overly optimistic, and grossly misinterpret the data and worst of all, they all believe those absurd figures for Middle East reserves.
They are simply mistaken! They are not frauds or scumbags. Anyone can honestly hold a mistaken opinion without being a fraud or scumbag.
If you cannot answer a man’s argument all is not lost. You can still call him vile names.
Ron Patterson
Being a Modeler in the Optimistic camp is not required to join the TrendLines Scenarios. In 2005 we added Rembrandt Koppelaar (TOD member) and Chris Skrebowski was included in 2006 'cuz we were impressed with the depth of their studies.
Samuel Foucher's (TOD member aka Khebab) linearization study was likewise included in TrendLines new URR Estimates compilation that was introduced last month.
Most modelers share their files and personal sentiment with me.
For whatever reason, Samsam's work does not pass the smell test when held up to comparison with others in the industry. It is rude for u infer that it is due to his conservative outlook.
While we tease Campbell lots in public, i have been careful over the last five years to temper that with praise for the integrity of his data both before and since his epiphany. And i am honored to include his Depletion Model regardless of missed targets.
While i may have access to some proprietary knowledge from time to time, it is not my own work that leads me to believe Peak has not passed us by. It is the overwhelming evidence in the Outlooks that are shared with me. In some cases, i am condemned simply because i am the messenger for the Optimistic Outlooks.
I am not an apoligist for any Outlook, especially those that at the high end. Anyone who has read my footnotes to the version releases is aware of my harsh criticism of long term demand-inspired projections. I am confident that this open criticism has led to the revision of some of the more liberal forecasts for 2020 to 2030.
The purpose of the TrendLines Scenarios was to provide a venue where the Models could be compared and that level playing field scrutiny would lead to a merging of the Models and better guidance for decision-makers and interested parties. That start towards that goal was achieved in the first year of our distribution of the Scenarios.
I participate and host dozens of forums and mailing lists of differing topics. There are many heated discussions and Peak Oil does not have ownership of emotion. But it is YahooEnergyResources and TOD that is the least civil to opposing opinions. First reaction is to ignore the snipers and obnoxious, but lack of peer pressure on those posters or moderation eventually causes the victim of those unprofessional hostilities to lash out.
If we were discussing these issues at a seminar or convention, i am certain we would be having a beer and fun. But the anonymity of the WWWeb lets some of us do outrageous things in forums. Nobody wants micro managed moderation, but all of us must remember that the alternative of self moderation is a two-way street...
On my way home to the farm, as a kid, I was often treated in the warm summer evenings to a fragrance emanating from the bulls' corral. I'm picking up that same smell at the moment.
You are a proven liar.
Tell me something Freddy, so why do you insist in words like “idiots” and “scumbags”?
Maybe if you didn’t use that kind of wording you wouldn’t feel such animosity towards you.
Indeed. Why doesn't everyone refrain from gratuitous insults?
I think that TOD should make a simple policy statement that insults are not tolerated, then warn, then ban violators. I am sure it would stop very quickly.
It is very clear to me that a) there is much too much of it, and b) people don't recognize when they do it themselves.
So let's have some civility you barbarians (sorry).
Freddy is a proven liar, that is no insult but a statement of demonstrated fact. If you didn't catch the demonstration, go away and do your homework.
My suggestion was to everyone. Rereading your comments to Freddy and to Roger Connor below, I do see why you might have been inclined to take it personally. It wasn't intended that way.
Sounds good to me.
Freddy, you continue to be a +ve nutter. You dismiss the efforts of Bakhtiari, even though he has been the most accurate estimate, but talk up the IEA & EIA as being 'within' 10%, ie about 8.5mbpd in error, nearly the equivalent of Saudi's total exports. What Khebab's wonderful web of graph lines show is that the most pessimistic of the predictions (eg ASPO, Chris S) are now over-optimistic in their predictions for December 2006 production- that has me really worried about what 2007 & 2008 will bring- leaving aside some mad attack by Bush on Iran.
What Khebab's wonderful web of graph lines show is that the most pessimistic of the predictions (eg ASPO, Chris S) are now over-optimistic in their predictions...
This is what I have been saying over and over again, only to have them change the rules again and again. IMO peak has already happened, falling off the cliff may take a few more years, but the peak came and went and nobody noticed, it was a non-event. They aren't processing tar sands because we have cheap oil all over the place. Light sweet crude has all but gone the way of the dodo. Now they say that we don't have peak oil yet because of bitumen and "refinery gain". Whatever, I say let's not prepare because this circus "economy" needs an elephant enema anyway. I just hope the stupid idiots in D.C. run out of time before they get to start WW3.
Wrong, cowgirl. IEA, EIA & Lynch were out less than 10% in ten years. Samsam couldn't get the following year right with that 10% latitude. He is a joke. WOCAP is a back-of-the-napkin joke.
You are a proven liar.
Whatever. I came up with the shock model from an engineering perspective, looking at first principles with discoveries as the stimulus to production as the output. If you want some insight, look at the shock model, as it provides a stochastic data flow foundation to the oil lifecycle.
I have a plan to make an on-line version of the shock model so one can add oil discovery stimulii to the input and generate production profiles. Should be interesting.
Hi Khebab, thanks again for this monthly update on events.
Again we see that Crude production has been on a plateau since ’04, below most of the math and bottom-up models. Such could be the effect of demand restrains, but it is somewhat puzzling for it means a decrease in net energy per capita – especially for the importing countries.
As for Saudi Arabia, it is too soon to tell if the decline is geological or economical in nature. If the rig count continues to grow the geological issue might get more relevant.
Please check the links for the last two pictures.
Thanks, I forgot to upload the images. It should work now.
Another thing, in the last graph and table why is the EIA Low Prices curve below the High Prices curve?
Higher Price = Lower Production? I fail to understand why.
I'm glad you noticed that, I was also surprised and I thought at first that I made a mistake. I quote the EIA:
src: IEO, 2006, p. 29
''Conservative Capacity Expansion Decisions''
Ha Ha Ha.
Still, a rose by any other name would smell as sweet.
Khebab-
Thanks! (for all your work). I have voted you 2nd most scary poster right behind westexas. I do like your charts. If I get depressed I read them upside down. ;)
From 1970 to 1980, oil prices increased by about 1,000%.
The Texas oil industry responded with the biggest drilling effort in history. Literally, every rig that could be obtained was deployed in the field, and we succeeded. We increased the number of producing wells by 14% from 1972 to 1982, as oil production fell by about 30%.
Note that this was a net decline after a furious drilling program.
Why? We could not offset the declines from the old large fields like the East Texas Field.
Mathematically, Saudi Arabia, in 2006, was at the same stage of depletion at which Texas started declining.
And as noted down the thread, if Ghawar is in decline, all 14 of the fields that are, or were, capable or producing one mbpd or more are now in decline or crashing.
Luis,
EIA’s supply forecasts are essentially demand forecasts which dangerously assume that OPEC will supply the extra forecast demand.
ExxonMobil’s(XOM) Energy Outlook at http://www.exxonmobil.com/corporate/files/corporate/energy_outlook_2006_... makes similar assumptions. On page 10 the heading of the slide is “Global Liquids Supply & Demand”. “Global liquids demand…is expected to rise to 115 million barrels/day by 2030”. XOM assumes that “supplies will continue to grow through 2030.” The commentary for this slide implies that a demand forecast is made first and that mainly OPEC supply will meet the demand.
Page 28 of the EIA’s International Energy Outlook 2006 describes their forecasting method.
http://www.eia.doe.gov/oiaf/ieo/pdf/oil.pdf
The first step of the EIA's forecast is to select a future world oil price path. There are three price path scenarios: low oil price (high demand = high supply), reference case (medium demand =medium supply) and high oil price (low demand = low supply). If the forecast price is low then the demand is high, supply is assumed to equal demand and OPEC is assumed to supply that extra demand.
“The assumed price path was also used to estimate future non-OPEC production of conventional oil and production of unconventional liquids from both OPEC and non-OPEC countries, based on estimates of the total petroleum resource base.” The key point in this sentence is that production is estimated based on an estimated resource base derived from the US Geological Survey (USGS). This means that the USGS relies on non-audited reserve data from countries such as Saudi Arabia and makes an estimate of reserve growth and undiscovered resources for each of those countries. Next, the EIA relies on the information from the USGS. Doesn’t sound like a reliable basis to me!
The next sentence on page 28 is: “Finally, the level of OPEC conventional production that would be needed to balance world oil markets for the assumed reference case price path was calculated by subtracting non-OPEC conventional supplies and total unconventional supplies from total world oil demand.” OPEC production is calculated by subtracting non-OPEC production from the total demand. This is an extremely dangerous assumption as EIA’s forecast assumes that OPEC will be able to meet the required demand.
EIA’s supply forecast is really a demand forecast which relies primarily on hope that OPEC will supply this demand. (XOM does the same)
Page 31, Table 6 shows EIA’s forecast for Non-OPEC oil production for 2030 ranging from a low of 71.0 million barrels/day (high oil price path scenario) to 76.7 million barrels/day (low oil price path scenario). These numbers vary only by about 8% - not much for 25 year forecast.
However, Page 30, Table 5 shows OPEC’s forecast oil production for 2030 varying enormously, by about 20 million barrels/day, from a low of 30.9 million barrels/day (high oil price path scenario) to 51.0 million barrels/day (low oil price path scenario). This is a big statement of confidence in OPEC by assuming that they have the capability to produce 51 million barrels/day in 2030! This requires discovering 4 more Ghawars to produce the extra 20 million barrels/day. Another 6 Ghawars would need to be discovered to offset the oil production decline from 2007 to 2030. This gives a total of 10 Ghawars!
The EIA should consider modifying their forecast to a time horizon of ten years (ie to the year 2015), eliminate their low oil price scenario and use forecast project production rates to validate their demand based supply forecasts. Their forecasts to 2030 give a false sense of energy supply and security.
I have a non-fancy computer running windows with a dial up connection. The right side of your tables is cut off on my screen and there is no "click to enlarge " function. How can I view these important tables?
Sorry about that, It's not easy to format correctly this post for everybody.
I suggest you open the pdf version of the post (http://www.theoildrum.com/files/PU200701_eng.pdf).
Reduce your text size until the table fits.
Yesss! Thank you!
You can also copy the post and paste it into a full page width word document. We used to be able to do this with one click by hitting the edit with microsoft word icon, but this is grayed out now.
You can also copy the post and paste it into a full page width word document. We used to be able to do this with one click by hitting the edit with microsoft word icon, but this is grayed out now.
http://news.yahoo.com/s/huffpost/20070115/cm_huffpost/038677
Raymond J. Learsy: Saudi Arabia's Oil? Sovereign Responsibility Trumps Sovereign Rights!
Raymond J. Learsy
(Note that the HL method gives Saudi Arabia on the order of 75 Gb in remaining recoverable reserves.)
Some Brief Comments on the Saudi (KSA) Debate
(Crude Oil = Crude + Condensate, EIA Data)
By: Jeffrey J. Brown
KSA’s highest crude oil production in 2005 was 9.6 mbpd. The last time they produced 9.6 was 9/05. For a period of at least 18 months, across the portions of three different years, from the fourth quarter of 2005, throughout all of 2006, and into the first quarter of 2007, KSA has produced, or is projected to produce, less than 9.6 mbpd.
As oil and product inventories in the US and the rest of the world have risen and fallen, as refinery utilization rates have risen and fallen, and as oil prices have risen and fallen, KSA has had one response: lower crude oil production.
Through the first quarter of 2007, I estimate that KSA will have produced on the order of 300 million barrels less oil than if they had simply maintained the 9.6 mbpd production level.
Was lower production predicted by some people? Yes.
In May, 2005, Matt Simmons’ book, “Twilight in the Desert,” warning that KSA’s oil reserves were vastly overestimated, was published. Matt didn’t offer a specific time frame for a decline, but he said he would not be surprised if it started in 2005.
In May, 2006, Khebab and I (inspired by Matt’s work) posted an article on the Energy Bulletin arguing that the historical model (Texas) and the HL method suggested that 2006 was the most likely year for the start of a permanent and irreversible decline in Saudi production. Khebab did the technical work. I am primarily responsible for the conclusions.
Note that Matt did an exhaustive study, as best he could, of the Saudi oil fields.
I simply focused on the HL method and the historical model. Some would argue that we can’t compare Texas to KSA, because of the vast differences in field size distributions. To which I replied that that was also true of the Lower 48 and the North Sea, and the crude oil production in both regions peaked right at the 50% of Qt marks.
In any case, KSA is declining exactly as predicted by the historical and mathematical models. The raging question has been “why.”
Robert was basically sworn eternal enmity against any suggestion that KSA’s decline is involuntary, which continues to baffle me, given the data that Matt Simmons presented and given the historical/mathematical models that I presented.
This weekend, Robert had an interesting point. He noted that at least 13 of the 14 fields that are, or were, capable of producing one mbpd or more are now in decline or crashing. The only question is Ghawar, which Ron and I and many others believe is in decline or crashing.
Insofar as confirmed declines are concerned, Ghawar is the Last Man Standing out of what once were 14 Giant Oil Fields.
Robert pointed out that since some fields that were producing one mbpd or more are now in decline, while world production rose, the decline of the remaining super giants does not necessarily mean that we have peaked.
The flaw with this reasoning is that the super giants that peaked did not disappear. They are still producing sizable amounts of oil. For example, Prudhoe Bay, even though it has a water cut of 75%, is still producing about 400,000 bpd. Note that Daqing, with a 90% water cut, has now slipped below the one mbpd mark.
Also, the only one mbpd and larger new field on the horizon is the problematic Kashagan Field, which, at best, won’t even start producing until 2010, and, at best, won’t hit peak production until 2020.
All I know is that the available production data are validating Matt Simmons’ warning regarding Saudi Arabia and they are validating the historical/mathematical model that predicted that 2006 was the most likely year for the start of the Saudi decline.
We will see what the future holds, but in my opinion, all 14 of the fields that are, or were, capable of producing one mbpd or more are in decline or crashing, KSA’s crude oil production is in decline and world conventional crude oil production is in decline.
To avoid another 20 rounds of “Yes we have peaked--No we haven’t” debate (regarding both KSA and the world), I'll try to limit my posts on this topic, although I expect Robert to respond, stating the (so far) approximately 18 month decline in Saudi crude oil production is “voluntary.”
But as I said this weekend, we are now at the point of very little difference between Robert and Deffeyes. Robert is putting the earliest possible world peak somewhere in the 2009 time frame. Deffeyes predicted that the most likely date was 2005. Between 2005 and 2009 are three years--2006; 2007; 2008. Thus, the midpoint between the two predictions is about July 1, 2007--a little more than five months away.
One point that I think Robert and I do agree on is the ELP recommendation:
Economize--try to live on half or less of your current income;
Localize--try to reduce the distance between home and work to as close to zero as possible;
Produce--try to become, or work for, a provider of essential goods and services.
I will just make a couple of points, and leave it at that. I think my position is clear. I don’t intend to go a few more rounds, but I do want to address a few points that you made.
Some would argue that we can’t compare Texas to KSA, because of the vast differences in field size distributions.
Yet if you take the data right up to the time Texas peaked, you could not have predicted the peak date. So you are trying to do something with KSA’s data that would not have been possible with Texas’ data: Predict the peak date at the time of peak.
Robert was basically sworn eternal enmity against any suggestion that KSA’s decline is involuntary...
Because what they have done has matched what the market would have dictated. They could be in decline, but I think it is a remote possibility. If they are in decline, then the timing sure was convenient for them. It happened just as inventories filled up, and continued as oil prices fell (and as other OPEC members called for production cuts). What would have been telling is if they had cut production as inventories were falling and prices were rising (i.e., when demand was clearly rising).
The flaw with this reasoning is that the super giants that peaked did not disappear.
But the flaw in your reasoning is that neither will Ghawar disappear. Remember, 9 fields producing over 1 million bpd declined in the past 20 years (more than the equivalent production of Ghawar) and yet production increased during time period by almost 20 million bpd. So, the argument that the world must decline when Ghawar declines is falsified by historical precedent. The world might decline as Ghawar declines, but as history has shown it is not an absolute.
Robert is putting the earliest possible world peak somewhere in the 2009 time frame.
My argument has never been about the date of peak. I believe we still have a few years, but that’s not the point I am arguing. Pretend for a minute that I am making no comment at all on the date of peak. I am just trying to address the data you have used to support your argument that peak is now.
One point that I think Robert and I do agree on is the ELP recommendation.
Yes, that is certainly good advice.
Robert and Westexas,
I think that there is the possibility that you are both right. That is, that KSA has peaked, and that they also made the production cuts voluntarily. This would imply that they don't know that they have peaked, or that the ones who made the decision to cut production were not the people who are aware of the diminishing capacity. This would indeed be quite a coincidence.
In this case KSA will find at some point, that their voluntary cuts are no longer voluntary. If this is the case, how would you expect the House of Saud to act? Argue for further production cuts to cover for falling capacity? Promise increases and hope for the best?
Thanks for your debates, I always seem to learn something from them.
sa is not as dumb as they look. At the least, they now know they have a serious problem... rig count up 3x in 2 years, now planning for a further 3x increase. Lousy fields long abandoned now planned for major new produciton, no new fields in sight... the last point is the most significant. Their use of horizontals should alert the world that their 50+ year old fields are about to crash, and there are no new fields to take their place.
Projections should look at the case where sa, q8, iran all decline at 6, 8, 10%/year to see how such a decline affects world output.
This is in effect what the draft and original Skrebowski Megaproject Scenario looked like. Then, he needed a multidecadal plateau to exhaust the URR. With all the criticism of that theory, he has gone back to a conventional post peak Decline of 2.5%. Your suggestion is similar. An agressive decline rate would leave stranded URR - an oxymoron.
Robert Rapier wrote:
Maybe Westexas could help here also... My question is:
On page 568 of Yergin's "The Prize", he says:
In November 1968, the State Department had told the European governments at an OECD meeting in Paris that American production would soon reach the limits of capacity. In the event of an emergency, there would be no security cushion: the United States would not be able to provide stand-by supply. The other participants at the meeting were taken by surprise.
So, the US government seems to have known a year or more in advance that peak was approaching.
How did they know that?
So, the US government seems to have known a year or more in advance that peak was approaching.
I think you are reading more into that than is warranted. For instance, where I work right now has "reached the limits of capacity." In fact, this has happened a number of times during the lifetime of the facility. When we reached this limit, we expanded. So that may have been the implication - that they were rapidly approaching the point of "no excess capacity."
That is exactly the situation the world has found itself in over the past 2 or 3 years. The millions of barrels of excess capacity have shrunk to the point that you can say that there is no stand by supply. This is what I have been calling Peak Lite. Demand increases faster than new supply comes online. So, even though capacity is increasing, there is no stand by supply. (Of course at the moment, I think we have some stand by supply that has been created through demand destruction. I believe that situation won't last long).
As WT has pointed out a number of times, the U.S. was caught by surprise when oil production peaked here. So, I don't believe the government actually knew in advance - they just knew that they weren't adding capacity fast enough. An interesting exercise, though, and one that I have done is to go back and start plotting HLs in the early 60's. You would have started predicting a Texas' peak in the early 60's, and you wouldn't have had a solid case for a Texas' peak until around 1977 - years after the peak.
I see where you are coming from but it has to be more than that.
Yergin writes:
The other participants at the meeting were taken by surprise
ie. They were, it seems, expecting the US to simply build out new capacity. The US knew that was not in the cards.
I agree with you that saying the US gov anticipated permanent decline in a year or two is too strong. But from the way I read it they did anticipate, at the very least, much slower growth. They were giving their allies advance warning that they could not build out surplus capacity to create a "security cushion" against embargo attempts.
They may not have seen the peak in 1968, but neither were they completely heedless.
This can lead to a situation that we discussed in 2005 where perception can become reality. If enuf oilco's (nat'l or multinat'l) believe that we are at or near Peak, it can bring on an attitute of "why bother to invest in refinery capacity?" if shortly there will be much surplus capacity in a declining supply environment.
Ironically, Supply cannot then be ramped up 'cuz there ain't the infrastructure to handle the growth. As per my post yesterday, that may be a good thing from a conservation point of view. It would place us in a contrived plateau and/or soft Decline in the 1-2% area. Perhaps that stable situation would be preferred for mitigation purposes than a higher Peak Rate, sooner Peak Date and certainly a more aggressive Decline Rate.
It would place us in a contrived plateau and/or soft Decline in the 1-2% area.
Perception of a peak, whether real or not, is definitely a huge issue. For producers, it will affect supply and for consumers, it will affect demand.
And, agreed, a plateau may well be the result.
Re: Lower 48/Texas, World/KSA & Super Giants
I have conceded the point that the Texas HL plot is very noisy; however, what it does give us is a good Qt estimate, so that Khebab could pick the stage of depletion at which Texas started its 34 year decline, which is the same stage of depletion at which KSA started its--so far--18 month decline. Note that the Saudi HL plot is much more stable than the Texas HL plot.
However, the overall Lower 48 HL plot was much more stable than the Texas plot, and Hubbert, in 1956, put the time frame for the Lower 48 peak between 1966 and 1971 (actual peak: 1970). As I have previously noted, Khebab demonstrated that the post-1970 Lower 48 cumulative production was 99% of what the the HL model predicted, using only production data through 1970 to generate the model.
So, I have argued a simple analogy, inspired by work by Deffeyes/Simmons, et al, based on Khebab's technical work: In 2006 KSA was at the same place that Texas was at in 1973 and in 2006 the world was at the same place that the Lower 48 was at in 1971. And so far, the crude oil production numbers have supported this analogy.
In regard to the super giant oil fields, if we assume that Ghawar is in decline, we are in an unprecedented time period worldwide. For decades, we have always had fields with stable to increasing production that were capable of producing one mbpd or more.
Again, assuming that Ghawar is in decline (which IMO is the case), all 14 of the fields that are, or were, capable of producing one mbpd or more are in decline. Historically, this (the big fields in decline, e.g.. East Texas) has corresponded to production peaks on a regional basis, because the smaller fields coming on line could not offset the declines from the large fields.
Again--key point--what is different now (assuming that Ghawwar is declining)--is that we have no fields that are capable or producing one mbpd or more that are showing stable to rising production. They are all in decline.
In 2006 KSA was at the same place that Texas was at in 1973 and in 2006 the world was at the same place that the Lower 48 was at in 1971.
That's the whole point, though. You can't know that. Where Texas was with respect to the HL graph was only apparent years after the peak. So you can't take a snapshot now and say that KSA is at the same point that Texas was in 1973. In 1973 you would have incorrectly predicted the "place Texas was at" based on the HL.
Robert, let me pick at this one statement:
Now as a scientist observing data in a running experiment, the first time the experiment comes to pass you notice a pattern but are unable to draw conclusions from that pattern. Then you repeat the experiment and see the same pattern and the same conclusion as before. You do this several times.
Now, you run the experiment one more time and you see exactly the same pattern. What is your conclusion (aka prediction)? Physicists do this all the time, sir. It is completely reasonable based on the model and the data to call for a KSA peak about right now based on other data. You may, of course, choose to not make that call and be more conservative. But the pattern fits prior appearances of that same pattern thus it is reasonable to conclude that the results of that pattern will be the same as well. In fact, it becomes incumbent on someone disagreeing to explain why this time is different.
Now as a scientist observing data in a running experiment, the first time the experiment comes to pass you notice a pattern but are unable to draw conclusions from that pattern. Then you repeat the experiment and see the same pattern and the same conclusion as before. You do this several times.
The problem is, even knowing everything we know now about the HL method, if you were working with Texas' data in the 1960's (using all of the other knowledge base we have today), you would have predicted an imminent peak. That's the point here. When Texas is used as a proxy for KSA, it is being suggested that the KSA peak can be predicted as it happens. Yet this was absolutely not the case with Texas. If KSA is really directly comparable to Texas, the implication is that KSA will be predicted to peak several years before it actually does.
You would have done a better job with the entire U.S., so it might be appropriate to compare an HL of the entire Middle East to the one of the entire Lower 48.
It is completely reasonable based on the model and the data to call for a KSA peak about right now based on other data.
No, it isn't. The model that was developed for Texas, which is used as a proxy for KSA, can't be validated by using Texas' data. If I can't validate the model, I certainly can't make confident predictions with it. I say this as someone who has done a tremendous amount of process modeling in my career. A model by itself is of limited value unless you can validate it by feeding it data and observing that it correctly makes predictions.
As I noted up the thread, KSA has a much more stable HL plot than Texas did.
But in any case, Hubbert, in 1956, accurately predicted the time frame for the Lower 48 peak, inclusive of Texas, and Khebab showed how accurate the HL model was on the Lower 48 downslope.
So, the world in 2006, inclusive of KSA, was at the same stage of depletion at which the Lower 48, inclusive of Texas, started declining.
And as Deffeyes predicted, world crude oil production in 2006 is below 2005 production.
dbl post
The folly of your proposal is based in the undeveloped fields. HL assumes prudent working of the field or region.
If the usa has seven states that had a moratorium on drilling in the 20th century and just started drilling today, we would have a comparable model.
If the jews were settled in "the other half of KSA" rather than Palestine and they developed the "other 50%", we would have a comparable model.
Your perception of URR is clouded by your failure to comprehend the KSA biz plan. They openly desire to implement development that is plateaued for 50 years. You have not read their disclosures. They have no intent of going for the 15 or 20 or 25-mbd Peak and face immenent and harsh Decline. Michael Smith thinks like u. He sees KSA supply at 5-mbd by 2050.
Y'all must stop reading the IEA, EIA & CERA long term projections and graphs that show KSA producing at Peak capacity and full development. They are shrewd. They realize that they are not Alberta. They can't graze cattle when the oil runs out. They have few diversification opportunities. Their long term salvation as an economy (for benefit of later generations) is to stretch the oil 'til my "scarcity premium" comes to play. Failing an alternative, there is excellent chance of Real price increases in oil post peak. KSA wants to sell the bulk of their P2 Reserves at those mega bucks.
I think your assumptions that KSA is not plain stupid pumping oil as there is no tomorrow appear to be quite reasonable to my layman understanding of business (but of course thinking of North Sea oil one wonders what is sound business selling oil at 10s-20s...). As far as I understand from your posts you dismiss the "cornucopians" that say no peak in several decades but give no specific personal guess. Is there any scenario that presents the scenario considering world oil production (and depletion) with fixed 10mbd KSA output?
Thank you.
And the man that you characterized as a "scumbag"--Matt Simons-- overlooked the undeveloped potential in Saudi Arabia?
wt, i think it is generally accepted that OPEC HAD spare capacity 20 yrs ago. how can anyone (except a cornucopian) assume that increased production = increasing production capacity ?
Westexas
I want to thank you for making your research and conclusions available on the oil drum. I feel your research, reasoning, and conclusions are priceless. I know you are incorporating the research and conclusions of many authors, however, in my humble opinion none have provided the same public service as you have. Of course this would not be possible without all of the hard work done by the staff at the oil drum. Many thanks to all for making such a great website.
Agreed!
Thanks for the kind words.
I am certainly not comparing myself to Boone Pickens and Richard Rainwater, but we do share one thing in common: we all agree that we are at, or more likely past, the peak of world oil production.
I think that Texans, having seen firsthand the frantic drilling effort that resulted in a 30% drop in oil production from 1972 to 1982, after Texas peaked, are more likely to accept the Peak Oil argument.
Khebab
I am always amazed by the depth and rigor of your data collection, compilation, and analysis. You let the facts speak for themselves. Great work. I think these monthly reports are the cornerstone of TOD.
Thanks!
West Texas and RR,
I appreciate how civil you've been in your agreeing to disagree about certain points. Fact: Oil is finite and is likely near the peak of production. You disagree as to when.
I do understand why RR is adamant about fully defensible data. However, I have some very respected Earth science teachers here in the Rockies who claim there is no global climate change, so convincing everyone is often unattainable no matter the data and empirical evidence.
West Texas, we've seen the same type of production declines here in Wyoming since the 80s. They were drilling this state like mad in the 70s and 80s but oil production has declined drastically. Now it's a mad dash for NG especially out west in the Jonah area near Pinedale. Coalbed methane drilling is going nuts all over the Powder River Basin. Coal was produced in record amounts last year to near 416 million tons. The stripping ratios have gone from small like 2:1 to now 5:1 and growing as the pits approach 500 feet depths. The red queen is truly running faster than ever. Bottom line WT, I share your extreme mistrust of the
Saudis and of government data. Your HL analysis of Texas, and the lower 48 compared to KSA is about the best estimate we've got. The official silence on oil production data is deliberate and intended only to enrich the Saudi ruling family, not make sure midwest farmers have enough deisel for this planting season or make sure New Englanders stay warm with heating oil. You both have shared much at this site so please stay civil and remember you are both on the same side.
"The official silence on oil production data is deliberate and intended only to enrich the Saudi ruling family, not make sure midwest farmers have enough deisel for this planting season or make sure New Englanders stay warm with heating oil."
Farmers will always have enough diesel for planting season. Crop prices will make sure of that. And New Englanders are well advised to listen to the geological record rather than what anybody else says and invest in alternative methods of heating their homes. Solar heating and heat pumps come to mind. The solutions are out there for over a decade. All it takes is adoption. Oil prices will make sure of that.
Oil prices will make sure that doesn't happen.
Homeowners won't replace their heating systems until far too late. Why should they? There's plenty of oil out there.
When it becomes clear that oil prices aren't coming down again their budgets will be streched so thin they can't afford the up front costs of solar or heat pumps.
Same with gas guzzeling cars.
It's pretty amazing to think that in 4 short months we may have gone 2 full years without an increase in production. It would be pretty amazing to think that we're already 2 years post peak.
I would actually find it fairly reassuring if we had peaked two years ago without major economic disruptions. It would indicate that the peak will not only be broad but also less dramatic than many anticipate because the world has enough technological, economic and social flexibility to adjust to a life with less and less oil.
Infinite,
I think crude oil and lease condensate production started a downtrend in May 2005. This downtrend will continue at a small decline rate of about -0.8%/year.
Natural gas plant liquids show a good increase rate of over 2%/year.
Other liquids includes biofuels, refinery processing gains (only volumetric double counting) and others.
I do not believe that the production growth from natural gas plant liquids and other liquids will be sufficient to offset the decline of crude oil and lease condensate production. However, it does mean that overall liquids growth could show a very small decline rate of about -0.5%/year over the next five years. This should give a broad peak and hopefully not cause a big economic shock to the world's economies.
NB: The above forecasts are based on existing and future projects (not on reserves),use many assumptions and do not take into account supply/demand shocks due to weather, terrorism, sudden field declines (eg Ghawar drops by 15% this year), unexpected inventory demand by China/India, war...
When u posted these same two graphs and conclusion last week, u were asked on what basis your interpretation of the Megaprojects data leads u to speculate that All Liquids would be 82-mbd in 2011 whereas the five other bottom-up studies of virtually the same data gave them results ranging from 90-mbd to 103-mbd. That is, in your opinion, from what nations will we see lack of anticipated Supply and/or which all liquids component has been misinterpreted?
Again, your 5-mbd shortfall (in five years) in C&C does not account the 8-mbd to 21-mbd discrepancy from their findings. The other studies are quite clear from where and from what they expect to get the oil in the medium term.
cynus said,
"It's pretty amazing to think that in 4 short months we may have gone 2 full years without an increase in production. It would be pretty amazing to think that we're already 2 years post peak."
2 years down ain't spit. If that was the indicator we are now some 28 years past peak.
Ihttp://www.exitmundi.nl/oilproblem_2004Scenariovan_deaspoassociation_for_the_study_of_peak_oil.jpg
http://www.energybulletin.net/image/primer/aspo_oil_and_gas.png
Decline in consumption:
http://www.peak-oil-crisis.com/OilConsumption_COTD200106.gif
Look at the "big valley" from 1979 to 1985. I have to do this at least once a month, so here goes, for old times sake....
Two years down on production proves: NOTHING.
Four years down on production proves: NOTHING.
Six years down on production is getting closer, but going by history still proves: NOTHING.
Let try to make my point, just in case my hints are not clear enough: Yearly oil production tells us NOTHING about the geological situation in the ground.
NOTHING. Production is the easiest factor to change, disrupt, turn up, turn down, it is the factor most sensitive to war, economic factors, machinery and technical logistical problems, political mood swings, and just plain technical
incompetence and outright fraud and corruption.
If the "peak oil" argument is married to short term (by which I mean anything under a decade) changes in production, we run the risk of once more being made fools of and getting our clock cleaned in the investment arena.
In the ongoing fights over what can be produced when and by whom, WT, RR, Khebab, and Freddy Hutter could do us a bit of a favor and tell us some things we don't know:
-Saudi Arabian offshore: How much is there, and why is Saudi Arabia buying jackup rigs at the highest prices in history?
-Khurais in Saudi Arabia: Can it deliver anywhere near the 1.2 mbd that Saudi Arabia says it can? If so, doesn't that go a bit to offsetting Cantarell and slowdown from Ghawar? If not, why is Saudi Arabia spending big bucks on pipeline and gas oil seperators developing it? We could understand them lying or bluffing, but putting thier money where thier mouth is....?
-South American offshore: Anything there? How much? Is it a joke, a pizz in the sea, or could it catch us offguard like the North Sea did in the 1980's?
-Canadian and Arctic oil. We know it's there. At what price does it become viable, and is there enough there to make it worth at $50 a barrel, $60 a barrel, $100?
See what I am getting at? There is still the possibility of some BIG surprises out there....and I haven't even touched on the demand side, which was proved to be so elestic in the 1980's...
By the way, there are still folks around here over 40 years old, right? (I hope at least some...)
Roger Conner known to you as ThatsItImout
SAUDI ARABIA-COULD THEY PLAY THE OIL CARD?....AND I DON'T MEAN A CUT....OR, ""It will happen something like this....."
http://www.ameinfo.com/61640.html
There are those of us who worry that we are being led into a trap, a cul de sac that could be far more damaging to us than the feared "peak oil".
As OPEC currently eases off production and a world that has slowed economically slows in it's consumption by just a bit, Saudi Arabia is busy.
Equipment is being bought, pipeline installed. Deals are being made. Saudi oilfields, given some "breathing room" are poised. New fields offshore and onshore, held in reserve for the exact moment when it will be most beneficial for Saudi Arabia to pull the trigger. Many in the West are, just as we did some 28 years ago, beginning to doubt them. They are bluffing, it is said, they can't do it. They do not have enough production left to be able to boost output fast and HARD. They are peaked, or darn near it, goes the logic, they can no longer play the swing role.
But, what if we are wrong? What if Saudi Arabia has what it says it has, and what should, if older calculations are correct, what should still be there? Even if Saudi Arabia runs into occasional production hitches, the volume of oil that should still be inside the borders and off the shore of Saudi Arabia are HUGE by the standards of any other nation on Earth, easy to extract, and of fairly good quality (even if not the "champagne" of the glory days).
So what if Saudi Arabia, has the goods, can do it, and decides to break the back of it's competitors, and the will of those who are begging for investment in alternatives? How would it play out?
One presumes it would look a lot like 1982. Just at the moment when competitors were starting to make the big money, when British North Sea oil was getting under way, when solar and transportation alternatives were getting full in gear, the price of crude oil did THE MOST SHOCKING THING POSSIBLE. It began to fall.....and fall.....and fall. Saudi Arabia, which had the easiest to extract, cheapest to extract crude oil in the world was still making money. But places that were harder to drill and more expensive per barrel were deprived of the full fruit of thier efforts. The argument can be made that Britain and Norway were herded into almost giving away a national treasure on the cheap. Someday, when they look back, and see that they sold thier last great endowment of oil for a price that averaged in the high teens to low twenty dollar range per barrel (!!) it will be seen as one of the greatest thefts in history. Likewise Canada, Mexico, Venezuala, and others. The Americans did no better, but at least we enjoyed the bounty, with an economic boom unlike any in history and the luxury "carbon bath", with giant trucks, boats, and planes, and houses as big as cathedrels.
Brace yourself. It could happen again. To paraphrase a haunting line from "Three Days of The Condor"....."It will happen something like this....."
Oil prices begin to climb with the summer driving season. By late summer 2007, the crude price spikes back to over $75 a barrel, maybe $80, setting off alarm bells everywhere. The twin reports from the GAO (General Accounting Office) and the NPC (National Petroluem Council) come out, warning that we are indeed in difficulty on oil and gas. The reports will soft peddle a bit, to cover the arse of industry, but will be direct in pointing out the LONG RANGE issue. American balance of trade is suffering, as we face importing oil and natural gas, carbon release is going up as we turn to coal, and alternatives, while promising, have not had the needed investment to make them scalable. Conservation is good, but is considered a bore by most people, and an admission of failure and an endorsement of poverty by others.
Late summer, 2007, people are beginning to worry again. Natural gas season is coming, and everything depends on the weather. The economy slows. What alternatives there are finally given some support. There is again real interest in the energy issue. Britian continues in very dire condition, with oil production falling and now Norway is starting to show real signs of distress. There is still a lot of oil there, but getting it takes big money. Cantarell in Mexico is at it's moment of truth.
Early 2008 (approx.), the swell begins to hit. Saudi Arabia, THE LAST BIG PLAYER with any leverage, is quietly cutting deals. The business press and TOD start to notice something: Saudi Arabian oil as a percent of world production is climbing and climbing fast. There are references to new fields in production, to Saudi offshore, to large flows from the empty quarter. Crude oil prices begin to flatten (probably at somewhere around $73, and then, begin to slide, at first, the buyers and doomers support the price, sure it is all temporary, but then, back into the $60's. The astute ones, with contacts in Saudi Arabia (CERA?) begin to go short, and recommend short. The dash for the exits is catastrophic to investors who bought the runup. The price drops fast enough to catch many of them flat footed. and it keeps dropping. The Saudi flood is pouring across the globe, and they have probably four to five years they can maintain it. They are playing the game the only way it can be played. They pulled back, let all the alternatives come into play, all the competitors give up their last competitive reserve, and then fired with all barrels, all oil barrels that is. The technicians and investors in solar, in hybrid electric and batteries, and in conservation techniques will be wiped out very quickly. As the crude price bottoms back to about $23 to $28 dollars, money will flee the energy sector, alternative and fossil alike, as fast as it can. The catastrophic callapse of the oil E&P industry will make the 1980's seem like a walk in the park. The last of America's independent oil companies will have thier backs pushed to the wall, and be lucky to survive at all. Investors in oil from the 2000 to 2005 runup will be nearing retirement just as oil stocks collapse, and oil company profitability crashes. The industry will be fully in control of perhaps three multi nationals and the gian national oil companies, ARAMCO more than any other. They will have played the game brilliantly.
Then the Saudi's can ease. Within 4 years or so, they will have to. The new developments they have found to be so lucrative and profitable will be strained, and why give oil away once you have broken the back of all alternatives and competitors? The Americans would have been MUCH better off to have faced the terror of peak oil. They will now have no chance of getting an alternative industry off the ground, have a new generation of consumptive vehicles and large houses, and be pouring money out of the U.S. and into the Persian Gulf at a rate that will be almost impossible to sustain. Peak oil would still be a few years out in front, but for the Americans, the whole peak thing would be a moot point and a sad cruel ironic joke. Because even if the Earth was made of oil, the Americans would have trouble finding the money to buy as much as they were now using. The world at large would be getting close to projected 100 mbd in consumption. But, the limits would be reached very soon. The world, now down to one big swing producer, could not pour money, labor and logistical support in fast enough to make production go higher, even if the oil is still there. Christophe de Margerie of Total would be right....120 million barrels a day, never, and 100 would be almost impossible. The strain at the very limit is just too great.
So, there we would be, about 2012 to 2015, 2020 at the long side, now with the greatest number of old people in the known history of the world, with money pouring out to the Persian Gulf for both oil and natural gas in volumes beyond our ability to imagine possible, and with the single great swing producer now finally, having fired it's final big oil guns, on the edge of complete failure, and the kind of decline we now see in the North Sea. We would have put off action one last time, and allowed the Europeans and Japanese the time to plan and to get in front of us on alternatives that we laughed off as "can't be done."
Too late, we will realize, it would have been a blessing for us if Deffeyes had been right and peak had been Thanksgiving, 2005. At that time, we would have at least had the tools to plan and to build with. Having now waited to the final minute of the final hour, the words of Matthew Simmons will come back to us..."If we do not prepare, no scenario is too dark."
A FLOOD OF SAUDI OIL, WHICH IS FULLY POSSIBLE, COULD BE MUCH, MUCH MORE CATASTROPHIC TO THE UNITED STATES AND THE WORLD THAN SO CALLED "PEAK OIL".
Roger Conner known to you as ThatsItImout
Not a bad scenario. I just don't think the oil is in KSA and further I don't think they could build out the infrastructure fast enough. Your basically talking about them doubling their production in less than 15 years its just not possible. Thus even assuming they have the resources I'd say its a bit of a strech. KSA itself has often said peak production of at best 12 mbd. Sometimes I see 15.
dbl post
U'r absolutely right. Almost all the Outlooks are wrong on KSA. Today, khebab posted the Michael Smith Scenario. Another joker that hasn't done his homework. He shows KSA producing over 14-mbd with a dramatic Decline to 5-mbd by 2050. Yet, in almost every communique they have insisted that they want a plateau from 2012 to 2054 ... at 10-mbd (commonly confused with KSA's 12.6-mbd max sustainable capacity). In May 2005, they openly ridiculed EIA (as i did in 2004) for showing them producing double that in 2030.
While some of the projections have responded with drops of 10-mbd for 2020 or 2030, they are still based on demand ... not project flow analysis. The optimists are dropping their Peak Rates at the rate of 3-mbd/yr. The highest in 2006 was 126-mbd (down from 160-mbd pie-in-the-sky). We will shortly see what the new year brings in rational honesty.
i am no oil expert, not even in the oil business, but i have a wierd gut feeling, (a hunch if you will) oil will fall down to low 40's maybe even upper 30's. while the world feels they were duped by the big mean and evil oil companies, commerce starts back up, suv sales climb again, yada, yada, yada! economic uptopia!. and most everyone thinks the previous run up in price is nothing more than a glitch, as we have had in the past, like in the early 70's and again in early 80's.
I really think this is the quiet before the storm, everyone is content, prices are reasonable, life goes on. politicians are happy, the general public is happy, world population increases, there is no need to prepare for a world with a lack of oil. Then over time (a year maybe?) oil starts to steadily increase to well over 70 maybe even 80 or 90, before people worldwide wake up and realize it will never go back down to 1 yergin or whatever it's called. But then it's too late! demand destruction begins, and well, you get the idea. i really think we are headed for a brickwall, at full steam ahead!!!
oil may be falling, but natural gas is holding at $6, and it's not falling.
preparation is key! self sustainabilty is key! Perhaps the Amish had it right the whole time!
Yes! And there could be a flood of ponies descending from the heavens, nothing but pony, pony, pony, until they smother all life on earth.
smekhovo,
funny, I grant you, but not a reply.
here's the central point: everyone keeps dreaming of the great flood of oil that will be found "out there" somewhere. O.K., ask them what the outcome is if it is actually there? We are already in a war in the Persian Gulf that is becoming a complete trainwreck, gutting America both morally and financially, as we see our troops die for no coherent plan. We are seeing the Saudi's get away with de facto murder as they pour money to the Sunni's in the insurgency, and we can do nothing about, anymore than we could follow out the fact that the terrorists who committed the greatest mass murder of our nations citizens were raised and educated in Saudi religious schools with a blood hatred of Westerners, Americans and Jews in particular, and connected to Saudi's in high places.. We are pouring the nations wealth out of America is a desperate bid to get the last drop of Saudi crude, and soon to begin an equally hopeless push to import natural gas, in which case we are beholden to Qatar in the same fashion we are now beholden to Saudi Arabia.
I beg anyone for an answer: How is a flood of imported cheap oil good for America? We should be praying for peak, and working for alternatives, but everytime we start to get the public interested in and willing to pay for alternatives, the fvckin price of oil collapses! Doesn't that make ANY ONE OF YOU GENUISES SUSPICIOUS???
I am beginning to supect that I am dealing with people so far removed from reality as to be hopeless to talk to.
My point: Peak or no peak don't mean shittt, we are being gamed, robbed and ripped and are too fvckin stupid to know it. We have walked into every trap the Saudi's and thier apologists have laid, and will walk as easily into the next one. We tie our hopes on persuading the American people that peak is nigh, peak is nigh, when what we should be telling them is "you should be praying peak is nigh, because we are being bled to death. If peak is going to bring you slavery and poverty, then you have nothing to fear, because YOU ARE WILLINGLY PAYING THAT PRICE NOW, and will pay it to an almost unbearable degree, soon, peak or no peak. pack that with your fvckin smelly ponies and sh...., opps, getting tired, time to go to bed....:-)
RC known to you as ThatsItImout
agreed! point well taken................
I am beginning to supect that I am dealing with people so far removed from reality as to be hopeless to talk to.
No shit, Sherlock! First time you looked in a mirror?
Yeah, Roger, I'm over sixty. I'm finding your question hilarious because it does seem that half the posters are teenagers or even pre-teens: misspellings, misuse of words, badly constructed sentences, retorts that seem more of the abrasive/defensive style of a youngster than a mature person, unwillingness to admit that their position may very well be wrong for long enough for them to become deceased.
There is also a certain naivete about the various actors on the world stage, especially the assumption that they do not have hidden and malicious [at least against certain other groups] motives. For instance, KSA could well be holding back production and making it seem like depletion, then renting as many rigs as possible as an act of war against the CRUSADING West. Not likely? From the Arabs' point of view, it may seem like a war against them all, and given various posters' opinions on KSA URR, why else would they be doing this.
Bakhtiari's 81-mbd Peak Rate (made in Dec 2003) is interpreted in the graph as CO+NGL. If this was true, his Y2k baseline adopted from ASPO should be 73.5-mbd. It is not. It is 75-mbd.
Colin Campbell published in the Hubbert Centre Newsletter in April 2002 that Y2K supply was 75-mbd incl processing gains.
Colin Campbell again published in his own Feb 2003 Newsetter that Y2k supply was 75-mbd incl processing gains.
Colin invited Bakhtiari to ASPO 2002 for a presentation. They shared their data. Samsam admits this in his Model credits. Samsam compliments Colin often. And vice versa.
Bakhtiari's 2001 baseline is 76-mbd. ASPO does not publish one. IEA's Nov 2003 OMR shows that 2001 supply was 76.7-mbd incl proc gains.
Bakhtiari's 2002 baseline is 77-mbd. ASPO does not publish one. IEA's Nov 2003 OMR shows that 2002 supply was 76.8-mbd incl proc gains.
Bakhtiari's 2003 baseline is 78-mbd. ASPO does not publish one. IEA's Nov 2003 OMR shows that 2003-to-date supply was 78.7-mbd incl proc gains.
Bakhtiari's four baselines are no greater than 0, 0.3, O.2 & 0.7-mbd in error from the ASPO/IEA All Liquids incl proc gains published in the prior weeks to his WOCAP Ver 2.0 model.
Bakhtiari was weaned on ASPO & IEA data that incl proc gains.
If Bakhtiari did not intend to use All Liquids, his baseline for 2000, 2001, 2002 & 2003 would have been reduced by 1.7 to 1.8-mbd in each year to deduct the adopted source proc gains. He chose not to.
In August 2006, Bakhtiari states in an article called Crude Oil - The Day After Tomorrow:
"At present, worldwide consumption of all liquid hydrocarbons stands at around 81 million b/d (give or take one million b/d)."
Everyone on the planet knows what "all liquids" implies. At issue is whether we believe he truly made a 2-mbd error in setting up his Model in 1999 and revised in 2002 and again in 2003 or if he is 4-mbd out today with his 2006 projection compared to IEA's. Clearly he chose recently that it would be better to fall on his sword on the 2-mbd error.
With respect, this means he was either incompetent in 2003 or is a liar now. Choose one. But remember, not a single person in the industry questioned him in Dec 2003 or the following twenty four months why his baseline had such glaring errors. Nobody.
This is the post of a proven liar.
Read it and weep. u and mike bendzela have been played once again. Tired of looking stupid yet?
http://omrpublic.iea.org/omrarchive/13nov03full.pdf Nov2003Supply Tables
http://www.sfu.ca/~asamsamb/conference/WOCAP.htm WOCAP graph
http://www.hubbertpeak.com/campbell/Campbell_02-3.pdf pg6 Table1 75-mbd all liquids incl proc gains Y2K
So why did you make a grossly false statement about this winter in the Yukon, and repeat it when you had been shown how false it was?
Why are u an asshole? Why can't u tell the difference between Celcius and Fahrenheit? I think Environment Canada knows more about Yukon statistics than your mickey mouse efforts.
Your value add to this forum has been ZERO since your first post. U are a cancer ... nothing more.
Truth hurts, eh, proven liar?
From a previous comment:
Below are the EIA's estimates for CO+NGL and "All Liquids" along with the WOCAP model:yr CO+NGL WOCAP ALL
2000 74.9768 74.7154 77.7932
2001 74.8785 75.6911 77.7174
2002 73.9966 76.6667 76.9567
2003 76.5600 77.9675 79.5655
2004 79.8547 78.9431 83.0049
2005 81.2266 80.2439 84.3381
The RMSE is 1.3926 mbpd for CO+NGL and 2.8716 mbpd for the "ALL Liquids". I don't see any evidence that the WOCAP model is closer to the "All Liquids" numbers. The only year where the WOCAP is closer to the All Liquid level is 2002.
Below is the corresponding chart: