Peak Oil Update - December 2006: Production Forecasts and EIA Oil Production Numbers
Posted by Sam Foucher on December 14, 2006 - 11:56am
An update on the last production numbers from the EIA along with different oil production forecasts.

World oil production (EIA Monthly) and various forecasts (2001-2027). Click to Enlarge.
What's new:
- IEA forecast (World Energy Outlook, 2006)
- IEA forecast (World Energy Outlook, 2005)
- IEA forecast (World Energy Outlook, 2004)
- Forecasts for Saudi Arabia
Notations: 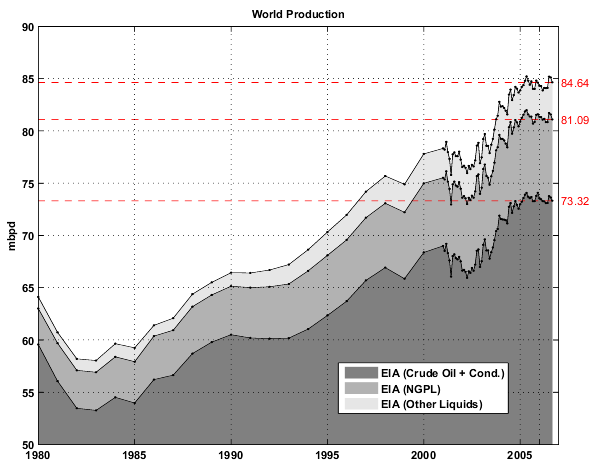
Fig 1.- World production (EIA data). Click to Enlarge.
Table I - Production estimate (in millions of barrels per day (mbpd)) for September 2006 taken from the EIA website (International Petroleum Monthly). 1Moving Average on the last 12 months.
The share of CO is now only 86.62% of the total liquid production.
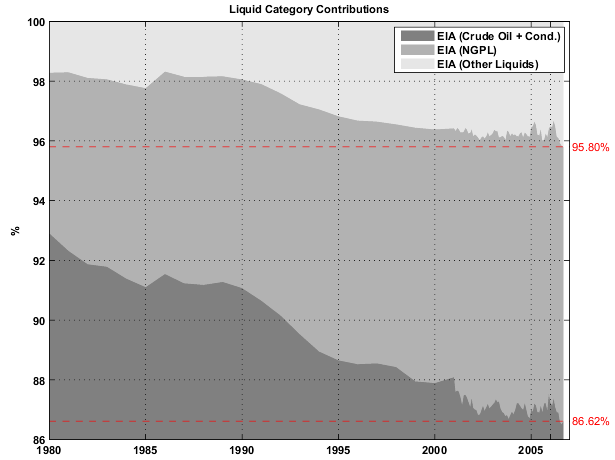
Fig 2.- Share of each liquid category to the total liquid production. Click to Enlarge.
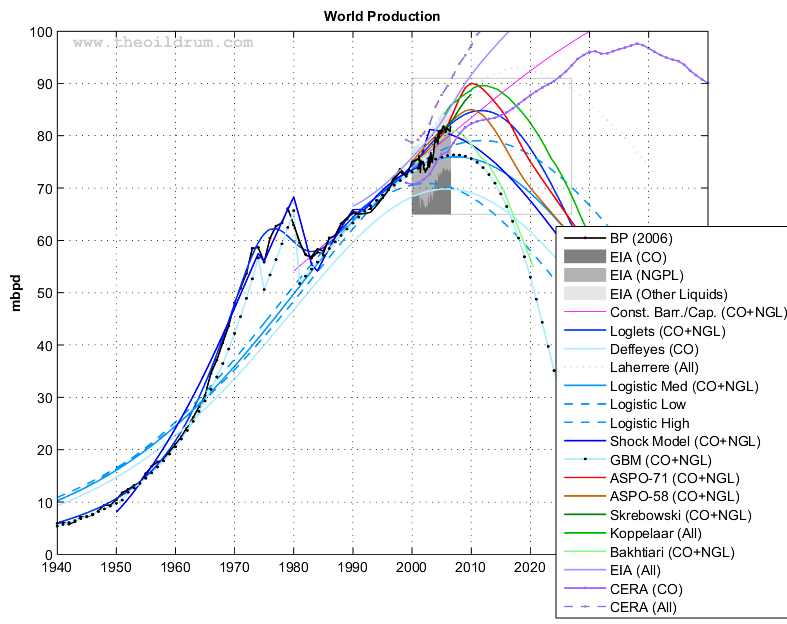
Fig 2.- World oil production (Crude oil + NGL) and various forecasts (1940-2050). The light gray box gives the particular area where the Figures below are zooming in. Click to Enlarge.
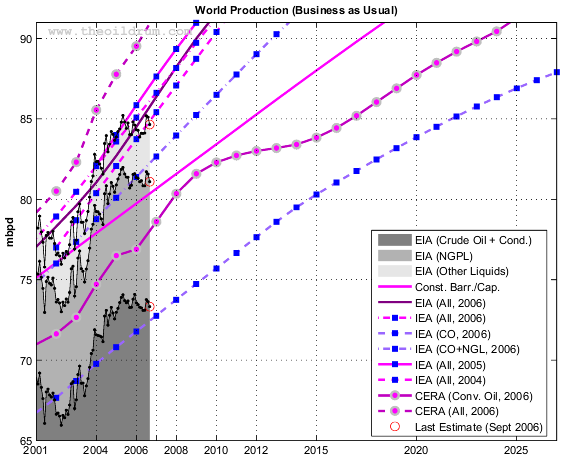
Fig 3.- Production forecasts assuming no visible peak. Click to Enlarge.

Fig 4.- Forecasts by PeakOilers based on bottom-up methodologies. Click to Enlarge.
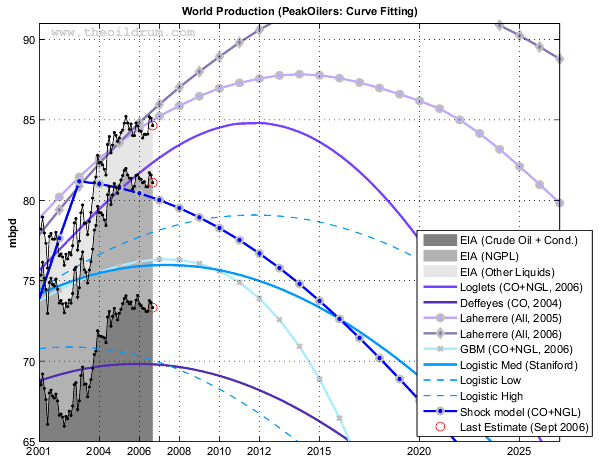
Fig 5.- Forecasts by PeakOilers using curve fitting methodologies. Click to Enlarge.
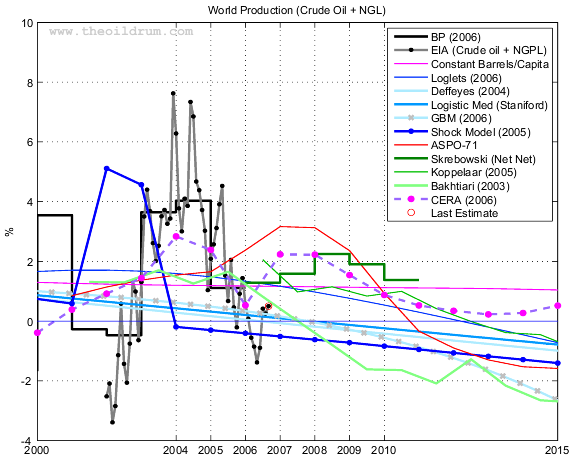
Fig 6.- Year-on-Year production growth. Click to Enlarge.
Table II. Summary of all the forecasts (figures are in mbpd) as well as the last EIA estimates.1Productive capacities.
I've added a simple domestic consumption forecast based on a population forecast by the UN and a constant number of barrels per capita at (see here for details). In order for exports to remain at their 2005 level and assuming the aforementioned consumption model, production needs to grow by (orange dotted line on the charts).
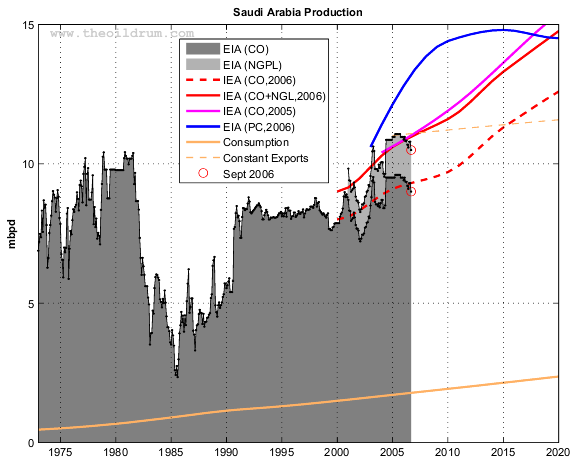
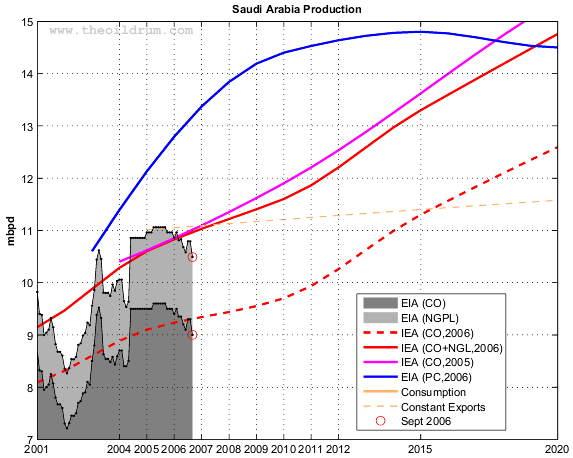
Fig 7.- Saudi Arabia oil production (EIA Monthly) and various forecasts (2001-2020). The EIA estimate is a productive capacity (PC). Click to Enlarge.
Table III. Summary of all the forecasts (figures are in mbpd) as well as the last EIA estimates.1Productive capacities.
October 2006
September 2006
- mbpd= Millions of barrels per day
- Gb= Billions of barrels (109)
- Tb= Trillions of barrels (1012)
- NGPL= Natural Gas Plant Liquids
- CO= Crude Oil + lease condensate
- NGL= Natural Gas Liquids (lease condensate + NGPL)
- URR= Ultimate Recoverable Resource
EIA Last Update (September)
Data sources for the production numbers:
- Production data from BP Statistical Review of World Energy 2006 (Crude oil + NGL).
- EIA data (monthly and annual productions up to July 2006) for crude oil and lease condensate (noted CO) on which I added the NGPL production (noted CO+NGL).
The All liquids peak is now May 2005 at 85.205 mbpd, the year to date average values (9 months) are down from 2005 for all the categories. The peak dates are unchanged for Crude Oil + Cond., NGPL and Crude Oil + NGL (see Table I below).

Fig 1.- World production (EIA data). Click to Enlarge.
| Category | Sept 2006 | Sept 2005 | 12 MA1 | 2006 9 Months | 2005 9 Months | Share | Peak Date | Peak Value |
|---|---|---|---|---|---|---|---|---|
| All Liquids | 84.64 | 84.01 | 84.43 | 84.41 | 84.45 | 100.00% | 2005-05 | 85.21 |
| Crude Oil + NGL | 81.09 | 80.86 | 81.24 | 81.21 | 81.30 | 95.80% | 2005-05 | 81.97 |
| Other Liquids | 3.55 | 3.15 | 3.19 | 3.20 | 3.15 | 4.20% | 2006-09 | 3.55 |
| NGPL | 7.77 | 7.58 | 7.78 | 7.83 | 7.81 | 9.18% | 2005-02 | 8.04 |
| Crude Oil + Condensate | 73.32 | 73.28 | 73.46 | 73.38 | 73.50 | 86.62% | 2005-12 | 74.08 |
The share of CO is now only 86.62% of the total liquid production.

Fig 2.- Share of each liquid category to the total liquid production. Click to Enlarge.
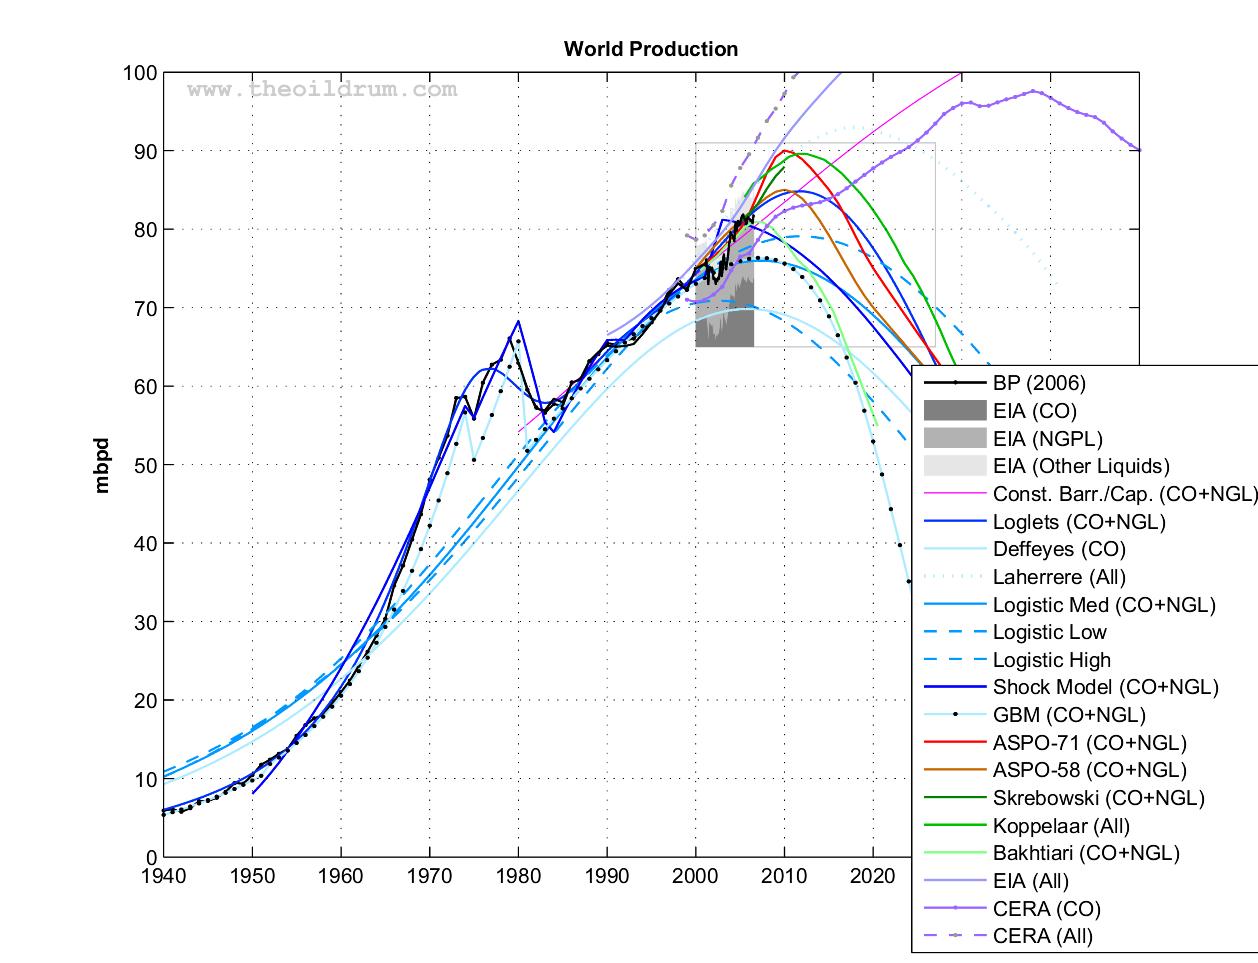
Fig 2.- World oil production (Crude oil + NGL) and various forecasts (1940-2050). The light gray box gives the particular area where the Figures below are zooming in. Click to Enlarge.
Business as Usual
- EIA's International Energy Outlook 2006, reference case (Table E4, World Oil Production by Region and Country, Reference Case).
- IEA total liquid demand forecast for 2006 and 2007 (Table1.xls).
- IEA World Energy Outlook 2006 : forecasts for All liquids, CO+NGL and Crude Oil (Table 3.2, p. 94).
- IEA World Energy Outlook 2005 : forecast for All liquids (Table 3.5).
- IEA World Energy Outlook 2004 : forecast for All liquids (Table 2.4).
- A simple demographic model based on the observation that the oil produced per capita has been roughly constant for the last 26 years around 4.4496 barrels/capita/year (Crude Oil + NGL). The world population forecast employed is the UN 2004 Revision Population Database (medium variant).
- CERA forecasts for conventional oil (Crude Oil + Condensate?) and all liquids, believed to be productive capacities (i.e. actual production + spare capacity). The numbers have been derived from Figure 1 in Dave's response to CERA.
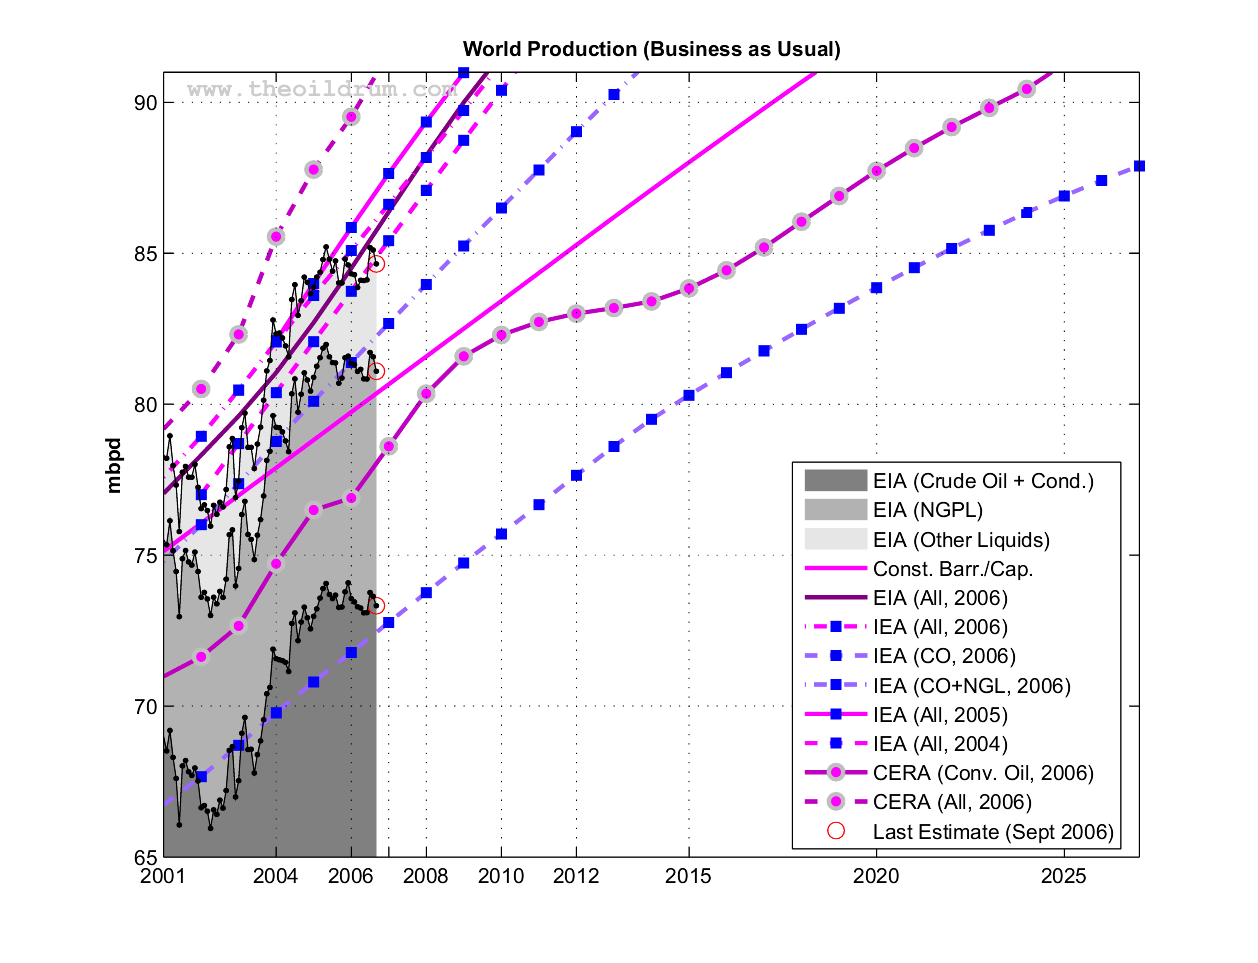
Fig 3.- Production forecasts assuming no visible peak. Click to Enlarge.
PeakOilers: Bottom-Up Analysis
- Chris Skrebowski's megaprojects database (see discussion here).
- The ASPO forecast from the last newsletter (#71): I took the production numbers for 2000, 2005, 2010, 2015 and 2050 and then interpolated the data (spline) for the missing years. I added the previous forecast issued one year and two years ago (newsletter #58 and #46 respectively). There was no revision since August 2006.
- Rembrandt H. E. M. Koppelaar (Oil Supply Analysis 2006 - 2007): "Between 2006 and 2010 nearly 25 mbpd of new production is expected to come on-stream leading to a production (all liquids) level of 93-94 mbpd (91 mbpd for CO+NGL) in 2010 with the incorporation of a decline rate of 4% over present day production".
- Koppelaar Oil Production Outlook 2005-2040 - Foundation Peak Oil Netherlands (November 2005 Edition).
- The WOCAP model from Samsam Bakhtiari (2003). The forecast is for crude oil plus NGL.
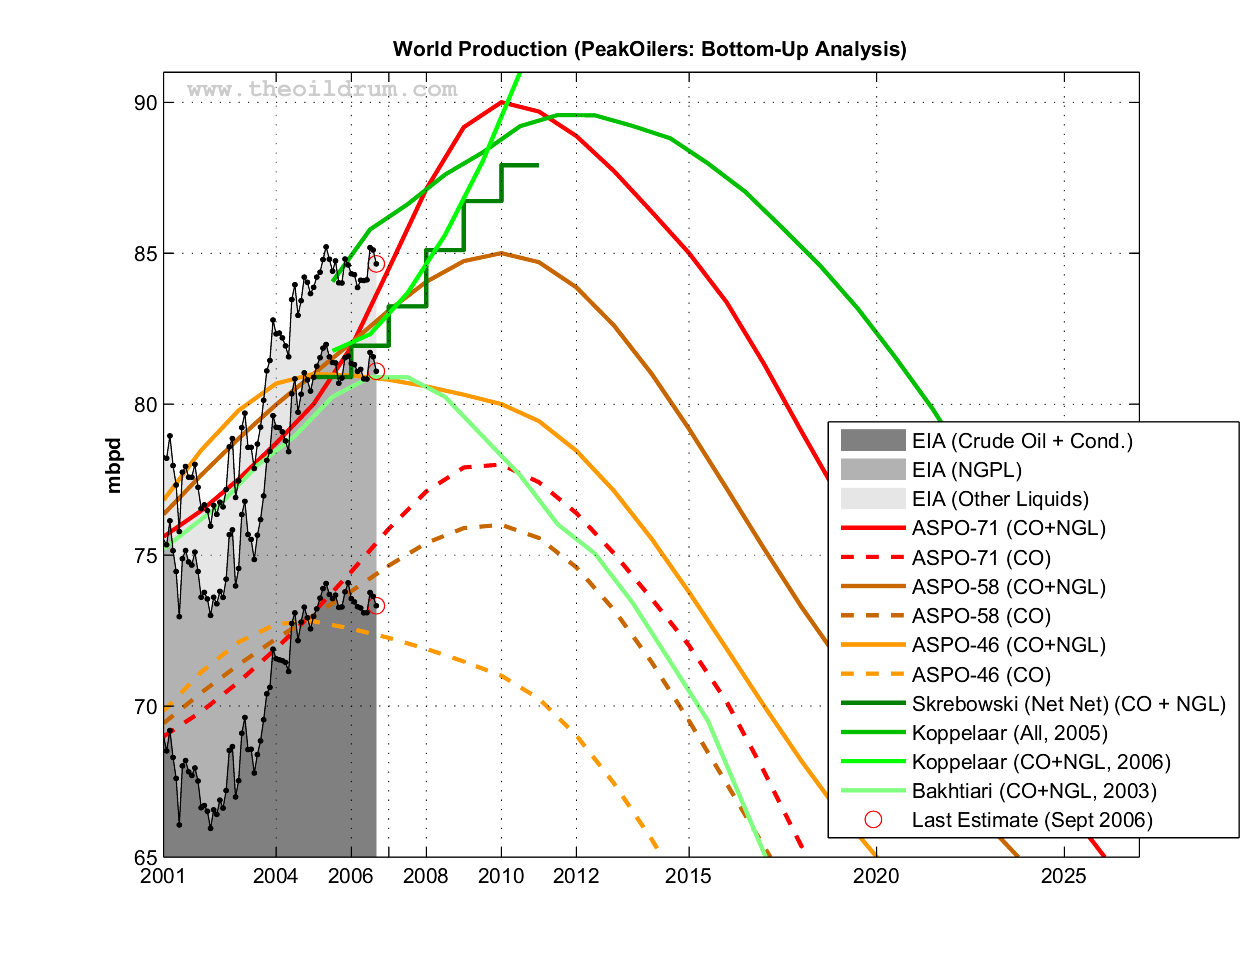
Fig 4.- Forecasts by PeakOilers based on bottom-up methodologies. Click to Enlarge.
PeakOilers: Curve Fitting
The following results are based on a linear or non-linear fit of a parametric curve (most often a Logistic curve) directly on the observed production profile:- Professor Kenneth S. Deffeyes forecast (Beyond Oil: The View From Hubbert's Peak): Logistic curve fit applied on crude oil only (plus condensate) with URR= 2013 Gb and peak date around November 24th, 2005.
- Jean Lahèrrere (2005): Peak oil and other peaks, presentation to the CERN meeting, 2005.
- Jean Lahèrrere (2006): When will oil production decline significantly? European Geosciences Union, Vienna, 2006.
- Logistic curves derived from the application of Hubbert Linearization technique by Stuart Staniford (see this post for details).
- Results of the Loglet analysis.
- The Generalized Bass Model (GBM) proposed by Prof. Renato Guseo, I used his most recent paper (GUSEO, R. et al. (2006). World Oil Depletion Models: Price Effects Compared with Strategic or Technological Interventions ; Technological Forecasting and Social Change, (in press).). The GBM is a beautiful model that has been applied in finance and marketing science (see here for some background). The estimation in Guseo's article was based on BP data from 2004 (CO+NGL).
- The so-called shock model proposed by TOD's poster WebHubbleTelescope . You can find a description of his approach on his blog here. The current estimate was done in 2005 based on BP's data.
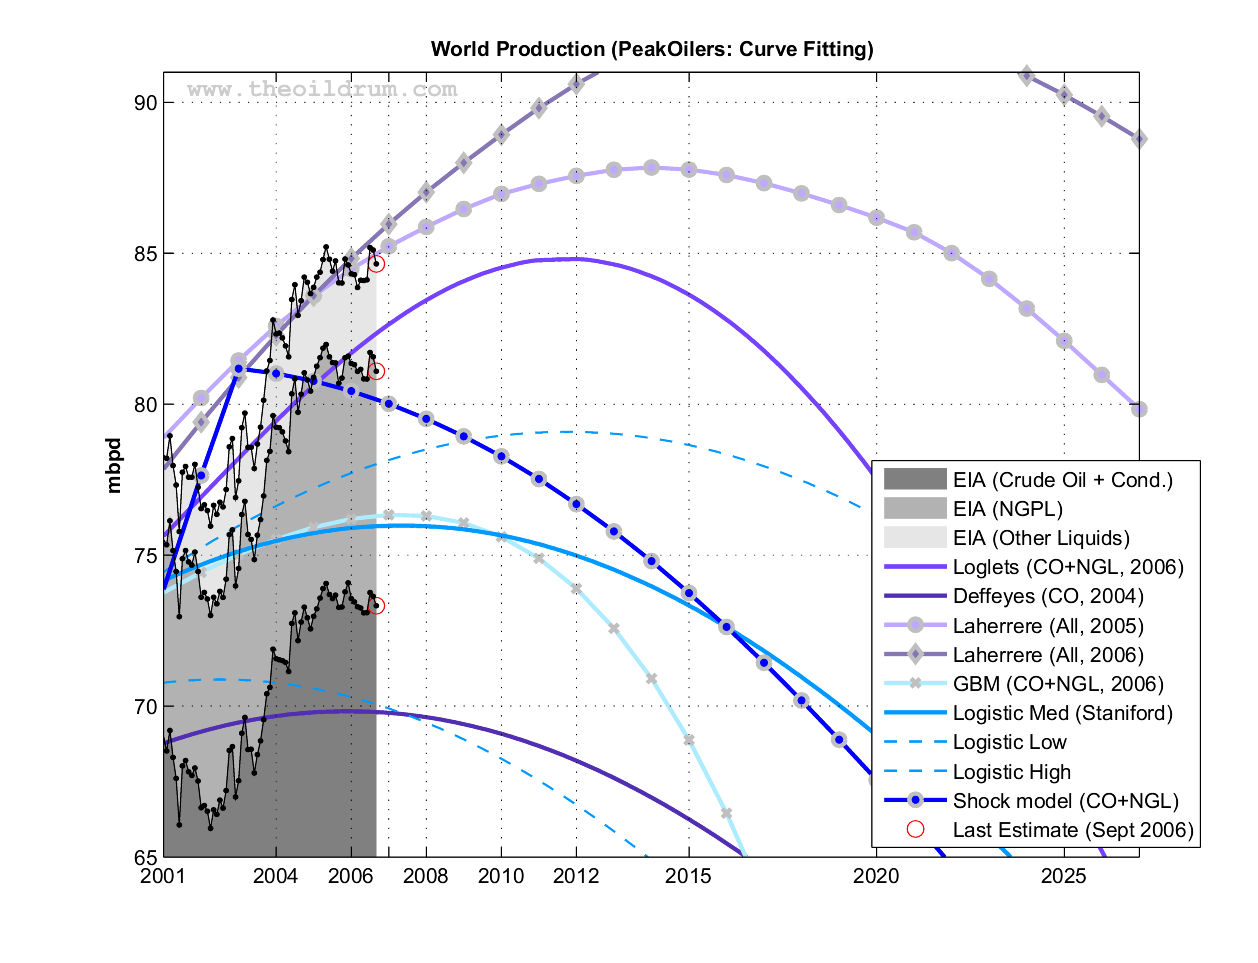
Fig 5.- Forecasts by PeakOilers using curve fitting methodologies. Click to Enlarge.
Production Growth
The chart below gives the year-on-year production growth (or decline) for each month. Growth has been weak (below 1%) most of the year but went back in positive territory since last July.
Fig 6.- Year-on-Year production growth. Click to Enlarge.
| Forecast | 2005 | 2006 | 2007 | 2010 | 2015 | Peak Date | Peak Value |
|---|---|---|---|---|---|---|---|
| All Liquids | |||||||
| Observed (EIA) | 84.49 | 84.41 | NA | NA | NA | 2005-05 | 85.21 |
| Koppelaar (2005) | 84.06 | 85.78 | 86.61 | 89.21 | 87.98 | > 2011 | > 89.58 |
| EIA (IEO, 2006) | 82.70 | 84.50 | 86.37 | 91.60 | 98.30 | > 2030 | > 118.00 |
| IEA (WEO, 2006) | 83.60 | 85.10 | 86.62 | 91.30 | 99.30 | > 2030 | > 116.30 |
| IEA (WEO, 2005) | 84.00 | 85.85 | 87.64 | 92.50 | 99.11 | > 2030 | > 115.40 |
| IEA (WEO, 2004) | 82.06 | 83.74 | 85.41 | 90.40 | 98.69 | > 2030 | > 121.30 |
| CERA1 (2006) | 87.77 | 89.52 | 91.62 | 97.24 | 104.54 | > 2035 | > 130.00 |
| Lahèrrere (2006) | 83.59 | 84.82 | 85.96 | 88.93 | 92.27 | 2018 | 92.99 |
| Lahèrrere (2005) | 83.59 | 84.47 | 85.23 | 86.96 | 87.77 | 2014 | 87.84 |
| Crude Oil + NGL | |||||||
| Observed (EIA) | 81.37 | 81.21 | NA | NA | NA | 2005-05 | 81.97 |
| IEA (WEO, 2006) | 80.10 | 81.38 | 82.67 | 86.50 | 92.50 | > 2030 | > 104.90 |
| ASPO-71 | 80.00 | 81.90 | 84.48 | 90.00 | 85.00 | 2010 | 90.00 |
| ASPO-58 | 81.00 | 82.03 | 83.10 | 85.00 | 79.18 | 2010 | 85.00 |
| ASPO-45 | 81.00 | 80.95 | 80.80 | 80.00 | 73.77 | 2005 | 81.00 |
| Koppelaar (2006) | 81.76 | 82.31 | 83.68 | 91.00 | NA | > 2010 | 91.00 |
| Bakhtiari (2003) | 80.24 | 80.89 | 80.89 | 77.64 | 69.51 | 2006 | 80.89 |
| Skrebowski (2006) | 80.90 | 81.42 | 82.59 | 87.32 | NA | > 2010 | 87.92 |
| Staniford (High) | 77.45 | 77.92 | 78.31 | 79.01 | 78.51 | 2011-10 | 79.08 |
| Staniford (Med) | 75.81 | 75.94 | 75.97 | 75.52 | 73.00 | 2007-05 | 75.98 |
| Staniford (Low) | 70.46 | 70.13 | 69.71 | 67.92 | 63.40 | 2002-07 | 70.88 |
| Loglets | 81.12 | 82.14 | 83.02 | 84.65 | 83.26 | 2012-01 | 84.80 |
| GBM (2003) | 76.06 | 76.27 | 76.33 | 75.30 | 67.79 | 2007-05 | 76.34 |
| Shock Model (2006) | 80.76 | 80.43 | 80.01 | 78.27 | 73.74 | 2003 | 81.17 |
| Constant barrels/capita | 78.81 | 79.73 | 80.66 | 83.42 | 88.01 | > 2050 | > 110.64 |
| Crude Oil + Lease Condensate | |||||||
| Observed (EIA) | 73.58 | 73.38 | NA | NA | NA | 2005-12 | 74.08 |
| IEA (WEO, 2006) | 70.80 | 71.78 | 72.77 | 75.70 | 80.30 | > 2030 | > 89.10 |
| CERA1 (2006) | 76.49 | 76.89 | 78.60 | 82.29 | 83.83 | > 2038 | > 97.58 |
| ASPO-71 | 73.10 | 74.45 | 75.87 | 78.00 | 72.00 | 2010 | 78.00 |
| ASPO-58 | 73.00 | 73.80 | 74.65 | 76.00 | 69.50 | 2010 | 76.00 |
| ASPO-58 | 72.80 | 72.56 | 72.25 | 71.00 | 63.55 | 2005 | 72.80 |
| Deffeyes (2004) | 69.81 | 69.81 | 69.71 | 68.90 | 65.88 | 2005-12 | 69.82 |
Saudi Arabia
The Figure 7 below gives Saudi Arabia production for crude oil and NGPL (data from the EIA: Monthly Energy Review for CO and the International Petroleum Monthly for NGPL).- IEA World Energy Outlook 2006 : forecasts for CO+NGL and Crude Oil (Table 3.2, p. 94).
- IEA World Energy Outlook 2005 : forecast for All liquids (Table 3.5).
- EIA, International Energy Outlook 2006 : World Oil Production Capacity by Region and Country, Reference Case, 1990-2030 (Table E1, p. 155).
I've added a simple domestic consumption forecast based on a population forecast by the UN and a constant number of barrels per capita at (see here for details). In order for exports to remain at their 2005 level and assuming the aforementioned consumption model, production needs to grow by (orange dotted line on the charts).
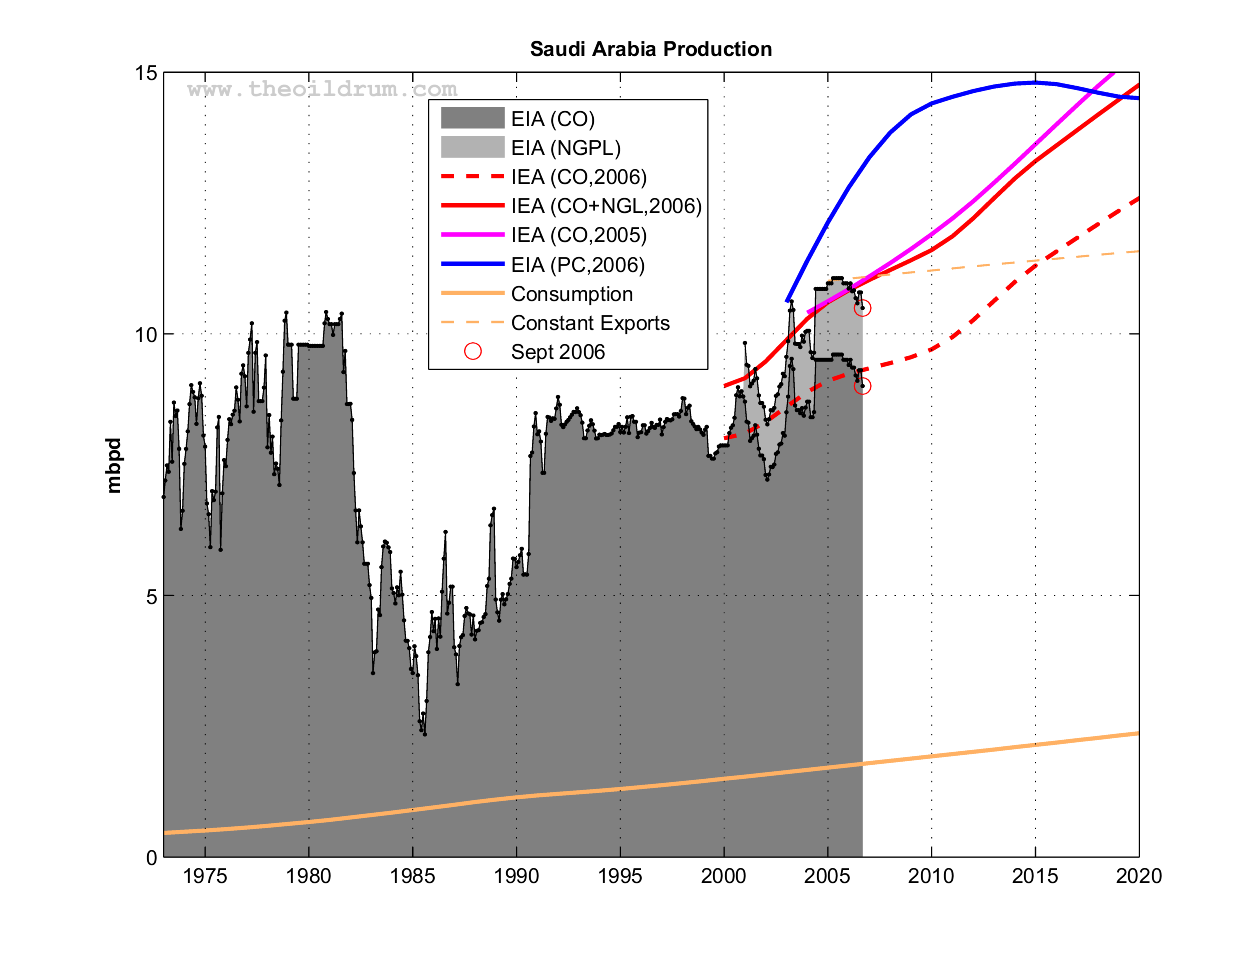
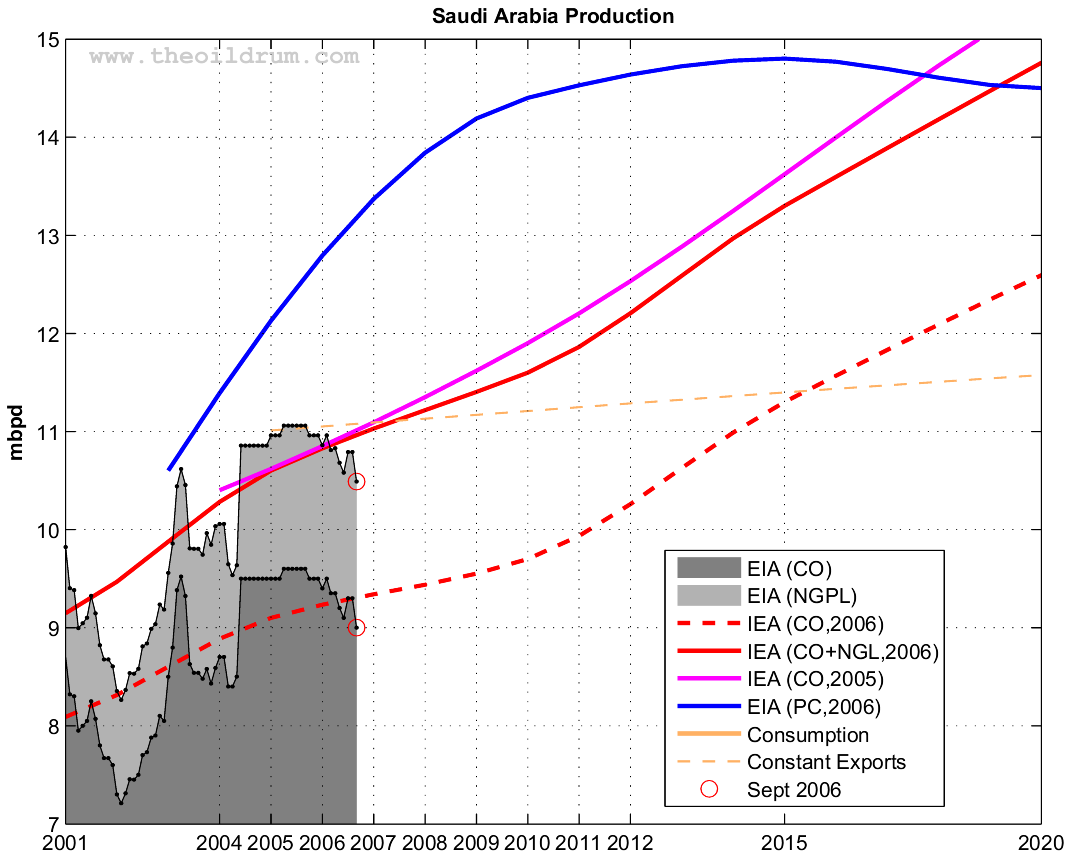
Fig 7.- Saudi Arabia oil production (EIA Monthly) and various forecasts (2001-2020). The EIA estimate is a productive capacity (PC). Click to Enlarge.
| Forecast | 2005 | 2006 | 2007 | 2010 | 2015 | Peak Date | Peak Value |
|---|---|---|---|---|---|---|---|
| Crude Oil + NGL | |||||||
| Observed (EIA) | 11.01 | 10.75 | NA | NA | NA | 2005-04 | 11.06 |
| IEA (WEO, 2006) | 10.60 | 10.83 | 11.03 | 11.60 | 13.30 | > 2030 | > 17.30 |
| IEA (WEO, 2005) | 10.62 | 10.85 | 11.09 | 11.90 | 13.62 | > 2030 | > 18.20 |
| EIA (IEO, 2006) | 12.13 | 12.79 | 13.37 | 14.40 | 14.80 | 2015 | 14.80 |
| Crude Oil + Lease Condensate | |||||||
| Observed (EIA) | 9.55 | 9.28 | NA | NA | NA | 1980-11 | 10.41 |
| Consumption | |||||||
| Cont. Barrels/Capita | 1.71 | 1.75 | 1.79 | 1.92 | 2.14 | > 2050 | > 3.43 |
Next update in January.
Previous Update:
November 2006October 2006
September 2006
Peak Oil Update - December 2006: Production Forecasts and EIA Oil Production Numbers
PDF version
199 comments
Peak Oil Update - December 2006: Production Forecasts and EIA Oil Production Numbers
PDF version
199 comments
“To be thrown upon one's own resources, is to be cast into the very lap of fortune; for our faculties then undergo a development and display an energy of which they were previously unsusceptible.”
—Benjamin Franklin
Contact
- Content: editors at theoildrum dot com
- Tech support: support at theoildrum dot com
License

This work is licensed under a Creative Commons Attribution-Share Alike 3.0 United States License.
Khebab, I'm cosistently awed by your mathematical skills, your information gathering ability and great summaries. You da man!
And also must have one of the worlds most understanding wives. I just hope this info gets diseminated to the media and to world politicians, its incredibly important to the whole planet, and its implications are frightening. How can anyone with two or three brain cells firing in sequence not see that we have to conserve and change!
Indeed!
Thank you very much for the time and effort you put into your charts and commentary.
Regards,
Gunga
I believe that we are seeing a similar divergence between the conventional wisdom regarding Saudi Arabia and what the HL model predicts. Right now, the production data fit the HL model.
Almost everyone in the Texas oil patch--except for a handful of people who believed Hubbert--was shocked when Texas production fell instead of increasing, after the RRC went to a 100% allowable.
The worst disservice to the human race right now is the politicalization of issues of scientific fact. We're now another 6 or 8 years into climate change because of this craziness
As for the politics of it: energy waste is a political problem, not a geological one. If you want to solve it you have to talk politics, not science.
GW gives climate change and a need for more fuel for airconditioning, massive infrastructure change and new farming conditions.
Peak Oil gives a shift from natural gas and sweet light oil to heavy oil, tar sands, coal and lower EROEI proceses giving far more CO2 emissions per m3 of ready to use fuel.
These two threats accelerate each other in a scary way.
The "massive infrastructure change" needed to combat GW is not much different from that needed for PO. Both can most effectively be attacked with conservation and renewables. Sure... there are a lot of desperate ideas floating around about CO2 sequestration but that is all theory on the scale needed. Wind and solar can be made reality in no time.
I agree that GW might succumb to the desperation about PO. Which is why it is even more important to seperate the two issues and solve GW first. Its solution automatically includes the correct solutions to the PO problem, while the opposite is not true.
In the local debate I advocate investments that have more benefits then only lowering the CO2 emissions, there are plenty of such opportunities.
What I find the hardest to accept about both the GW and the PO problem is that all serious solutions will require decades to actually show any effect at all. For someone with a short attention span that is torture. And I am sure that a lot of people emotionally link the impossibility for short-term succes to really bad long term odds.
Any idea what do about that?
The problem really begins to be real when people are trying to solve PO without any regards to GW by converting coal to hydrocarbons. Now that would be a catastrophy and I hope we have the sanity not to do that.
I agree with the conclusion that they stem from the same problem: greed.
You say .."oh we will just do this and then do that and we will be fine"....
"Just cut half the sheet metal off our cars and we can drive all we want."
Who needs AC when the sun is shining just use PV and solar cells. Like 'boom' , their in place..let the good times roll.
Tell me...that good stuff your puffing on...can I get some so I can quit worrying about life? Sixty eight years at this and a whippersnapper , snapping his whipper tells how to live thru the worst diaster in the worlds history with just a few motley phrases.
Were you here during the 70's? I was. In the middle of madness on a day when the oil embargo was announced. You likely were not. You have no clue as to what it was like nor what it will be like.
"Were you here during the 70's?"
Sure. I remember seeing empty highways and I remember living through it with no damage whatsoever, just like everyone else. Where was that global catastrophy back then? What happened? We are still here, spending $450 billion for Christmas. So what was the big deal? Can you tell me? That you won't be able to get the toys you want for Christmas for a couple of years? Is that what it is?
"You have no clue as to what it was like nor what it will be like."
Sure I do. It will be the day when I will have difficulty getting a seat on the train. Big deal. Not.
It will be the day when people will wake up and ask themselves why they had to buy that stupid SUV.
It will be the day they discover that the two sticks attached to their body are for walking and that there is a store in the neighbourhood they can walk to.
It will be the day a lot of bikes will get a second lease on life.
And then people will figure out that putting three more colleagues into their SUV every fourth day can cut their commute cost by a factor of almost four.
And that if enough people will share rides, they will get to work almost twice as fast because there won't be any congested highways.
And a week later there will be plenty of gas again at the gas station, again. Big deal...
PO does not mean we are running out of oil. It means we are running out of cheap oil.
It means that wasting it will come at a price that will make you think twice instead of not at all. Big deal. Some people think about it twice already.
Not out of necessity but out of a feeling of responsibility. That is not a big deal, either, just a function of maturity and how you were brought up.
Of course, thinking sometimes leads to headaches, so I expect aspirin to sell well during those weeks.
Are suffering from Angst about the future? I am sorry to hear that, but a lot of people do. You are not alone. A shrink can help with the Angst and a smaller car can help with the cost of gas. The shrink will be a lot more expensive than the cost of gas, even if you keep driving that Hummer.
Don't get me wrong... this is not about me knowing everything. This is about me not being afraid. This is about me looking forward to things that are not completely knowable. To me the spice of life is what hides behind the next corner and the corner after that. PO is nothing to be afraid off. It has been behind that corner for fifty years. In other words... you could have known about it since you are 18, it was not exactly a government secret... and you mean to tell me you didn't?
Squalish mentioned New York City traffic will be in a congested gridlock 24/7 by the year 2030. right here
remembering the 70's traffic is one thing, but bear in mind, world population has doubled since around 1960. only 45 years ago! And we are all more prosperous, i.e more cars on the road!
While science and medicine help us live longer, it also changes the balance of world population to the positive! i mean positive as in more people!
how does that saying go?
Careful what you wish for! It might come true.
This is not about why this is happening or what variable is to blame most. This is about how to solve the resulting problems.
Again, prosperity and the number of cars one owns do not go hand in hand. An old saying that I know goes like this:
"One arse can only ride on one horse at a time."
Gas in my neighborhood is currently $2.25/gallon.
With adjustments for the CPI, that is $1.97/gallon in 1999 dollars.
I think everyone here agrees that the CPI measure is totally bogus, and likely underestimating inflation by half. That would put us at $1.69/gallon if we could still buy gas with 1999 dollars.
If you then factor in the 16% drop of the USD over the past 6 years (the USD Index was right around 100 in 1999, and is at 83.65 today) gas is selling at $1.41.
Yes it's up a little bit, but not nearly as much as it seems.
That's correct, I've made the correction.
re: one thing that strikes me is that the three entities, CO, CO+NGPL, and all liquids graphs all move in lockstep.
I don't think they do, it's probably an artifact due to the fact that the curves are stacked on top of each other. In particular, the growth in the "Other Liquids" category has been very strong lately and exhibit strong seasonal fluctuations probably because of Ethanol.
A different way to present the curves on Fig. 1:
Notice the two big swings in summer 2005 and 2006, I believe it's related to Ethanol production (May RR could confirmed). CO has increased only by 25% since 1980 but NGPL and and "Other Liquids" productions have increased by 125% and 200% respectively.
Kind of important since w/w ethanol prod was around 800 kbpd last year ( 1.6mm boed?) and looks to be much higher in '06. US capy alone - existing or under construction - stands at over 600 kbpd ( 1.2mmboed?)
Maybe you'd have to add in part of a barrel of biodiesel to get a legit boe, but giving bio r/p parity with crude is misleading from a w/w liquid fuels standpoint.
http://www.energyeconomist.com/a6257783p/wpsr/graphs/WTESTUS1.gif
The figure below is giving the cumulated corrections for each fuel category for each month since 2005:
The red line is the resulting correction for the annual production value. We can see that 2005 has been corrected upward for NGPL, and Other Liquids but the correction is downward for 2006 for CO and other liquids. In total, the 2005 production for all liquids has been corrected by + 0.4 mbpd.
I will try to maintain this chart in the next updates.
Is there any significance to CO being correct lower in 06?
How are these corrections determined?
The explanations for the corrections are given here.
In this release of the International Petroleum Monthly (IPM), United States petroleum data for 2005 have been revised to match data in the Energy Information Administration's recently released Petroleum Supply Annual 2005, Volume 1 and Volume 2. Revised data are shown in bold italic font.
In this release of the International Petroleum Monthly (IPM), petroleum demand data for OECD countries, other than the United States and the U.S. Territories, have been revised for 1984 and for 1990-1994 based on the International Energy Agency's (IEA) annual review of historical OECD petroleum data, the results of which were released in the August 11, 2006 version of the IEA's Monthly Oil Data Service. Revised data are shown in bold italic font.
In this release of the International Petroleum Monthly (IPM), petroleum demand data for OECD countries, other than the United States and the U.S. Territories, have been revised from 1995 forward based on the International Energy Agency's (IEA) annual review of historical OECD petroleum data, the results of which were released in the July 12, 2006 version of the IEA's Monthly Oil Data Service. Revised data are shown in bold italic font.
Am I missing something? It seems to say the numbers were revised because they were reviewed.
But what causes the discrepancy?
Having not expertise in oil, I don't think my opinion holds much weight, but I've been in the PO not quite yet crowd. I'm starting to wonder.
The other thing is probably that a lot of people in America discover that they can produce just as much with less oil. In other words: there is a slight increase in efficiency. We will see more of that.
Similarly, if we see a recession soon with negative worldwide growth and yet we fail to see the cost of oil decrease as expected in a recession scenario, this too would be suspicious that we are actually peaking.
Exactly what I'm thinking..
In addition their should be more volatility in traditional indicators. Production/Supply/Price. Unless I'm flat wrong we should see large confusing swings in various metrics next year before depletion can create a clear signal.
Complex system have to go through this noisy regime first before they stabilize.
Think of it as the few minutes/seconds between when a airplane is comfortably cruising and when the engines shut down because of lack of fuel or mechanical failure.
All complex systems exhibit chaotic behavior as they transition between stable regimes.
What I find a real mind bender is quantum mechanics actually ensures the system cannot stay in a unstable state classical mechanics cannot make such a statement.
The underlying reason is in quantum mechanics the system actually knows where the next stable state is, classical mechanics does not allow the system to probe its potential well.
"Standard Quantum Mechanics" is inexplicable and with many conceptions that defy common sense. (Einstein:"spooky action at a distance,etc,etc....)
"Classical Quantum Mechanics" not so.
I believe you have them reversed. Nothing is definite in Standard. All rules become broken. Electrons are neither wave nor particle, until observed by a conscious sentinet being.
"Are humans smarter than electrons?"
airdale--electrons are my game (former electronics technican,instructor,etc)
I was talking about the differences between classical physics and standard quantum mechanics with classical potentials not wave/field quantum. You don't need to invoke wave mechanics standard quantum mechanics with classical wells can force a system towards stability. You do however have to use wave mechanics to explain the ability of a quantum system to explore its phase space. In classical quantum you just get the Heisenberg Uncertainty Principle you don't really answer why.
I'm not convinced wave mechanics even answers why.
I do admit that I've never seen any one do a full wave treatment for a classically chaotic system. I'm not sure its possible except with quantum computers which is interesting in and of itself.
Their are some cites that point to work here
http://adsabs.harvard.edu/abs/1987AnPhy.173..355F
http://cat.inist.fr/?aModele=afficheN&cpsidt=13635943
One big reason I left the field is I did not feel that quantum chaos research accomplished much if any increase in our theoretical framework. It was initially interesting for modeling various systems but not for expanding the framework.
Good stuff I'm sure.
Just to bring this crazy thread even remotely on topic.
The underlying problem with physics is it does not know what time it is. Cosmology makes a educated guess but its has serious problems (dark matter/energy). Beyond this it gets worse.
So although physics is great for modeling what systems can do it can't tell when a system is going to do anything.
Peak oil is a very similar problem we all know oil production will peak one day and decline the problem is we don't know when.
Some people think we must prove when. My experience is that answering when type questions are not ones we can do well if at all. The reason is our physics and math intrinsically does not do when.
In short we have no clue what time it is at any scale factor.
"So although physics is great for modeling what systems can do it can't tell when a system is going to do anything."
Which system? I can tell you that a stone if left to its own devices in a gravity field will immediately begin to follow the field lines towards the minimum potential. The same is true for most systems. Even a nuclear decay is a well defined phenomenon in time. When is it happening? Well, the very moment the excited nuclear state is created, of course. The only problem to the experimentalist is that there is no way to predict the exact moment of "the collapse of the wave function", to use an old and pretty unfortunate term. But the decay itself sets in immediatelly...
I would leave physics out of all of this. It is a bad example. All we are dealing with here is mass psychology. The question is much more one of "How to wake up sleeping beauty?". In Europe people woke up 30 years ago and started teaching their children. Today everyone is pretty much on the same page. In the US teaching children about reality seems to take second place to teaching them how to throw a pass or put a ball through a metal loop. And that is where the problem originates...
You actually proved my point on time in attempting to disprove it about time. You say there is no way to predict the exact moment ... I disagree instead our current knowledge base does not allow us to make such a prediction.
This is a side effect of our inability to understand real time itself.
We do understand the differentials very well.
From a math view point knowing the first and second etc differentials does not allow you to integrate a curve.
Math integration just shows a smooth curve has certain derivatives but the reverse is impossible to prove since a infinite number of curves can have the same derivatives for
a ( hint hint small enough time interval )
At the smallest scales everything is a point or is it a ring or is it a plane or wait can we even determine dimensions ...
I'll just finish this by saying I think the Universe actually has a variable number of dimensions real time is tied tightly to this dimensional flipping.
From a quantum standpoint think of it as a potential well oscillating between one and two .. n dimensions. This beat is time. The reason modern physics has stalled is no one has considered a universe that can vary its dimensionality.
Or at least we are just now looking.
http://arxiv.org/abs/astro-ph/0012157
http://citeseer.ist.psu.edu/353170.html
I argue that the universe has not changed and fundamentally
undergoes dimensional changes routinely.
To move closer to the topic at hand but using your second statement. The argument is is it time to wake up people to peak oil and transition.
The best argument against moving away from a oil based economy is quite simple. Consider 2 billion people in China and India living as Americans do ...
Not possible and its pretty obvious that attempts to accomplish this based on our current usage are doomed to wreak havoc on the planet.
Therefore if we want to increase the global quality of life a oil based economy is not the one that will accomplish the goal.
All peak oil does is remind us that we may have both a limited amount of time to change and the longer we wait the less options we may have.
Are we as a planet capable of such action ?
I have my doubts.
Worse I think that we don't really have any second choices. Things like using ethanol to prob up the status quo are doomed to failure. So in the bigger picture we are in my opinion forced to make the right decisions its simply a matter of how much pain and suffering we endure before we adopt a sustainable world culture.
I of course advocate recognizing this and simply moving 100% to identifying how allow the planet to live in a comfortable sustainable manner and making the transition.
As long as people believe they can somehow beat the system we wont ever change.
Right now even enlightened people take the approach of trying to protect themselves through financial and physical moves that they hope will result in them being well off dammed the rest. It is only for short time periods that people follow the approach that collective wealth is better than concentrated wealth.
The fact that this tendency needs to be beaten is what leads me to doubt we will make it to sustainability without a lot of pain and suffering.
Is my crazy physics argument different from convincing people they must change I actually don't see the difference myself. The problem is no one wants to see the truth.
I could well be wrong in my physics theory but on the same hand anyone that really knows physic's knows our current theories are dead wrong at a fundamental level. I think you can see why I left physics, I reached the point that I started questioning the fact we can't predict the exact time of some event which is one of the "forbidden" questions of physics.
Funny enough I side with Einstein on the fact god does not play dice with the universe I just think that the universe is far stranger then Einstein wanted to accept.
http://universe.nasa.gov/DarkEnergy/N_Gorkavyi_poster.pdf
The same with peak oil/ sustainable living everyone knows that the way we live is literally "dead" wrong but...
Thus both problems are equally intractable in a short amount of time. I.e we will only accept the real universe after probably thousands of years of thought experiment and argument. And on the same hand it will take hundreds if not thousands of more years before we achieve the ability to accept equal physical wealth for all. The theoretical end point for the American Dream is we all live in mansions with massive amounts of physical goods. We may actually achieve this one day but we have to first accept that they must be energy neutral mansions and goods. That is the point most people on earth refuse to accept even though its obviously true.
The irony does not escape me.
I'll take that chance and assume your post was serious.
Not sure what you call "real time"... time is not an integrable variable (state variable), there is not "one time"... see the twin paradox. The integral of time depends on your exact path in spacetime. Time is a little bit like entropy in that regard... there are limits to how time connects two spacetime points but there are many different ways to get from one to another within those limits... each one having its own eigentime. So far physicists have not observed a system in which something other than eigentime was the local parametrization of physical dynamics.
"I argue that the universe has not changed and fundamentally
undergoes dimensional changes routinely."
You mean since the very early universe? And even that is merely speculative... we don't have any observations that would probe such an early event. Maybe you should elaborate on that thought.
"Consider 2 billion people in China and India living as Americans do .."
Why would I do that? Few people in the world really want to live EXACTLY the same way as Americans do. And those who do can simply come to America. The Chinese will find their own way of living, just like the Europeans. The way Americans will live 50 years from now will be very different from how they are living today. Losen up... this is not a one-fits-all-solution problem.
Is the planet capable of being transformed into one big L.A. or one big suburb of Denver? Of course not. But why in the world would that be necessary? Is it that great to live in L.A. or in the suburbs of Denver?
"As long as people believe they can somehow beat the system we wont ever change."
Not everyone is constantly trying to beat the system. Very few are, actually. Most people are sane and are simply trying to have a little fun in life and take it easy.
"Things like using ethanol to prob up the status quo are doomed to failure. "
Ethanol was never meant to prop up the status quo. It is simply government pork for certain political interest groups. There is really not much else behind it...
"Right now even enlightened people take the approach of trying to protect themselves..."
I guess I don't know many enlightened people, then. Or I just don't know any people who live in fear that the changes to come will mean the end of the world as they know it?
"Is my crazy physics argument different from convincing people..."
Bad physics is simply bad physics. It has nothing to do with any argument regarding PO or necessary changes to the American Way of Life.
"I could well be wrong in my physics theory but on the same hand anyone that really knows physic's knows our current theories are dead wrong at a fundamental level."
Physicists tend not to call a theory which can predict the hyperfine structure constant to one part in a billion from first principles a failure. But then again... you are free to submit your version of QED to Phys. Rev. Letters anytime you like. It will be peer reviewed and published if it can do better than the state of the art.
"Funny enough I side with Einstein on the fact god does not play dice with the universe I just think that the universe is far stranger then Einstein wanted to accept."
I usually find that people who like to speculate about what Einstein thought about the universe know next to nothing about the universe, very little about Einstein and lack a certain respect of the man and his accomplishments. Same for Newton and Galileo. Let's just leave it at that...
What exactly is the logical connection between dark energy and PO?
"I.e we will only accept the real universe after probably thousands of years of thought experiment and argument."
Thought experiments? What would they do for us? Scientists only use thought experiments to illustrate facts which are derived from real experiments. They are a teaching tool and they help to clarify concepts. And that is pretty much all they do. Thought experiments are rarely used to make discoveries. And if you are thinking about EPR... well, that has actually been done in real life. And it had exactly the result predicted by Einstein, Podolsky and Rosen because they understood QM quite well. They just didn't like the fact that it would predict a macroscopic result that was different from a naive definition of causality and locality. Well, QM won and that's that.
"The theoretical end point for the American Dream is we all live in mansions with massive amounts of physical goods."
And the reality are often enough trailer parks and copy-cut-paste suburbs. Big deal. Give me a nice flat in Singapore over a trailer park in the US anytime. At least I can take the bus everywhere and busses are on time.
You want irony? How about this: the inhabitants of the richest nation on Earth are squandering away most of their wealth on senseless wars, the ritualistic burning of gasoline in oversized ICEs surrounded by cheap and ugly sheet metal and endless amounts of plastic toys produced in China while sending their kids to some of the worst schools in the world and not giving one third of their population basic health insurance.
Now that is ironic.
Just to wrap up a bit. And yes I am being both sarcastic/ironic and real at the same time sorry you can't do real physics on a blog.
First to do anything really new in physics requires at least 10 years of serious thought unless you are a super brilliant genius. I'm not a super brilliant genius. To get the time to ponder a hard problem in today's academic atmosphere is impossible unless your a golden child.
Some of the thoughts I expressed may be valid I don't know and probably never will since I won't get a chance to pursue them. They are not actually bad ideas since searching for papers lead quickly to published works that have the same basic idea I'm trying to express. So at least they can't be discounted immediately. That's not saying they would make it through a formal analysis. Now if you give me a grant to do the work and then I don't make it in PRL then yes you have the right to question the concept. My experience was that very very few people get a chance to think. It takes me weeks sometime to get my head around some concepts. Sometimes it takes days just to really grok a good paper and work through it. In my opinion physics is hard and making a real solid contribution on top of what we know today is even harder. And worse the chance to even try is harder still.
No one gets a chance to set in a patent office and just think anymore :)
I'll back off on the blog physics stuff sorry. Now if we had Mathematica plugins it would be a different story :)
And yes I'm bitter just because I'm not the fast at physics does not mean I can't do good physics. I think a lot of ex-physics types lurk on this board you all left for your own reasons.
Now with that said the variable dimension idea is not bad though and it looks like people are starting to lean in that direction which heartens me since the little bit of work I did on it showed it had a good chance of simplifying hard problems. I thought it up when doing quantum chaos stuff since by varying the dimension you cause a system to classically oscillate from regular to chaotic. Thus it could be a way to express quantum chaos. Buried in quantum mechanics is the ability to create a regular potential well from one that should exhibit chaos. Thus harmonic oscillator expansions may have a real physical meaning ( This is for real )
Though experiment was a slip ( gedanken ) I meant thought and experiment.
Physics explains the flow of time well given the equations for a system but it can't determine absolute time or better absolute relativistic time but their so no reason to bring in relativity. Maybe I can use this as and example how can you tell how old a hydrogen atom is or and electron ? Or can you prove you can't know. And yes I know we can't by why ?
We have this concept of life and death based on the physical arrangement of certain atoms. This arrangement is even less physical than a atom. For thermo reasons we can reasonably assign the concept of life and death to this group of atoms.
Thermo explains the flow of hard time or more what we consider better normal flow of events in time.
What we naively consider time or the passing of time only exists at the macro scale. We don't have this kind of concept of time in physics. Thus we can't easily say predict when the last grain of sand would fall out of a hour glass.
There is a finite chance it could stick.
Relativity does not change this conceptual time which and yes we you lots of indirect measurements to deduce the current "real" time vs the beginning of the universe but the concept simply disappears in physics. And even our current bet estimate for the real age of the universe could be off by a few billion years and worse we don't really know the error term that well. By time I mean dates from some obvious point related to the beginning of the universe frame of reference is not that important it just adds a relativistic correction factor. At the smallest level of course we can't actually tell time most quantum phenomena are reversible so you can't tell if the experiment is running forward or backward in time. For example a "movie" of photon absorption and emission look the same so the time direction is lost.
Its only at the thermo dynamic level that we can again assert the concept of time if you want substitute the word age for time. The fact that in our physics age time is not well defined result in the inability to determine the age/time of any event with certainty. Another example take engine and fill the gas tank. Tell me exactly when it will run out of gas. Better tell me not only when it will do it but what the error is. The point is that for practically and semi complex system our ability to predict the age/time of events is horrid. ( Mean Time to Failure ) This really bothers me.
I bring this stuff up because we want to know things like peak oil, when will global warming be unstoppable etc etc.
People are asking these questions. But first we won't know these answers until the usefulness is too late. Next our science is not that good at answering these types of questions regardless of how much data you collect or how detailed your analysis see my above examples. Thus more information won't result in a significantly better answer.
I worked for example on asteroid strike probability on the earth. It obvious from the mechanics that Jupiter destabilizes the orbits but on the same hand it impossible to predict when one would strike. Or is it ? Actually the question I asked is can I actually prove its impossible.
I mean even in the peak oil case their exists a reasonable chance of use finding a very large field at one of the poles or possibly somewhere else on earth. We cannot rule out this possibility. Next there is always the chance of some sort of technical breakthrough that would dramatically increase flow or recovery rates. Say something exotic like micro drills or nano tech who knows it could be a simple idea.
So although I know I wandered far off topic the point is we are not good at time/age with better numbers and better calculation we can give a more refined number but on the same hand is it correct to do nothing because the time/age calculation may be imperfect. In the case of peak oil we are not even doing whats needed to refine the calculation ( KSA data transparency ) But again even with better data the exact final answer cannot be predicted.
The underlying reason is Time/age for events is not something our physics can answer very well.
A lot of the underlying dislike and derision of science by normal people can be traced back to this age/time problem.
Acid rain global cooling then warming etc etc. The science was sound its just the scientists did not educate people about the age/time problem and people expect age/time answers. Nuclear energy is another place that the inability to do good age/time calculations caused a lot of problems.
Hopefully I've at least explained the problem this time :)
And it does permeate deeply even into QM.
The classical quantum transition is closely related.
And of course some quantum events are not reversible wave function collapse for example is the obvious one. Thus once you make a measurement the system is altered forever and some age/time info is trivially detected so its not a black and white quantum->classical transition issue.
I think the age/time conundrum is a very valid issue in the context of peak oil. Hopefully I have expressed it well enough to show we need to act even without good time/age data. Now people like CERA for example exploit this age/time weakness for political gain I guess certianly they have and agenda beyond giving real answers basically the whole report is based on distortions that take advantage of age/time issues.
And since people don't understand the age/time problem they can't evaluate the peak oil issue easily.
Sorry for the weird long posts but I think age/time is important and I don't know how to express it.
And yes I agree with the rest the irony of America is beyond measure.
"In my opinion physics is hard and making a real solid contribution on top of what we know today is even harder."
I agree... but only if you limit "real contribution" to things like cosmology and quantum field theory. The real hardship there is not even the theory, as you might think. String theorists are a dime a dozen. It is the scale of experiments it takes to get a hypothesis about the vacuum or the early universe checked. The world can only afford to build one giant accelerator like CERN at a time and we can only fly one microwave background satellite a decade. It takes thousands of people to build these experiments and thousands more to analyze the data. That is what limits progress. It is not the theoretical physicists, for sure. It just happens that you can't guess what nature does... you have to check it with an experiment.
All of Einsteins work was based on existing experimental observations (Lorentz transformations where known since Maxwell published his equations and the perihelion drift of Mercury had been pinned down at least since 1859, fifty some years before the general theory of relativity even began to take shape!) ... people tend to forget that.
"Thus it could be a way to express quantum chaos. Buried in quantum mechanics is the ability to create a regular potential well from one that should exhibit chaos. Thus harmonic oscillator expansions may have a real physical meaning ( This is for real )"
Can you give me an example? I am a physicist... if you write down the Lagrangian or the Hamiltonian or just the potential, I'll get a better feeling for what you have in mind.
"Physics explains the flow of time well given the equations for a system but it can't determine absolute time or better absolute relativistic time but their so no reason to bring in relativity."
What is absolute relativistic time? How do you measure it? How does it change the phase of a QM system? I only know what eigentime is... and your car's GPS uses your car's egentime to calculate the coordinates.
"What we naively consider time or the passing of time only exists at the macro scale. We don't have this kind of concept of time in physics."
Time is a very hard concept in physics and every physicist I know will tell you that time is what can be measured with clocks. Now, we also know that there is a scale on which clocks stop to work. But that does not imply that time is not as well defined as e.g. temperature, pressure etc.. Whenever someone starts to talk about time in this way I have to ask: Are you an experimental physicist? Usually the answer is "No.". Experimentalists seems to understand a lot better than pure theoreticians what physical quantities are. They are not what you denote by "t", "s", "a" or "F" on your sheet of paper. They are what we measure with our instruments. And time is perfectly well defined in reality by any number of systems. Even, no, especially, on the quantum level. Muon decay, anyone?
Something tells me that you don't really understand what relativity does to the definition of time and to its physical consequences. A photon, for instance, has no knowledge of time. To a photon all the universe is like a distance. It measures distances by the number of oscillations of its wave function. But it is everywhere "at the same time" in its own frame of reference. Only massive particles can sense both time and distance.
"Another example take engine and fill the gas tank. Tell me exactly when it will run out of gas. Better tell me not only when it will do it but what the error is. The point is that for practically and semi complex system our ability to predict the age/time of events is horrid. ( Mean Time to Failure ) This really bothers me."
You are alone in that quest. Nobody else is bothered by the fact that they can't tell down to the ns when an engine will stop because the car is out of gas. The only thing that matters is if it will happen before we reach the next gas station. Incidentally, if you Lorentz transform the coordinate system, the physical effect of the car running out of gas before reaching the gas station is an invariant. there can be no coordinate system in which the car reaches the gas station and the engine continues running and onther one in which it does not. We call this an invariant. Only invariants have ultimate physical meaning.
Many people seem to think science is a totally theoretical exercise aiming at predicting everything with infinite precision. That is pure bull. Science is all about winging it well enough to learn something of value.
"I mean even in the peak oil case their exists a reasonable chance of use finding a very large field at one of the poles or possibly somewhere else on earth."
Good luck with that. It seems to me that you are stuck at the stochastic version of Zeno's paradox by thinking that if there is a small but finite chance to find some more oil and there is a smaller but still finite chance to find some more after that, we will always find more. That is not how it works: the total integral of this stochastic process converges quite nicely... the result is simply the geologically available oil. And that is a finite number. The only consequence of your argument is that it tells me how little you know about calculus and limits of functions.
"A lot of the underlying dislike and derision of science by normal people can be traced back to this age/time problem."
Most people have no understanding of physics in the first place. They simply can't fathom the thought that something that was available for all of their life and their parent's life and their grandparent's life is suddenly going to be less available to their children. Physics has nothing to do with this. It it simply called "limited imagination paired with ignorance".
"Hopefully I've at least explained the problem this time :)"
No. You have made it harder for me to understand what the hell you are talking about. Anything you said so far evaluates either to "nonsense" or "false" in my frame of reference. Since I am earning my money by using my physics and engineering knowledge, I have a rather well established proof that my frame of reference is the correct one: my paycheck.
I am not sure it will help if you tried to explain your mindset again. I think that much of your thinking about science is based on a rather weird imagination that has little to do with reality.
"And of course some quantum events are not reversible wave function collapse for example is the obvious one."
There is nothing like that in quantum mechanics. What you call the non-reversible collapse of the wave function is a purely mathematical construct that has no physical reality. The great mistery of QM interpretation, if you will, is why this hypothetical and mathematically quite trivial process results in correct predictions for semi-classical measurement aparatus like photo-multiplier tubes and ionization counters without any further need to analyze the internal mechanisms of these instruments.
"Now people like CERA for example exploit this age/time weakness for political gain..."
I am pretty sure the people at CERA would have a good laugh if you ever presented this explanation to them... they will never have heard about the time measurement problem in physics. They might have taken a class or two in political sciences and campaign management, though...
I think we should take this to email.
mike.emmel@gmail.com
I'll take one more stab.
You can't use physics to predict the time of a persons death.
Now you can use physics and related sciences with a lot of tests to get a rough approximation.
But external events say your hit by a car can intervene at any time. This is what I mean by physics does not do real time. Regardless of how well you measure a system even trivially complex systems result in a wide variance in real time predictions.
A lot of the soft sciences like poli sci etc take advantage of this time error if you dig deep enough. What we call emotional response is in reality based on a simple when type calculation. The simplest is will this effect me now. I could go on but time/age or real time is a big factor in both our mental view of the world and in the world itself.
Our world operates in real time physics does not do real time well.
Finally on the dimensional side just take any potential well that has a chaotic classical signature. Do the semi-classical anaylsis and match up the potential that would replicate the wave function.
Thus for some reason the quantum wave function is able to treat a potential that we think is complex as simple.
The quantum probability concentrates along the regular regions.
In a sense quantum seems to add a symmetrical force to a asymmetrical system. The viewpoint I proposed is that the dimensionality of the system is not a constant so the quantum system has additional coupling with its potential.
Sort of like a geometric normalization force.
Short version assume that a asymmetric potential well vibrates in dimensionality allowing it to spend some finite amount of time looking regular. This regular time slice has and additional coupling factor.
Thus QM has a inherent additional geometric force that prefers regular potentials.
Maybe a simple experiment would be to take a really good mirror and add a defect the effect of the defect on the light would be less than what one would predict.
So if your bouncing photons off the mirror you would see less scattering because of the defect then what would be predicted. Or you could do a double slit or single slit experiment with defects and show that the defect is not causing as much change as predicted. Two defects could be used to get a differential.
Dug a bit for experiments.
This actually shows the reverse of what I'm saying but my point is the original low temperature measurements are "too good".
http://prola.aps.org/abstract/PRB/v33/i2/p1350_1
http://prola.aps.org/abstract/PRA/v38/i7/p3702_1
http://www.sciencedirect.com/science?_ob=ArticleURL&_udi=B6W7T-4HVW8BY-D&_coverDate=06%2F30% 2F2006&_alid=509253567&_rdoc=1&_fmt=&_orig=search&_qd=1&_cdi=6635&_sort= d&view=c&_acct=C000050221&_version=1&_urlVersion=0&_userid=10&md5=c23c8fbce8 0c2e5a0c161a92aeae48e3
http://www.iop.org/EJ/article/0953-4075/30/10/006/jb30010l6.html
http://earthweb.ess.washington.edu/lnk/brian/baconjaslong2000.pdf
In any case if you review you might see pattern of scattering being less than predicted or getting larger than predicted with a change in the system.
Its quite common from what I can see for defects to have a lower or smaller effect then predicted.
I attribute this to the above geometric coupling.
QM does not like bumps.
Standard QM does not defy common sense at all... once you broaden your mind a bit. What it does defy is a naive interpretation of the world based on macroscopic observations alone. But even that is not quite correct. Men has been seeing quantum effects for as long as we exist... we just couldn't make sense of them as quantum effects, that's all. So unless we have a strong urge to define ourselves by what we didn't know for most of our race's existence instead of what we really are, none of this presents much of a problem.
The wave/particle properties of electrons exist independent of observation. The univers does not care much about anyone looking at it. That it does is just another anthropocentric misconception of the 19th century. Time to get rid of it. That is not to say the electrons ever noticed our somewhat arbitrary disctinction of their real properties into classes of semi-classical experiments.
Except that our observation has resulted in creation of things like atomic bombs and eventually this could lead to weapons that could destroy star systems on up. My point is that the more we learn the more power we have to destroy and create.
And maybe someday we can influence the nature of the very universe itself so you can't assume intelligence exists outside of the universe that created it. Although I'd much rather be a tree the universe decided for some reason to not allow me that luxury probably because universes that develop truly intelligent life can somehow survive better than those that dont.
Our current crazy wasteful oil based society is the result of mankind as a whole rejecting our collective intelligence and its impact on the world. For some reason a lot of us are cursed with being spectators too this unfolding insanity.
Why are we cursed being spectators? Oil waste starts at home. Nothing stops you from remodelling your home and becomming a carbon-neutral citizen. Nobody stops you from teaching your neighbour how to conserve and improve quality of life. Waste is a choice, not a civic duty.
I mean someone like Bill Gates could readily fund some really good work on renewable energy and of course the government could support it.
I am doing my part to some extent.
First I rent ( OC housing is insane )
But we never use our heater and barely our AC.
I work at home mainly so no driving. I do have to fly some not much I can do about that.
Next I am working on a project to introduce solar powered efficient computers/communications systems. Sustainable computing is the motto. My part is developing a software stack that can run well on low power machines but is extensible.
I am also talking with Spanish government officials on a solar cell plant in Spain to support the computers with home grown solar cells. This gets around supply issues and also wind power for server farms.
So I think for my area of expertise I contribute as much as I can.
I can say that at least in Spain they are very peak oil aware. The US is a hard sell they think the Oil Sands and Shale oil and coal will save our butts. The only good thing is most people see that corn ethanol is not a good idea.
They intuitively don't like the idea of burning food.
Sure you are. And by "you" I mean EVERYONE, because memmel is doing plenty already. Bravo!
How long the oil on this planet last solely depends on you and me and our neighbours and the people on the street. If WE keep driving oversized engines, oil will run out sooner. If WE buy smaller cars and less junk from Walmart, it will last a little longer. Not much longer, bit a little longer.
What exactly do we expect the politicians to do for us? The only thing they can do is to raise gas taxes to force us to conserve. They can not magically make the problem go away. They can, at best, force us to buy a Prius or a Yaris instead of a Denali. But wait... WE are a grown-up people! WE can make that choice ourselves!
"I mean someone like Bill Gates could readily fund some really good work on renewable energy and of course the government could support it."
Bill Gates is already trying to get rid of Malaria in the developing world. Leave the man alone. He is doing enough. I don't like Bill Gates, by the way... but he is not the savior of the world and we should not expect our billionaires to bail US out.
I think the message that needs to gou out is that everyone is responsible. And thus everyone can either wait until they get their tushies whipped with a hefty tax and regulations OR they can start acting now.
Interestingly enough... many industry leaders have seen the writing on the wall. They know it is cheaper to prepare now than to fall back on some emergency mode when the crisis hits. Some will be prepared really well... others will go out of business. Let us celebrate the "Economic Darwin Awards". Ford and GM seem to be volunteering for the first price...
I don't think that is correct; we simply don't have a way of observing an electron without touching it with something. The physical intermediary act of the observation causes the changes in the electron, not the consciousness behind it.
I refer to the famous double slit experiment.
The propery displayed is observable but changes when sensors are used instead of direct observation.
From particle to wave or vice versa.
I didn't mean to get this thread offtrack. QM is of two flavors. Standard(Shrodinger,et. al.) and Classic. Classic denies the statistical probabilities theory.
This is without going into a big dissertation.
Myself I prefer Susskind's Anthropic principle for an understandable basis that can be meditated upon meaningfully.
I will leave my part at that. QM can be debated endlessly and no conclusions reached.
airdale
"The detection of a photon involves a physical interaction between the photon and the detector of the sort that physically changes the detector. (If nothing changed in the detector, it would not detect anything.)"
So detecting an electron means meddling with an electron. As a result, we're not talking about two slits anymore, which changes the experiment etc. etc.
Seriously, if consciousness was an issue, where would the limit lie? Monkeys? Parrots? Horses? Foetuses? Comatose persons? Anyone with an IQ below 76,897?
But it is indeed off-topic, and we shall leave this fascinating subject at that.
There are not multiple flavors of QM. QM is one theory. Schroedinger QM is just one application of it to single particle or finite number particle systems. Actually... non-relativistic QM is really a highly degenerated version of the real thing: quantum field theory.
"Classic denies the statistical probabilities theory."
QM is not a stochastic theory. It is simply a theory in which there is a built in barrier to knowing incomensurate properties of systems at the same time. That is not the same thing as stochastics by a longshot.
"Myself I prefer Susskind's Anthropic principle for an understandable basis that can be meditated upon meaningfully."
We have religious freedom in the US... you can believe whatever you like. That does not make it true.
That, actually, is not true. There are plenty of quantum mechanical systems which stay in unstable states for any period of time because there are no allowed transitions into the stable state (think excited nuclear and atomic states). It is just a matter of symmetry.
"The underlying reason is in quantum mechanics the system actually knows where the next stable state is, classical mechanics does not allow the system to probe its potential well."
Neither is this a true statement. In both QM and classical mechanics there are no transitions possible unless you open the system to an external temperature bath. That simply follows from the energy conservation law. An excited QM system like an atom will stay indefinitely in its excited state (or some mixed state) if it can not get rid of the energy. Put an atom into a perfectly reflecting box and it will stop decaying electromagnetically into its ground state.
The equivalent of the thermal bath in QM is the vacuum with its em etc. fields. In classical mechanics the coupling to the thermal bath will automatically lead to fluctuations of the system around its average energy and for most excited systems define a decay time scale depending on the depth of the energy minimum they are in.
This is not true.
The Quantum system will oscillate in fact this is the base for a laser cavity. Even a single atom would couple to the cavity. You can't decouple from the cavity even if its perfectly reflecting since by definition excludes certain wavelengths if its finite. Your argument would require a infinitely large reflecting cavity. A bit of a oxymoron.
http://prola.aps.org/abstract/PRL/v79/i25/p4974_1
Even your thermal bath is not true their exist a finite chance for pair creation resulting in a real particle. This is the information leakage problem with black holes. The existence of any gradient even in a vacuum results in the non zero chance for a virtual pair to result in real particles.
Thus if you left perfectly empty space alone long enough it would eventually create particles causing a gradient causing a black hole that would increase particle creation at its event horizon ...
I had one of these that exhibited chaotic behavior pretty cool.
In general I think the quality of the data is so bad that simple models are all that's required. Their is no reason to over-model based on bad inputs. We are probably off +/- 1 mbpd. Now a nice paper on the error term would be really cool.
Price fluctuation with spikes at peak are well documented and we don't need a complex model. The reason for the spikes is based on chaos (stochastic resonance) but that's more interesting than useful. What important is to recongize that price swings with peaks is a signature of peak oil visual inspection of the raw data is sufficient.
Of course a perfect cavity will change the energy levels of the atom you put in it. But it will also not let the atom decay because the energy can not leave. This can also be observed in nuclear physics where the free neutron decays but as soon as it is inside a nucleus becomes perfectly stable. These experiments have all been done... nothing amazing there.
"Even your thermal bath is not true their exist a finite chance for pair creation resulting in a real particle."
I don't think I made an argument to the contrary. Actually... every state of the vacuum is excited at T>0 and if the boundary conditions don't prevent it, i.e. the total energy in the volume is greater than the excitation energy of the free state. This is rather trivial. The result is that any decaying quantum state you put into a finite volume will inevitable stay excited... it has nowhere to go. You might just not see it when you open the cavity to take a peek... but that is a different matter. And make sure you understand the difference between opening the cavity adiabatically vs. instantaneously!
"Thus if you left perfectly empty space alone long enough"
What is a perfectly empty space and where can I borrow or buy one to do that experiment?
"What you are seeing is simply a re-distribution of energy. The same gallon of fuel sold in the developed world or China produces much more global GDP than if it is used in the developing word. In other words: for the greater common good you want to take ALL oil from the poorest and give it to the most productive (not the richest). Some of that is happening now. The poorest are not amused. Neither are the richest."
er..No.
In terms of dollars of GDP per million BTu of energy consumed (all sources) Bangladesh and the Philipines are way ahead of the pack. The USA and Canada are amongst the most energy innefficient nations.
http://en.wikipedia.org/wiki/Energy_intensity
particularly worthwhile to scroll down and blow up the graph bottom right.
Thanks for the update.
Could you clarify one minor point? You say in the text:
In the November update you had 2006-08 as the AL peak with 85.1 mbd. Now however Table 1 shows AL peak in 2005-05 at 85.21 mbd.
Is the correct figure now 85.21 in 2006-05?
Nov Dec
01/2005 83,911 83,864
02/2005 84,209 84,209
03/2005 84,373 84,366
04/2005 84,684 84,790
05/2005 84,804 85,205
06/2005 84,705 84,799
07/2005 84,383 84,405
08/2005 84,376 84,740
09/2005 83,900 84,016
10/2005 84,006 84,013
11/2005 84,787 84,805
12/2005 84,787 84,610
01/2006 84,411 84,486
02/2006 84,263 84,316
03/2006 84,253 84,288
04/2006 83,879 83,860
05/2006 83,969 84,104
06/2006 83,802 84,090
07/2006 84,075 84,112
08/2006 85,067 85,184
09/2006 85,096 85,107
02/2005 84,642
In table I "all liquids" does peak-date has to read 2006-05?
on another note:
http://www.globalpublicmedia.com/lectures/461
I just made the mistake to listen to Bartlett's speech and although I use interest calculations, I never used it myself to test some of the data offered here (a site and an idea I stumbled on nearly innocent while researching my energy investment ideas). This speech made me just check on the world coal supply and usage
http://www.worldcoal.org/pages/content/index.asp?PageID=188
using the 1995-2005 yearly increase of a bit more than 3.1%
it takes less than 60 years (2066) to finish all the nearly 1.000.000 million tons of proved coal reserves.
But using the 7.4% 2004 to 2005 increase as constant usage growth rate (probably too low if oil should peak) it takes about 37 years, i.e. in 2044 it's all gone, too.
Can someone tell me I am totally wrong, please !
Michael
In other words: we shall never run out of coal unless we decide to live in glass domed cities with atmospheric CO2 scrubbers.
In other words: we shall never run out of CARBON unless we decide to live in glass domed cities with atmospheric CO2 scrubbers.
You forgot methane hydrates and peat bogs burn those also.
Its amazing that life allows reduced carbon and oxygen to exist on the same planet.
Now its my understanding that these reserves are eventually converted when volcanic or tectonic process bury the carbon and its eventually converted to C02 over time. But bugs play a big role in this also.
I actually have found very little information on the natural recycling of coal/hydrocarbon resources in the environment.
Maybe someone could provide a link. Obviously in some cases they have lasted a significant fraction of the planets life.
I wonder if their is a long natural cycle of C02 accumulation and sequestration. Also I think for the earth its basically impossible to remove the effects of life on the process.
Way way off topic but interesting. I think that the oil age will be detectable for a very long time. 50 million years or more. In fact traces our mines and oil wells could potentially last for longer. Along with various space junk.
Thus if its any consolation their is a very good chance that other intelligent life will be able to detect we existed for a long after we are gone.
So we are like cat urine for a planet.
Maybe the next sentient beings will reflect that it was because of what we are doing now that cleared the way for them to appear on the stage, in which case they might be reasonably sumpathetic. For example, do you resent the meteor that wiped out the dinosaurs?
:-)
Of course I don't expect efficiency development standstill, it is just interesting to compare the usual infos like "155 years of coal left" (is correct at fixed 1995 usage) with usage increase realities.
Your figures look pretty good. Of course, coal production will follow a Hubbert curve, so the production profile will be different, but the bottom line is that there is no cornucopia of coal.
I have made the point before that Peak Coal is not far off, closer if we increase the rate of use, which appears to be the case. For some reason people don't want to believe the numbers. Coal is an undesirable solution from the GW point of view, and is also a short term fix at best. We just have to get away from FF, the sooner the better.
China to invest 1 trillion yuan to develop oil alternative
china proved reserves 114,500 mt
annual consumption 2005 ca. 2,100 mt
yearly usage increase 6%
(see http://english.peopledaily.com.cn/200504/07/eng20050407_179922.html)
years left of chinese coal: 24 (2029)
Sorry ;) I somehow have to laugh...
Sorry, that's all the info I have.
I thought I would share this link with you. I am not going to be around when the blog opens up as I'm moving. Maybe you can repost it for me =)
Interesting Article! Car Sharing picks up speed
-C.
Yeah, get it on!!!
Re: in the end all reliable predictors have to converge on the same estimate within the errors of the underlying data set.
The problem is that each forecast is based on a different set of assumptions (the main assumption being the existence of a peak itself). The most consistent forecasts are in the "Business as usual" category because they are based on a growth model that has only one parameter (the growth rate) that has a historically tight range of values (1.5-2.5%). I'm afraid that we won't be able to confirm any geology-based decline only long after the peak has occured. What we are missing is a true peak oil indicator that would be based on a set of observables (supply, demand, price, inventories, etc.).
I was hoping there would be at least a couple of geologic models working of similar enough assumptions and data that comparison was possible (apples and apples only). I don't really care much about the economic growth models for purposes of understanding. We know that they are deeply flawed by design. But maybe there are a few fits that actually show some trend? Just curious, as always. I guess we will have post-peak data soon enough for everyones taste.
Thanks again and I am sure you will let us know when you find something interesting!
Whats wrong with my asphalt suggestion as a indicator ?
Except for the ones that rely mainly on past discovery data. The peak in this case is implied only insofar as that another discovery peak will never happen.
I had a post awhile ago on the concept of "reserve peak". No one seems to talk about this but it definitely comes out of the math. For example:
Reserve = Cumulative(Discoveries) - Cumulative(Production)
This definitely shows a peak whenever:
dReserve/dt = Discoveries - Production = 0
http://mobjectivist.blogspot.com/2006/04/reserve-peak-proven.html
What may prove interesting is to show that even for the most optimistic predictions, that we have seen reserve peak come and go. The only phenomena that could remotely affect the profile is a large reserve growth feeding the discoveries. But then you would have a targeted reserve growth rate necessary to keep the reserve peak forever in the future.
He claims to have some sort of proprietary database, but we can't see it.
Mind you, I've double checked his claims against several publicly available data bases and they are far far smaller than what he claims. And most of those reserve growth numbers come from the inclusions of Tar sands in Canada and Venezuela, and the magical ME growth in the 80's.
Besides reserve growth means nothing. Its production that counts.
He's full of crap unfortunately.
Have you try to generalize your equation with:
Reserve = Cumulative(Discoveries) + Cumulative(Reserve Growth) - Cumulative(Production)
then:
dReserve/dt = Discoveries(t) + ReserveGrowth(t) - Production(t) = 0
it's generally accepted that reserve growth for a particular field stops when the field has been exploited for more than 20 years.
Looking at the data of Attanasi and Root for the USA, most of the reserve growth occurs in the first 5 years.
http://mobjectivist.blogspot.com/2006/01/reserve-growth-overrated.html
When one averages the URR estimates and then deducts the past, u are left with a graph of the real mccoy. the one that matters.
Most study of this exact concept is done by Jean Laherrere. His premise is that most 'remaining reserves" or URR studies are faulty 'cuz they don't correctly backdate reserve growth to the original discoveries. This gives the impression, he postulates, that the every upward growing graph shows ever more oil. In his backdating work, the graph of "remaining reserves" peaked several years ago and we are currently on the downslope. I say "correctly" 'cuz they do backdate. The reserve stats that we see today for the 50's thru 70's are double or triple the original entries. Nobody knew back then how large the ME holdings were.
My compilation does not show the same trend as Jean. I have the remaining reserves rising to 1973; falling to 1983; then rising dramaticaly to today. I cannot recall if Jean included non-conventional in his work. That could explain the variance. Today he uses two assumed URR's for his modeling (3Tb & 4Tb).
You are right about a targeted reserve rate to keep the slope level. It is 31-Gb/yr ... the rate of consumption ... and it grows every year. Total URR has grown an AVG of 60Gb/yr (3.2%) since 1957 & 223-Gb/yr (4.7%) since Y2K.
For instance, you can include tar sands, shale oil, CTL, etc. giving you huge URR values but those are slow sources of fuels.
The most interesting points I got from this latest issue:
. From Fig.2 we get that CO is loosing share in the All Liquids bunch. This means that the All Liquids EROEI is going down. It's something very hard to assess, but it would be interesting if we could know if the net EROEI is going down also, say: net EROEI in 2004 > net EROEI in 2006.
. We have an all bunch of curves but from Fig. 6 we see that the general forecasted trend is of slowing growth. By 2013 only CERA's forecast remain above the water, and still by very little.
I agree I think that once EROI effects are included we are probably slightly post peak now.
Also consider whats in store for us in the next 5 years.
The question is can increasing EROI steepen the real effects of post peak declines.
1.) Increased cost of extraction.
2.) Old infrastructure
3.) Natural Gas pricing and availability
4.) Major increases in political instability esp in the ME.
5.) Almost certain chance of a major hurricane effecting production over say a 3 year period.
6.) Insufficient resources to effectively increase conservation especially in eastern Europe. You can consider negative conservation effects as increased EROI.
7.) And last but not least the increasing sour/heavy percentage of total oil stocks which probably causes the larges increase in EROI and a real decrease in final product. Note that this coupled with NG issues point to a potential crisis in production at some point in the near future.
If you consider all of these today we are probably effectively slightly post peak already for EROI. Thus the inability of the world to grow its production at a reasonable rate and maintain EROI is sufficient to induce post peak effects.
Next I see a good chance for a combination of these factors and above ground factors will result in a serious energy crisis to occur sometime between late 2007 and 2011 at the latest.
looking back over the various posts the last few monthly reviews have gradually been adding more curves. Does anyone have a longer term database of forward projections, say for the eia, and could how the future predictions (eg: peak and date) have changed in the absence of any major disruptions.
The idea being that the model which changes its prediction the least is most likely to be right (if i can find time i'll be trying my hand at curve fitting, and seeing how various fits work.
Andrew
--
The early bird gets the worm, but the second mouse gets the cheese
"The All liquids peak is now May 2005 at 85.205 mbpd,"
That being so then in about 5 months if we continue the decline then it will have been in our rearview mirror for exactly TWO YEARS. May 2005 to May 2007.
I ask then, how long will suffice before it can be stated that we are really past PO for sure? Three years? Four?
I understand that its now being called a plateau. When does it become such that the HL formulas says its actual and not just some slight variations?
Plus increasing yoy real inflation adjusted floor price. A decline with decreasing price actually indicates we are not at peak.
Demand destruction is fascinating with a futures market. Naively we assume it causes prices to lower but I think it actually just increases price instability. Demand destruction initially leads to two things first lower price but also to resources being allocated to the higher bidder. This aspect is not normally taken into account. Thus the winner in a demand destruction scenario gets more product for a lower price as the looser is knocked out of the game for a finite amount of time.
For example take a tanker on the high seas open to go to Africa or to the USA. The USA "wins" the price war sending not only that ship to the US but additional tankers at lowering the prices. The reason is that the bidding is not just on the current tanker but also future shipments. Price lowers more future contracts are not bought and the loser can now play again getting a few shipments until knocked out again.
If you look at it this way it makes since for nominally lower prices to exist for a bit after price hikes since the loser cannot compete for a finite amount of time after a demand destruction style bidding war if your allowed to buy future shipments.
So if you cycle through a demand destruction scenario you see that overall the winner on average pays far less than the initial price spike to ensure demand destruction.
So overall demand destruction simply leads to spikes and ever higher valleys as depletion forces another bidding war.
Note it takes several rounds before the demand destruction is permanent.
I think this is exactly what we are seeing.
How about we say
"waste destruction"
and
"conservation incentivation"?
These are both way more true to the problem and they also suggest that what is happening is not really a bad thing.
When Muffy can't drive her Hummer to the hair salon, it is a good thing.
And true... keeping the African family from buying kerosene is a crime... and it does nothing to solve the problem. Each and every Hummer on our roads is the equivalent of a dozen families living in misery in the developing world.
In reality Muffy will continue to drive her Hummer and that family will suffer. It happens everyday now, what makes you think that'll change after peak?
What an idiotic thing to say. Use your brain, that "waste" being destroyed is what's keeping that african family alive.
Muffy, I am afraid, is a hopeless case. But there are enough people out there who are not. And the question is how to reach them.
But we are not really on the same page.
Ha!
Good luck with that. Humans (like any other animal) have evolved in such a manner to us all available resources. Its natural. If my tribe didn't use the maximum of resources available the other tribe would have and my tribe would be history.
You will never ever teach people not to consume the maximum. Sure some individuals will, but never humankind as a whole. There are far too many Muffys out there and not near enough InfinitePossibilities to make a difference.
Sorry
"You will never ever teach people not to consume the maximum."
I don't think that is really a problem for most. One third of the US population lacks basic health insurance. Like I said... quality of life is first and foremost not a matter of how many boxes you get to unpack for Christmas. We just tend to forget that beyond the usual Christmas present avalanche is a core of unsolved social and economic problems.
Some primitive socieites developed social norms that mitigated over use of local resources. Australian aboriginies, for instance, had as relatively 'sustainable' society for some 40,000 years.
True, most of these societies were wiped out by more advanced, i.e. productive, Europeans, but they indicate that, in isolation, appropriate social norms can create the underpinning needed for the development of something that looks like a permaculture.
The question is whether a technologically-advanced sustainable society is possible, not whether any society is sustainable. Clearly, before the Europeans came, Australia had a 'no'-tech sustainable society.
If I recall correctly the Australian aborigines were pretty much protected by geography. The more advanced farmer societies that swept though SE Asia displacing the hunter gathers couldn't get a toe hold in Autralia. Their agriculture didn't work in that enviroment.
Basically the aborigines survived because they were the most efficient consumers in that environment. They used more resources better. Hunting and gathering let them consume more than farming ill-suited crops. It wasn't until the Europeans came in later was another group able to out consume the aborigines in that environment.
Now you said their lifestyle was sustainable. I think describing it as at equilibrium is more accurate. After all don't all societies reach equilibrium at some point? Didn't the Easter Islanders after their crash? Won't we after our crash?
Are you sure that the aborigines never overproduced their lands/food sources and suffered a die off? Off course they did.
If aborigine tribe A left some food source for future use. What is to stop aborigine tribe B to come in and use it? Wouldn't tribe B have at least a temporary advantage over tribe A? Tribe B would prosper at Tribe A's expense. When the next drought or the next inter tribal war came along which tribe was in a better position? The tribe using the most resources.
Its not just humans but all animals follow this pattern. If two groups are competing for the same recourse, the group that utilizes it more wins.
I don't think its fair to say the aborigines had no technology. They did. It was the technology best suited for that environment ie technology that allowed them to consume the most (or at least more than the invading farmers).
You make a good point about isolation and equilibrium, and your point about societal adapation to existing conditions is what I was getting at. But the difference, I think, is in perspective. Local tribes may have overproduced and died off, but Aboriginal society as a whole, i.e. at the Macro, 'whole Australia' level was seemingly at a sustainable equilibrium - i.e. it could have concievably kept going on as it was for another 40,000 years.
You mention Easter Island, but there is another island (I forgot the name) that had developed strict population control norms that kept the island at a very stable population level. You could argue the 'earth is holy' norm that some Native American tribes developed are a societal reaction to resource constraints - i.e. Take/Hunt only what you need because taking/hunting more will result in a tragedy of the commons type outcome.
It would be interesting to correlate these type of cultural norms against resource contraints. I would think that would be strong evidence for the Marxist argument that the 'means and forces of production' shape everyting else in society.
Meanwhile, most at tod think the world has too many people. The only way for this to be corrected in the near term is for some of them to leave, whether through disease, wars, starvation or whatever. Most that leave earlier than expected will be miserable on the way out.
Sure, when gas hit $3.50 dollars a gallon Muffy cut back on her driving. But she still drove the maximum her budget allowed.
The same will happen at $5.00 a gallon and at $10 and $25 etc etc. Muffy will conserve, but she'll always drive the maximum she can.
IP envisions Muffy driving less than she can afford. He plans to do this by raising taxes on gas to force her to conserve. But Muffy isn't stupid. She'll vote for the politician that'll lower gas taxes so she can afford to drive more.
And that doesn't even begin to touch on the growth in India and China. How are you going to force them to not consume the maximum.
I can see that happening in the US, too. Mostly with hardware imported from Europe and Japan, though...
Yes Muffy won't change. Its unrealistic to expect Americans to raise gas taxes on themselves.
But Muffy's kids? Even if that is possible (and I doubt it) do we really have time to wait an entire generation before we start mitigating PO?
I think everybody would be much better served if we concentrate on plausible senarios. Sure we could mitigate PO with outragous gas taxes, but it just aint gonna happen.
When you keep insisting that all we have to do, its offputting. Please don't downplay the magnitude of the problem. Its counter productive.
It is also the basis of Campbell/ASPO's Uppsala Protocol. A measure to make certain that rich nations do not out bid the third world in a post peak environment.
But energy is less than 4% as a component of CPI in most g-20 nations. Thus, no matter how much they rise, they cannot bring about Recessions. There are many graphs at TOD and elsewhere that imply rising crude brought about the last dozen Recesssions. In actuality, this is an illstration of a correlation ... not causation. As mentioned last year, the usa would need twenty four months of plus $70/barrel oil acquisition cost to bring about a Recession from 3.5% norms in Real GDP. It is one of many forings, but rising interest rates is the biggie in deterring consumer spending.
Seriously... there is no absolute measure to gauge that. Many, many years from now when the width of the peak and the statistical fluctuations can be evaluated, we will be able to give a reasonably well defined statistical measure for a confidence interval. Right now... we probably can't. Maybe someone with real statistics experience could figure out what the probability distribution looks like if we assume a really good fit to the theory.
In the end it does not matter if the peak was two years ago, last week or if it will come two years from now because we have not taken any precautions so far and we will not do so until the truth hits everyone in the face. That might still be a couple years out.
I fear that once we reach that point, we will have far more immediate concerns to keep us occupied.
And how do we make sure that Mom and Dad buy that solar panel? We simply increase the gas tax by a dollar a gallon (raising it by another 10 cents a year for the next 20 years) and buy those panels for them.
The solutions are out there... now all we need are politicians who will implement them.
Well ok then. We will see PO after we are all toast.
Or lets buy mom and pop those solar panels. Why didn't I think of that!!!
And shear half the sheet metal off their vehicles as well.
All these wunnerful ideas to stave off our longing for oil
Who replaces a "FLEET"? Oh the gov? You? Me?
And the name of your planet is?
At first I thought you were kidding when I kept reading your solutions. Then I realized you were serious!
It is always those who pay taxes and generate income who pay the price for anything. That is such a trivial insight that I thought it was known to everyone. Or does anyone here expect the tooth fairy to come by and drop billions of barrels of oil into empty wells? Just wondering based on the general emotional outburst in your comment.
Will you and I have to pay for this? Of course we will. The question is not "if?" but "how?". And that is where politicians play a serious role. They are supposed to show a little bit of foresight and take the sting out of problems, if possible. Just because they don't do their assigned jobs well in the US does not mean that these considerations are not part of their general job descriptions.
As to which planet I live on: Earth, of course. Where do you come from?
Am I serious? Of course, I am. Now, I was a little bit joking about the solar panel part. Solar will only play a long term role. For the first two decades we will mostly get by increasing our efficiency. After that renewables will have kicked in to the extent that they will actually matter.
And yes, again, YOU and I, my friend, will have to pay for all of this. Just like we paid for the nuclear power plants, the hydroelectric plants, the power grid, the sewer systems, the highways and all the other things we use every day. Nobody else did... it was us, our parents and our grandparents. And we and our kids will pay for the next technological changes in our energy infrastructure, too.
Seriously, how hard is that to understand?
How much of our infrastructure is built around our consumption patterns and how much energy will it take to change our infrastructure to a more efficient one??
i.e public transportation vs. cars.
Also what will happen to all the inefficient SUV's. Will they just disappear one day? If people can't trade in their SUV's because no one wants them how will everyone be able to afford them??
Won't there be massive profiteering?? I was at a local Toyota dealership and they wanted $6k over sticker for a Prius!!
Initially we will have to replace the fleet. That will take 15 years from the moment gas prices will rise permanently. It will save 50% of transportation fuels using existing and available technology.
What will happen to all the SUVs? Scrapmetal yard might be the right answer to that one. But that will happen, anyway. How many T4s are still on our streets?
Won't there be massive profiteering? Sure. But don't we have massive profiteering already? Does it really matter to you if the profits go to Mexico, Canada, Saudi Arabia, Venezuela, Iran and the nationals or Toyota and Honda? At least Toyota and Honda are not known to support terrorists.
Prius too expensive? How about buying a Yaris? I heard it is a good car and is not much worse than a Prius. Certainly a lot cheaper.
How did you come up with 50%? Fuel economy is not just about the technology it is also in driving style. Sitting in traffic doesn't help either so your solution isn't as simple as that. Also are you concluding that the amount of cars on the road will not grow during those 15 years as well?
Yes a Yaris is cheaper but as prices increase and people are trying to get out of SUV's do you think that lovely "market adjustment" will start to be applied to smaller cars as well?
In the end it is a decision everyone has to make for themselves. The market will react to the demand and adjust the prices so that demand will not outstrip supply. At what level Americans will truly lay off the SUV needs to be seen. I would guess that many people will go with more efficient and smaller cars between $4 and $5 per gallon. Incidentally... that is where taxation should and could put the gas prices for now. The tax income could be used to help to renew the fleet.
Will there be less cars? A few less, maybe. I don't see half the US population going without a car. There is just no alternativeto driving in the US. But I do see cars being used more efficiently, i.e. less trips to the mall and people sharing rides more often.
People can start riding the bus tomorrow -- without replacing anything. The bus system around here (which is free to ride) is very under-utilized. It would be easier to expand the bus fleet and system than large percentages of the private vehicle fleet.
Perhaps that's why a private equity firm owns MCI motor coach company.
You asked yourself the question "what can we do?"
Maybe you should be asking the question "What will we (probably) do?"
Do you have any idea how unlikely (to put it mildly) your scenario is?
You expect Americans to just raise the gas tax a dollar?!? You think Americans are just going to go out and buy a Prius?!?
That is so optimistic its idiotic. I don't even know where to begin shooting holes in that.
Oh yeah, and good luck convincing China and India that they can't have a decent standard of living. Sorry, look but no touch.
Give me a break. I'm honestly looking for mitigation strategies but your crap just makes me want to laugh.
Not holding my breath.
Another modeler raised forecast peak rate and peak date last week. All 13 of the recognized Outlooks are now at 90-mbd or above. And none of them show a Peak prior to 2010.
Sorry, Peak Oil is off the radar...
P.S. As a side bet, my money is on Baktiari.
As a general rule, I now try to avoid responding to either Freddy or Hothgor (I sometimes wonder if they are one in the same), but if you want a clear signal that we not only at, but almost certainly past the peak of world oil production, I submit the captioned quote by Freddy as proof positive that we are at or past the peak.
<rolls eyes>
And if you know that then you should also now that faking an IP is also one of the easiest things you can do, which makes me question why you would bring it up as "proof" that you are indeed a seperate person.
Did I get that right?
...
...
Meanwhile, looking at traditional hydrocarbons out of the ground, c+c production may in fact have peaked. Note the fall in sa production thru oct, before opec cuts began. 3x more rigs over 24 months, 1.5 rig/month added, production declining 10% this year... I agree with WT that SA is on the way down forever. Imagine what all these other projections would look like if they ever assumed that...
Consider that there is no basis for assuming that sa will ever recover even to 9Mb/d.
For the american-centric who are recently married to the EIA stats (the same EIA that a year ago they said were fabricating figures), they are merely oblivious to the real status. The last pause was Y2k-2002. In that three year period, supply was mired at 77-mbd. Supply is correlated to Real GDP and that period saw the main consumer (USA) in a technical recession. But it was only the USA. And the when tax cuts finally kicked in, the awesome growth on top of all the other economic regions gave us a Global GDP of 4.5%. Unprecendented. And the supply chain was caught sleeping.
Extraction has now attained 86-mbd. But it was clear in the Spring that this rate was not needed. 1.85-mbd of production has been surplus ... and the swing producers naturally cut back. Navel-gazers see the level EIA stats as proof of a Peak. They don't understand why acquisition prices dropped twenty bucks. Instead, they watch "spot" prices. The playground of speculators. They seem unaware that only 1% of product moves thru the WTI/Brent/Dubau futures system. Smoke and mirrors reigns. The same folks that were dazzled by the dotcom stock market fiasco, the gold bug lure ... are again victim to the CNN pundits and WWWeb gloom merchants. If it was on tv or the net, it must be true, eh.
OPEC installed its quota reduction today effective Feb1st. Interest rates continue to rise around the world to dampen overheated economies. Lower energy prices are the gasoline. Two years of global GDP growth is guaranteed by the critical mass in play. Everyone in the sector knows technology and plus $40 prices have inspired a URR spurt of 1000-Gb. The oil is there. The production is in place. All that is missing is the spare capacity that moderates the irritant price swings. And that will be upon us a year from now; when we'll be bouncing the 87-mbd marker post.
Only those selling books or blessed with inflated ego are preaching the doom of Peak arrival. Everyone in the industry laughs at 'em. Even the doubters that have gone out to get there own figures have come back as converts to 2010 upon their due diligence.
Peaksters are a cult. Their forecasts gained notoriety in 1988. It is easy for them to recruit. Many boomers have failed in life as compared to their expectations. They see collapses in oil, the economies, the monetary system & global warming as rationalizations of their own self-perceived failures. It's always the same names and faces moving around town with the little black cloud over them. They are the cancers of our workplaces, our neighbourhoods, our forums ... of our society. This is a psychologicial phenom. Pity them.
Well said. <APPLAUD>
Tax cuts hum? And to what purchasing power cost? And why is the US economy going in to the red right now? You could always cut taxes even more, or even abolish them.
Where in hell is that oil sprouting? I'd like to have a bit for myself, or is it a secret?
Freddy, there's one thing you have to understand, most people witting here at TOD think with their own heads, there is no consensus of Peak being upon us right now (most think that it isn't - that's what the graphs tell you).
We chose to study things by our own means, not for someone else's heads. If we followed the MSM like you say, none of us would be here. That's why we are heretics, and being an heretics doesn't mean we are wrong.
Freddy Hutter says,
"But when u consider that the bottom-up analysts (skrebowski, koppelaar, cera & iea) see 11-mbd in production & refining capacity under way, there is no doubt that the Peak is a long way off. By the average of the 13 Outlooks, it will be 90-mbd in 2020."
Ahhh, Freddy, you underestimate us! We can burn through 90-mbd and still be hungry for twice that much. Because you see, that's the issue....what the helll does it matter....if the petrol industry can provide 90 billion a day, we can burn 105, and if they can deliver 105, we'll blast 120 out the exhaust pipes and smoke stacks...you see, consuming fuel is great because it's like gambling...the only limit is the one the house finally decides to set.
And of course, we need that fuel right? Why should we tolerate a v-8 engine, when a V-12 makes a prettier purr, and of you think that's pure art, why not a V-16....I once even saw a V-24 on the drawing board....imagine that with superchargers! On the lakes, the twin engined supercharged boats are now the standard, why would anyone want to look like a piker with a little boat with one engine? The humiliation would make the fine sport of boating not worth doing!! And now to shop for a truck to tow it with (because you want folks to see in in your drive, and out the interstate, the lake is just too small an audience), the fad now is to do something as close as possible to a "road locomotive" sort of theme, with giant engines (Diesels are fancied here, but not the little wimpy economy things, but giant Cummins with blowers and "kits" to jack the noise and push more air in) and huge double cabs with all the luxuries of home, a rack for a couple of motorcycles to scamper around the campground....I mean consumption is needed to fuel the ole' economy, I'm doing a service to the nation....and pouring that bread out of the country into the hands of those who would gut me and hang me from a fence if they ever got the chance, but hey, that's why I like an army between me and them...
But sometimes, before we go ahead and finish all the light sweet crude and natural gas off, let's stop and smell the roses...or more accurately, take a long loving look at the molecule that is crude oil or natural gas....in on fast whoosh it goes up the exhaust....in a second, the hydrogen is separated, the heat released, and the carbon pushed into the air, gone without thought, a molecule that has proven itself to be one of the most useful in human history, a gem of natural chemistry and earthly existence as fine and elegant as water or natural diamonds. Would we burn diamonds, or make a sport out of trying to destroy them if there was ANY way we could avoid it?
So let not the cloud of concern get to you Freddy, you may be right. We may be able to deliver 90 or 100 or 150 million barrels a day. As we convert more and more of the worlds resources into the tools to extract, and refine, and move, dispose of the filth from a tidal torrent of fossil fuel, we can say, "see, I told you so! We could deliver 120 million barrels a day!! We were RIGHT!"
But of course, it will not be enough, as we race onward, and onward, relentless, now 130, then 140, then 150....no limit, at least not until we turn the world inside out, and leave the people as peasant serfs to the extracting trade in a never ending bid to produce more, and MORE. Steel, ships, pumps, drills, compressors, more steel, pipelines, labor, we will need more labor, and we notice that fewer and fewer can even afford to operate any auto or boat, much less the turbo and supercharged 12 or 16 cylinder suction pumps that suck down one of the most useful and valued minerals for nothing but a thrill....
Now 160 mbd....is there any limit? The little aged baby boomer in his little V-6 air conditioned Buick, idling along to the golf course or the doctors office now will seem like a piker, a peasant compared to the hogs that continue to crave more, and them more again, the young "transformers" of the world, for whom the aged who originally built this system will either step aside or be shoved aside.
The question: Is there a point at which you, Freddy, look back, and ask yourself, was it really necessary? Couldn't we have had smaller, elegant boats and cars and houses, with technology that drew even a small percent from the natural surroundings, and saved a few precious small pools of such a wonderful molecule? Would it have been so bad? Couldn't it have even been fun to have some of the resources go to the people of the world instead of the giant engines of the world? What will we say when our children and grandchildren ask, would it have been that bad?
Will we say I didn't want to be a gloomy type, I wanted to be UP, I wanted to be cheerful, and prove we could produce it, TONS of it, and BURN IT, every bit!! Will we be shaken when the child sees the waste, the stupidity, the arrogant idiocy of such an argument and says, Freddy, you make me sick? The child may say no one could have been that idiotic. No one could have seen reality in that way. But the child, as we know, would be wrong. There actually is a time and place on Earth where the idea of attempting to constrain the waste, to slow the roving multi million unit blast furnace that is the consume for sport trade, to look for elegant and interesting ways to do the same job without the waste of a world, there actually was a time when this was seen as a vice.
Good luck, Freddy, on your quest to 90 million barrels a day....and then 100, 120.....infinity?
As you say, Freddy "This is a psychologicial phenom." But hold your pity in reserve. Whether you prove right or wrong about whether we can make 90 mbd by 2020, (and going the way we are, we will need MUCH more than that, won't we?), we may all need the pity.
Roger Conner known to you as ThatsItImout
I'm seriously worried for some TOD posters as their world unravels...
Assume, plus or minus 500,000 barrels a day for the total. That is about the best you can say about them.
"but for some their gloom and doom might get out of hand and their anger might spill out onto others..."
Boy, there's a threat....those millions upon millions of torch wielding peak believers....:lol, double lol,
man that would be like the mouse that roared, like an attack by the army of Leichenstein...:-)
kiddin' aside, I have often said the only thing that would be more catastrophic than peak is if all that dreamed of oil really is out there....the U.S. is already bleeding to death pouring billions upon billions of dollars, our power and and our dignity into the hands of people who hate us to the core of their being...
Matt Simmons once said like at this way, if I'm wrong, I'm wrong, I've been wrong before, but if I'm right....
And if we pulled in waste consumption and worked on alternatives, what's the worst that could happen? We would accidently keep more money in the U.S. to build schools, museums, and comfortable and humane facilities for old folks....and cut the greenhouse gas a bit...and have some interesting alternative and clean technology.....gee, sad fate that, right?
I can never understand why the oil/gas consumers enjoy being single sourced and single shafted....in every other area of existence, diversity and having options is considered a good thing. No accounting for tastes, I guess....
Roger Conner known to you as ThatsItImout
I think we have hit a logistic peak that will prevent us from reaching the geologic peak but even I don't think we have reached the theoretical geologic peak.
The only geology part of my argument is that the giant fields may deplete faster than we assume leading to a lower geology peak than predicted. But we don't and wont know if this is true for a few years. I'm convinced but I readily admit its debatable. If true then this logistic peak will turn into the geologic peak although it did not start out that way. Its debatable but if the decline rates are as fast as I think they might be we will know in a year if Ghawar has peaked.
Finally I've posted a few times that price fluctuations or chaotic prices with spikes is a fingerprint of peak oil I find it funny that you bring them up.
So considering that I feel I'm one of the biggest peak now people around and even I say its a logistic peak at this time I can't see how you can accuse the group of claiming a geologic peak I don't even claim it.
So agian as far as I know the worst case scenario with any reasonable support is a logistic peak as you claim with a chance that enough of the giant fields are declining fast enough to cause a geologic peak that cannot be overcome by new production comming on stream. And agian if it is happening we will know its possible and its debatable.
The only contentious issue boils down to are the giant fields peaking and if so are their declines rates steep enough to ensure our logistic peak becomes a geologic peak.
Time will tell.
Sorry I know I said the same thing five different ways.
But its important to stress that yes I think most people recognize that we are at a logistic peak or at least we started that way.
Anyone else want to claim they are more of a peak now nut then me speak up :)
Ah yes, that pesky 'spare capacity'. But don't worry folks, we will have jam tomorrow! A whole 1.1% more!
Only... the IEA are predicting demand growth in 2007 of 1.7%. So we are short 500 Kbd. Hmm, so much for spare capacity. Ok, just ignore the price, it is just an irritant.
And 90 Mbd by 2020? That's a tiny 4 Mbd increase over 14 years... not going to be much spare capacity there.
I realise that Freddy is just ranting and facts don't matter, but even his own figures indicate a problem. Do you worry about drowning when the flood water reaches your waist? Or when it reaches your neck? Or are you like Freddy, and wait til it's over your head?
It is non-traditional liquids that pumped storage up so high in 3q... maybe its seasonal nature explains why sotcks are falling even faster, now down to last year's level and 50Mb down from the peak. If true, we will always see a surge in 3q and a drop in 4q, meaning avg production is modest; spread 3q production surge over the year and its not so impressive. Many ethanol plants are under construction, wonder at what point corn prices rise to where it becomes uneconomical in spite of teh subsidy. Always did like corn on the cob...
Actually, spot prices is what OPEC watches and responds to. And, it can't be manipulated for long - shorters must later buy, so overall volatility is high but teh trend is true.
TOday, most new fields, certainly the big off shore as well as the aging giants, are being developed with first rate modern tech; water injection from the beginning, horizontal wells as the rising water gets close to the gas cap. However, this means that there is no secondary, it has already been produced. When the water reaches the gas cap it is time to convert the oil field to a gas field.
IMO we are beginning to see the dominoes fall... the north slope, the north sea, cantarell, burghan, danqing, even mighty ghawar; and, for those major regions for which data is available (eg the first 4, non-opec mentioned), we are seeing rapid declines, some above 15%/a, and which was not predicted by the professionals, eg your fav, IEA. IMO, charters will begin raising their decline rates. Note, for example, that Chris apparently worries that the rate he is using may be too low.
NG shortages might stall both oil sands and ethanol, or maybe not. New production, including non traditional liquids, may manage to maintain the plateau, or even incrase production a bit; does it matter if, by 2010, production manages to avg 87Mb/d? So, some TOD punters would be wrong, and your 2010 ponies would come in. SO what? China wants 20% more/a (clearly deserved because they make the world's goods) and by 2010 this will matter. OIl exporters want at least 6% more/a - clearly not justified because their production is falling - but, can we deny them? We want a paltry 1-2%/a more, clearly justified because we are allowing our population to increase 1%/a thru immigration, legal and not, and meanwhile we don't negotiate. It seems very unlikely the world is going to get what it wants, in which case price will become increasingly irritable.
For most of the world it is price that matters, not peak. FOr me, price has been the main point since I began studying the issue in dec 04. Will price rise or fall? PO'ers and gw'ers want high prices to cut consumption and encourage the move to other sources; long investors simply want high prices to fatten profits. Peak is interesting, of course, not least because of what peak acceptance will do for share values.
Where I differ with you is whether your reserve information can really tell us what levels of production we will see in the future, given the inclusion of tar sands, etc, and the questions of Kuwait, Saudi, etc reverses. I am sincerely curious how you calculate the production you expect based on reserve numbers.
I also don't think I have ever seen you address the depletion/decline question in any serious detail, which is clearly where EIA, CERA, UK, Norway and most of the rest have fallen short.
My personal view is probably more noncommital than you might think. I believe you make good points about the missed peak predictions in the past, and especially in production rates that have in fact been achieved. Your manner can get me at times, but I do pay attention to your contributions. I think, however that the unknowns are greater than you give credit to, and I think the possibility of a peak sooner than you or your modelers suspect is quite likely, and also consistent with past experiences ala Hirsch.
My URR study was initially based on a premise that there was a very high correlation between Known URR & respective production rate. It didn't pan out statistically over my 50 yr time span. Annual Production is presently 1% of URR, but that ratio is not consistent over the time span. This is a mathematical model i played with for a very short moment. The production forecast that u attribute to me is actually a compilation of the recognized Outlooks ... and presently it includes a peak of 95-mbd in 2020.
Most of the Outlooks are bottom-up constructs to 2015. After that it gets fuzzy and is mainly demand driven ... a strong correlation to projected Real GDP Growth. While we became accustomed to projections espousing infinite growth (eg 160-mbd), there was a quiet movement, likely started by Marion Hubbert, that one must reconcile production forecasts and as Colin Campbell calls it privately, Estimated Total Production (ETP), with known the non-consumed component of URR.
Hubbert gave several prediction for the usa & world. His Y2K version is the most noted 'cuz the others were wrong. Campbell & Jean Laherrere hybridized that scenario into conv & all liquids scenarios from the late 80's to the present; always taking care to match ETP with URR constraints.
IEA adopted this premise in 1998 but did not illustrate it or deal with decline. We saw EIA's John Wood present several scenarios in Y2K with peaks of 96-mbd in 2016 & 145-mbd in 2037 with 2% & 10% decline scenarios post peak.
For the most part, we have seen Peak Rate projections in many of the projections but almost none address the plateau or decline phases. The TrendLines Scenarios takes their data on Peak Rate and URR (stated or attributed) and presents the applicable plateau and decline imagery for better understanding by MSM et al.
It has caused heated discussions betw myself and the modelers and pundits. It has opened up a whole new avenue of scrutiny. And hence, we see in only our third year of Scenarios presentations, the models are converging.
My views on post peak decline are plainly stated, Earl. ETP over the 1950-2150 time frame must approximate URR, noting that my baseline is 10-mbd for start & exhaustion tail.
4-6% annual depletion (of reserves) of the largest fields has been acknowledged by all stakeholders. And most others are likely in decline (of production rate) as well. But in graphing post peak decline, one must address future discoveries, enhanced recovery and reserve growth. Koppelaar, CERA & Skrebowski have addressed this well. It gives us a formula for "net decline" post peak that presently increases with time as we assume their will be less discoveries, less reserve growth and diminishing returns in EOR.
From Peak to Exhaustion, i use a net decline rate of 3.06% that is a composite of those in the Outlooks. Last month, even CERA submitted to acknowledging post peak production. Our wide cricism of their bold projections amid their weak URR numbers was no doubt troubling to them. And it was rectified. Similarly, we saw Chris Skrebowski take the baton for the aggressive decline rate camp. He too was stymied when confronted with URR realities. One cannot have 3% to 7% annual net decline and still exhaust URR. One cannot have stranded URR. Oxymoron. Thus in the days before ASPO-5, a compromise Megaprojects scenario was presented with a very long plateau to accomplish much of the exhaustion. Our point has been well taken once again. The Megaprojects Scenario was amended last week and our next Depletion Scenarios version will illustrate it with a conventional decline rate.
The Skrebowski experience is instructive. Many are doubters of the optimistic forecasts we have seen over the years. But when one crunches the numbers wrt field analysis, refinery capacity (Kopplaar) & URR reconiliation ... the pessimists are awakened to shocking realities. That is why i stated in an earlier thread that the Peakists have no credible spokespeople. 'Cuz each person or group that desires to present data that meets peer review scrutiny must eventually admit what they found. That leaves only the blowhards and their anecdotal tales...
TOD has been hijacked by a cancer. Like many forums, most are not held to account for their statements and present them as authoritative w/o having done the due diligence. I like RealClimate 'cuz they frown upon blowharding. Here at TOD, 90% of the daily posting is by those assuming that we are post Peak in spite of the data and recognized students of the sector.
Now we see their redefining of Peak ... to C+C. But as i mentioned, that study is of one of academics; and those that are promoting it are not for the most part in that class. But it suits their negative and gloom beholden agenda. In short, most of 'em are sicko's. There are a few shining lights here at TOD. My comments mean no disrespect those that are truly here for the science.
Regarding declines, I could see a point where C & C declines at a 4-5% or greater rate until you get to an increasing percentage coming from much slower to produce, poorer eroei resources such as tar sands, CTL, biofuels, etc. This could lead to a gradual decline down to a flattening plateau at a lower rate for an extended period of decades or more. This would prevent the "stranded URR" but be consistent with a relatively near (e.g 5 yrs from now) peak. I understand your peak to exhaustion number, but I guess I was more concerned for now with your present to peak (or plateau) time frame given declines working against new production. Peak date will depend on decline rates of major existing fields, which is as yet unknown but we have seen can exceed 10%. Yes, I have read the Skrebowski, Koppellar and other reports as well as Staniford's assessments, and I think they all have merit. I'm not convinced about the merits of CERA, IEA or EIA. Unless I'm wrong, they've missed every local peak to date which doesn't give me confidence in their estimate of ultimate peak.
Khebab's analysis = $0 and open to debate
CERA's analysis = $1,000 and closed to debate
Horay for the open source model and sadness for the coming of TSHTF.
It is hard to put into words the various inadequacies.
It is not math. Math has rules. It doesn't allow humans to choose the answer they like best.
It is smoke and mirrors. It pretends to discover something it already knows(or claims to know).URR.
URR is something we never know, so it is a double-whammy on that last count.
It is circular-logic. Anytime new data is discovered or updated, it simply updates the answer. So it is always right - after the fact. Before the fact it has (an almost) perfect record of being wrong. Hubbert got lucky.
It is a predictor of nothing. Smoke and mirrors. It always keeps itself just slightly ahead of those who can't handle math.
There is no reason imaginable why a production profile curve would be symmetrical on either side of a peak. In fact, there are no examples of this with field and regional data.
Symmetry has everything to do with Linnearization. Symmetry of cumulative productive, not order on the pre-peak side.
Most people probably fail to realize that Peak theory necessitates oil production in the year 2140. Necessitates. And only Crude+Condensate at that. We are not talking about some new "technology." Some new tar sands.
Is that a word? Rafael has been teaching me, but I don't know.
It is math, but falls more into the heuristics category than a physical model.
The URR is a parameter or random variable used to generate the best fit.
The symmetry is due to the fact that every peak reduces to a Taylor's series where the second-order term dominates. This makes the peak an upside-down parabola around a narrow range of values for fitting purposes.
So overall, you have a good point in that HL pretends to be more than just an empirical observation of the current state of things. This would all change if someone came up with a first-principles derivation of the equation from physical parameters. But that will not happen given that it is such a simple equation and we have had years for someone to come up with a good argument.
I know who you are, too. Thanks for the shuck'n'jive. Funny. Is that how you spell it?
We are talking about how serious Hubbert's Theory is. Were we not? "First-principles derivation..." Stop being an asshole. Maybe we can talk. Though I doubt it. You're pretty rooted.
Did Freddy Hutter not read your article? His little "World Oil Supply" graph shows oil production to be at approx 85 mbd, yet it seems he should have labeled his axis as "all liquids".
ThatitImout - great piece [just below FH]. You understand the larger picture.
GilaMonster
Signed,
glad to contribute for the first time to TOD ;).
on the French forum oleocene , I proposed to follow the monthly EIA's Short Term Outook, to see how the could manage a possible plateau in their predictions. The result is interesting : it clearly shows how EIA has gradually changed its supply forecast since 2005, with a slipping inflexion point, continuously postponed for the next few months.
Here are the curves drawn in May 06 : you can clearly see that the predictions have been substantially lowered in August 05 (NB : juste BEFORE Katrina), and then continuously modified.
The current data confirm this trend
I have also drawn an animated gif movie to see the evolution in real time :
(For each displayed month, the thin lines are for past predictions, the thick solid line is the recorded past production, and the dotted line is the prediction).
Although not explicitely recognizing it, EIA numbers clearly show that they have been forced to comply with the plateau. They do not offer of course a clear explanation why their past predictions were so grossly wrong juste one year ago ! (The "growing gap " has reached almost 3 Mbd since this date).
Perhaps repost to today's drumbeat?
It's worth a guest post, if you are interested contact me (Khebab@theoildrum.com).
I believe that the decline in Crude Oil + Condensate is pulling down forecasts for all liquids. Production numbers are revised downward for CO after a few months.
Can you precise what is the difference between the first and second chart.
thanks for your appreciation. I'm not used to post in TOD and because of the jetlag, I have some problems to post early in drumbeats. Of course it's free and I would be glad to let Khebab access all my documents. The first chart was drawn in May and the second one just this month, otherwise it's the same principle, just drawing STO predictions for a few selected monthes. The movie has been done in October, I can reactualize it.
Cheers
Gilles