Peak Oil Update - November 2006: Production Forecasts and EIA Oil Production Numbers
Posted by Sam Foucher on November 20, 2006 - 10:55am
Note, if you are coming in from Wikipedia, the latest updates can be found at this link.
An update on the last production numbers from the EIA along with different oil production forecasts.

Fig 1.- World oil production (EIA Monthly) and various forecasts (2000-2020). Click to Enlarge.
New forecasts added:
- The shock model (Crude oil + NGL, 2004)
- The GBM model (Crude oil + NGL, 2006)
- Deffeyes (Crude oil + condensate, 2004)
- Jean Lahèrrere (All liquids, 2006)
- Forecasts from CERA (All liquids, 2006)
EIA Last Update (August)
Data sources for the production numbers:
- Production data from BP Statistical Review of World Energy 2006 (Crude oil + NGL).
- EIA data (monthly and annual productions up to July 2006) for crude oil and lease condensate (noted CO) on which I added the NGPL production (noted CO+NGL).
The All liquids peak is now August 2006 at 85.10 mbpd, the year to date average values (8 months) are down from 2005 for all the categories. The peak dates are unchanged for Crude Oil + Cond., NGPL and Crude Oil + NGL.
| Category | Aug 2006 | Aug 2005 | 12 MA1 | 2006 (8 Months) | 2005 (8 Months) | Share | Peak Date | Peak Value |
|---|---|---|---|---|---|---|---|---|
| All Liquids | 85.10 | 83.90 | 84.32 | 84.30 | 84.37 | 100.00% | 2006-08 | 85.10 |
| Crude Oil + NGL | 81.55 | 80.60 | 81.16 | 81.20 | 81.25 | 95.83% | 2005-05 | 81.87 |
| Other Liquids | 3.55 | 3.30 | 3.16 | 3.10 | 3.11 | 4.17% | 2006-08 | 3.55 |
| NGPL | 7.88 | 7.36 | 7.69 | 7.78 | 7.76 | 9.26% | 2005-02 | 8.04 |
| Crude Oil + Condensate | 73.67 | 73.24 | 73.47 | 73.42 | 73.50 | 86.58% | 2005-12 | 74.06 |
Table I - Production estimate (in millions of barrels per day (mbpd)) for August 2006 taken from the EIA website (International Petroleum Monthly). 1Moving Average on the last 12 months.
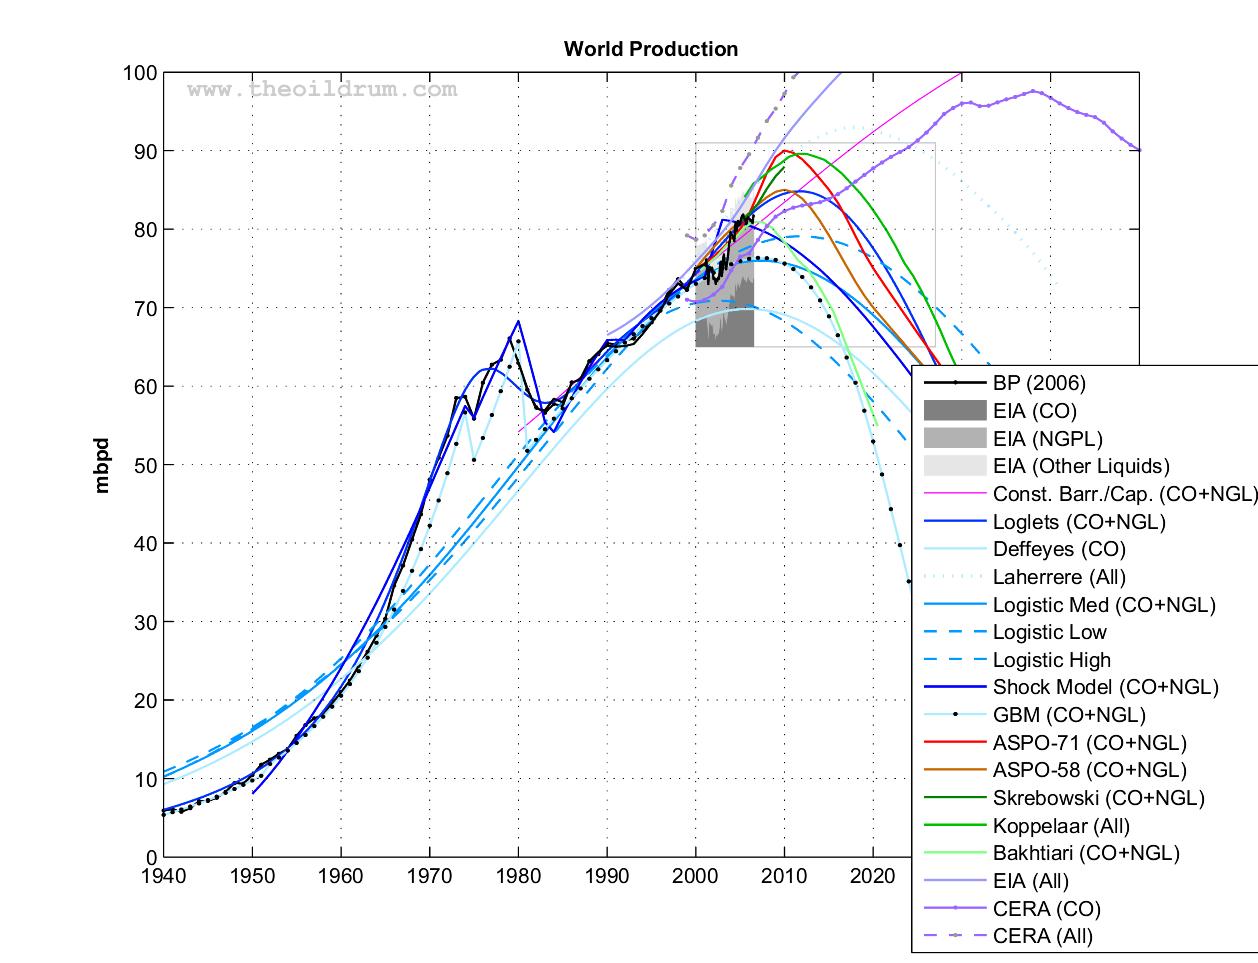
Fig 2.- World oil production (Crude oil + NGL) and various forecasts (1940-2050). The light gray box gives the particular area where the Figures below are zooming in. Click to Enlarge.
Business as Usual
- EIA's International Energy Outlook 2006, reference case (Table E4).
- IEA total liquid demand forecast for 2006 and 2007 (Table1.xls).
- A simple demographic model based on the observation that the oil produced per capita has been roughly constant for the last 26 years around 4.4496 barrels/capita/year (Crude Oil + NGL). The world population forecast employed is the UN 2004 Revision Population Database (medium variant).
- CERA forecasts for conventional oil (Crude Oil + Condensate?) and all liquids, believed to be productive capacities (i.e. actual production + spare capacity). The numbers have been derived from Figure 1 in Dave's response to CERA.
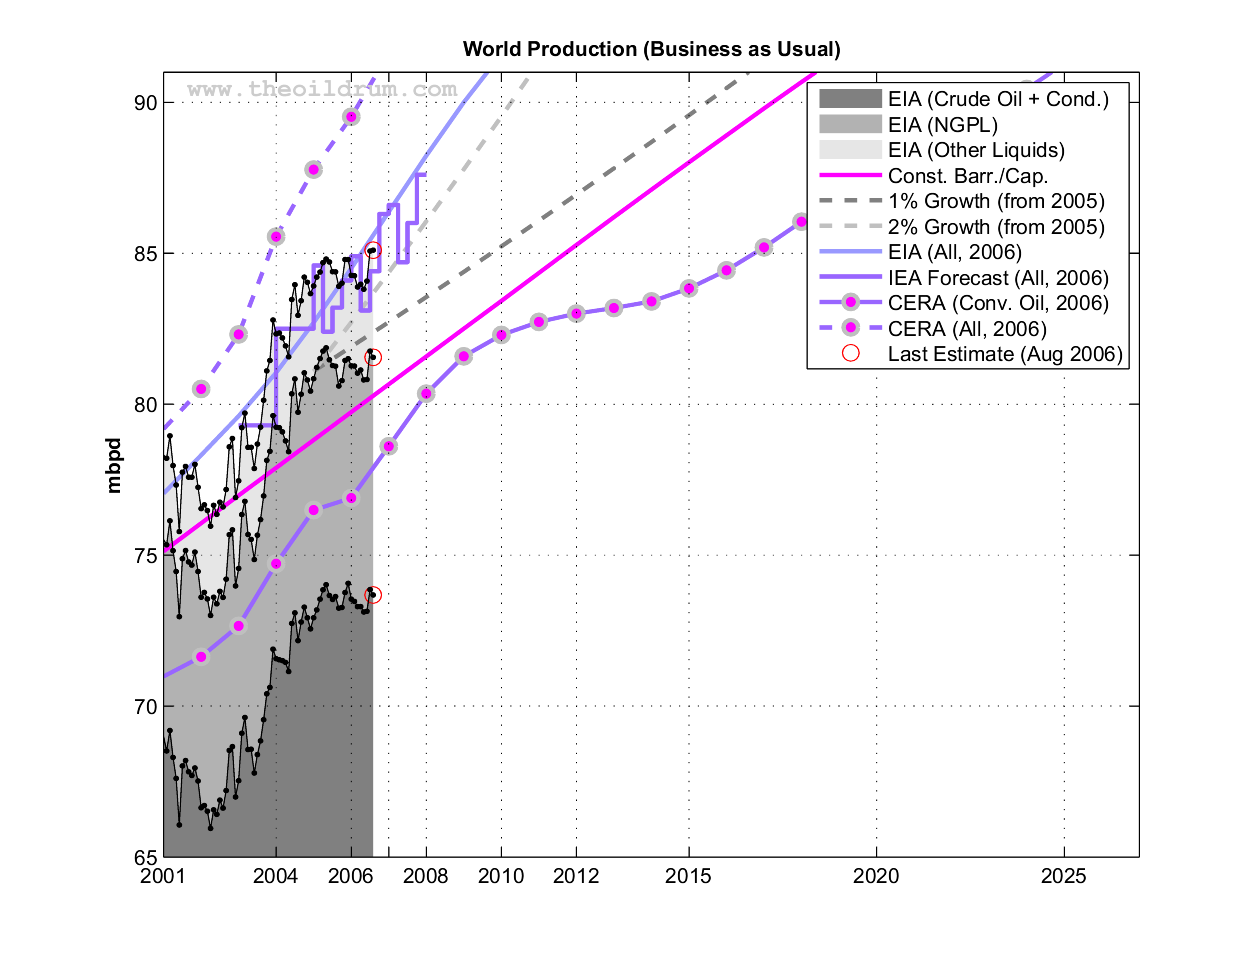
Fig 3.- Production forecasts assuming no visible peak. Click to Enlarge.
PeakOilers: Bottom-Up Analysis
- Chris Skrebowski's megaprojects database (see discussion here).
- The ASPO forecast from the last newsletter (#71): I took the production numbers for 2000, 2005, 2010, 2015 and 2050 and then interpolated the data (spline) for the missing years. I added the previous forecast issued one year and two years ago (newsletter #58 and #46 repectively). There was no revision since August 2006.
- Rembrandt H. E. M. Koppelaar (Oil Supply Analysis 2006 - 2007): "Between 2006 and 2010 nearly 25 mbpd of new production is expected to come on-stream leading to a production (all liquids) level of 93-94 mbpd (91 mbpd for CO+NGL) in 2010 with the incorporation of a decline rate of 4% over present day production".
- Koppelaar Oil Production Outlook 2005-2040 - Foundation Peak Oil Netherlands (November 2005 Edition).
- The WOCAP model from Samsam Bakhtiari (2003). The forecast is for crude oil plus NGL.
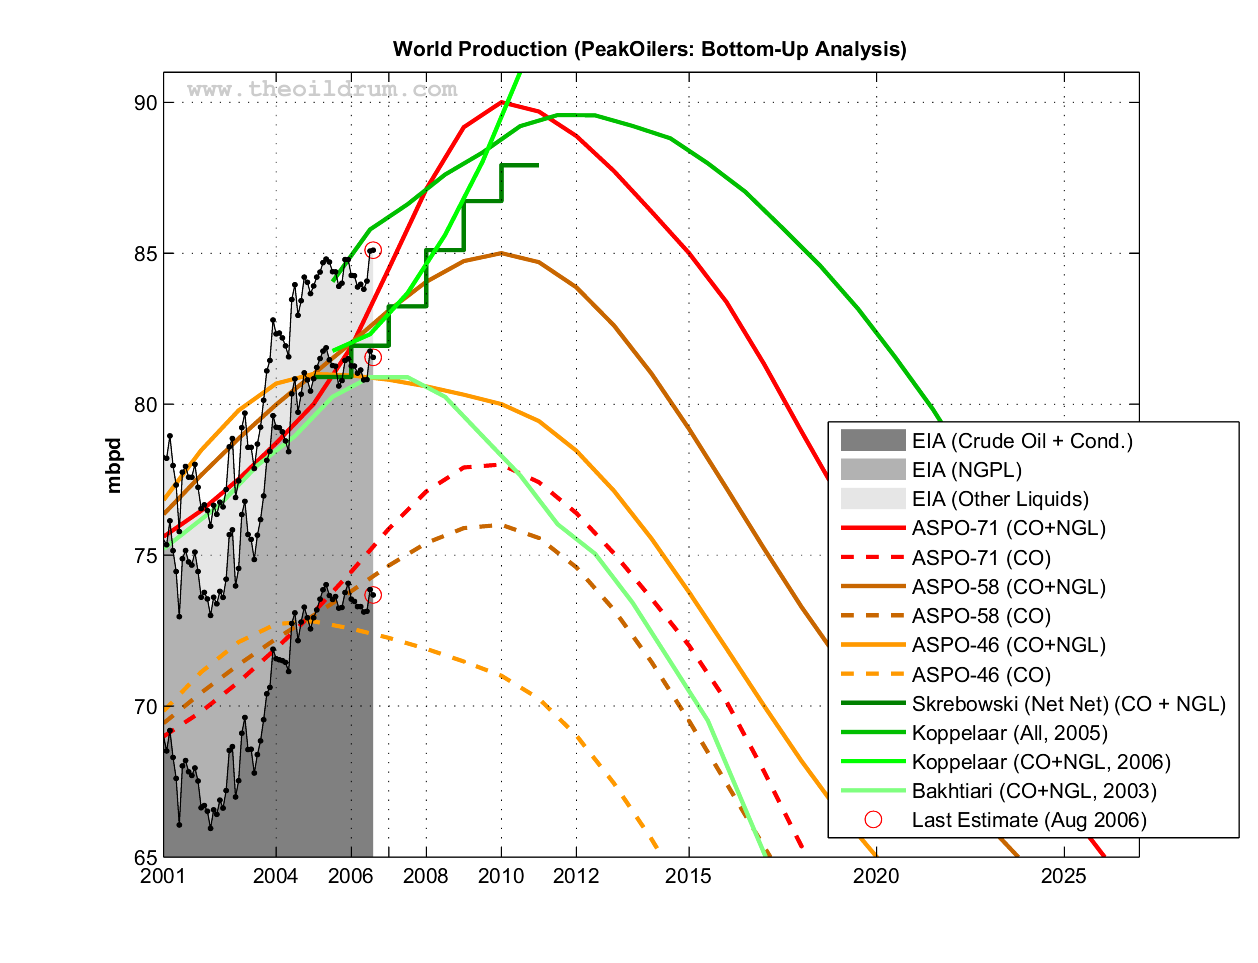
Fig 4.- Forecasts by PeakOilers based on bottom-up methodologies. Click to Enlarge.
PeakOilers: Curve Fitting
The following results are based on a linear or non-linear fit of a parametric curve (most often a Logistic curve) directly on the observed production profile:- Professor Kenneth S. Deffeyes forecast (Beyond Oil: The View From Hubbert's Peak): Logistic curve fit applied on crude oil only (plus condensate) with URR= 2013 Gb and peak date around November 24th, 2005.
- Jean Lahèrrere (2005): Peak oil and other peaks, presentation to the CERN meeting, 2005.
- Jean Lahèrrere (2006): When will oil production decline significantly? European Geosciences Union, Vienna, 2006.
- Logistic curves derived from the application of Hubbert Linearization technique by Stuart Staniford (see this post).
- Results of the Loglet analysis.
- The Generalized Bass Model (GBM) proposed by Prof. Renato Guseo, I used his most recent paper (GUSEO, R. et al. (2006). World Oil Depletion Models: Price Effects Compared with Strategic or Technological Interventions ; Technological Forecasting and Social Change, (in press).). The GBM is a beautiful model that has been applied in finance and marketing science (see here for some background). The estimation in Guseo's article was based on BP data from 2004 (CO+NGL).
- The so-called shock model proposed by TOD's poster WebHubbleTelescope . You can find a describtion of his approach on his blog here. The current estimate was done in 2005 based on BP's data.

Fig 5.- Forecasts by PeakOilers using curve fitting methodologies. Click to Enlarge.
Production Growth

Fig 6.- Year-on-Year production growth. Click to Enlarge.
| Forecast | 2005 | 2006 | 2010 | 2015 | Peak Date | Peak Value |
|---|---|---|---|---|---|---|
| All Liquids | ||||||
| Observed (All Liquids) | 84.41 | 84.30 | NA | NA | 2006-08 | 85.10 |
| Koppelaar (2005) | 84.06 | 85.78 | 89.21 | 87.98 | 2011 | 89.58 |
| EIA (IEO, 2006) | 82.70 | 84.50 | 91.60 | 98.30 | 2030 | 118.00 |
| CERA1 (2006) | 87.77 | 89.52 | 97.24 | 104.54 | 2035 | 130.00 |
| Lahèrrere (2006) | 83.59 | 84.82 | 88.93 | 92.27 | 2018 | 92.99 |
| Lahèrrere (2005) | 83.59 | 84.47 | 86.96 | 87.77 | 2014 | 87.84 |
| Crude oil + NGL | ||||||
| Observed (EIA) | 81.29 | 81.20 | NA | NA | 2005-05 | 81.87 |
| ASPO-71 | 80.00 | 81.90 | 90.00 | 85.00 | 2010 | 90.00 |
| ASPO-58 | 81.00 | 82.03 | 85.00 | 79.18 | 2010 | 85.00 |
| ASPO-45 | 81.00 | 80.95 | 80.00 | 73.77 | 2005 | 81.00 |
| Koppelaar (2006) | 81.76 | 82.31 | 91.00 | NA | 2010 | 91.00 |
| Bakhtiari (2003) | 80.24 | 80.89 | 77.64 | 69.51 | 2006 | 80.89 |
| Skrebowski (2006) | 80.90 | 81.42 | 87.32 | NA | 2010 | 87.92 |
| Staniford (High) | 77.45 | 77.92 | 79.01 | 78.51 | 2011-10 | 79.08 |
| Staniford (Med) | 75.81 | 75.94 | 75.52 | 73.00 | 2007-05 | 75.98 |
| Staniford (Low) | 70.46 | 70.13 | 67.92 | 63.40 | 2002-07 | 70.88 |
| Loglets | 81.12 | 82.14 | 84.65 | 83.26 | 2012-01 | 84.80 |
| GBM (2003) | 76.06 | 76.27 | 75.30 | 67.79 | 2007-05 | 76.34 |
| Shock Model (2006) | 80.76 | 80.43 | 78.27 | 73.74 | 2003 | 81.17 |
| Constant barrels/capita | 78.81 | 79.73 | 83.42 | 88.01 | 2050 | 110.64 |
| Crude oil + lease condensate | ||||||
| Observed (EIA) | 73.55 | 73.42 | NA | NA | 2005-12 | 74.06 |
| CERA1 (2006) | 76.49 | 76.89 | 82.29 | 83.83 | 2038 | 97.58 |
| ASPO-71 | 73.10 | 74.45 | 78.00 | 72.00 | 2010 | 78.00 |
| ASPO-58 | 73.00 | 73.80 | 76.00 | 69.50 | 2010 | 76.00 |
| ASPO-58 | 72.80 | 72.56 | 71.00 | 63.55 | 2005 | 72.80 |
| Deffeyes (2004) | 69.81 | 69.81 | 68.90 | 65.88 | 2005-12 | 69.82 |
Table II. Summary of all the forecasts (figures are in mbpd) as well as the last EIA estimates.1Productive capacities.
Next update in December.
Previous Update:
October 2006September 2006
Peak Oil Update - November 2006: Production Forecasts and EIA Oil Production Numbers
PDF version
145 comments
Peak Oil Update - November 2006: Production Forecasts and EIA Oil Production Numbers
PDF version
145 comments
“It is only through labor and painful effort, by grim energy and resolute courage, that we move on to better things.”
—Theodore Roosevelt
Contact
- Content: editors at theoildrum dot com
- Tech support: support at theoildrum dot com
License

This work is licensed under a Creative Commons Attribution-Share Alike 3.0 United States License.
Another thing--how about sending this post of Khebab's to someone new today...just one person...or talk to someone about this who you haven't spoken to about it before...or something new.
You can see why my efforts at doing HL work were cut short when I saw Khebab's work.
My point was that Hubbert was correct about the Lower 48 and that Yergin was wrong about a rising tide of oil driving oil prices down to $38 by 11/1/05.
Deffeyes, a former associate of Hubbert's, predicted a crude + condensate peak for late 2005.
Jackson, like Yergin before him, is predicting steadily rising oil production (from all sources) for decades to come.
I see a green curve, seems like Koppelaar CO + NGL ,2006, going out of the graph, never coming back in. Is this correct? Stranger even more so that Koppelaars' ALL, 2005, is less then CO + NGL, 2006.
I also note similar declines on the backslope of the curve for all (except this strange green curve going out of the graph) scenarios; all curves show the same steepness. I didn't know there was such a consensus on decline rate.
But start taking different routes to work
and check your Brake Hydraulics regularly... :-(
But next time you see him, wind him up by telling him the middle film was the weakest :-)
My Precious!!!
For info of those who don't know: there is another Jackson who was involved in production of the movie, Lord of the Rings --and "My Precious" is a line by the oger in that movie.
http://www.theoildrum.com/comments/2006/11/20/83027/063/5#5
Too bad Peak Oil is going to be lost in the cloud of geopolitics - which is what Dannyboy Yerginz et. al are counting (Betting) on and iw what they will use as their excuse for ever more - "If THAT didn't happen we would have been right!!!".
MY Peak Oil PRoJecTion:
A Head & Shoulders chart pattern starting with a rapid decline in world production soon (btwn Tomorrow morning and 2008 - caused by geopoliTICs), followed by a strong recovery in world production starting around 2020 (+/- 4 yrs), peaking by 2030, slightly below the GeopoliTICal Peak of 1980, and then ...
and then those who had successful Profoundly Local Plan Bz can get together and cobble the next civilization. Maybe.
Well, there you go again; making fun of the obvious.
Let's say I was an eXXceedingly large oil company and I wanted to donate $1,000,000 to CERA for all the good work they do, but I don't want it to look like a donation on the books? Why then I would simply order 1000 copies. Put it down on the books as an expense item: purchase of "expert" reports for distribution to, and reliance of by, the many nonexperts working here at my company.
WOPR
"Hello, Homo Sap. Would you like to play a game?
Though it doesn't look like any of the projections is matching reality all that well. Bahktiari is probably the best fit at the moment.
But should we not always rememeber that past "production" is actually demand ± stock draws?
The Loglets are still right in there though. This requires some careful thought.
I think only WestTexas and Bakhtiari do a good job of taking into account decline of the super giant fields and exports.
I think everyone else chooses to underestimate the effects and if you add them in it would bring most of the curves into agreement. Also I think that even with this the actual drop in production rates for the super giant fields is still underestimated. This is why I think you will see a steep cliff in the first few years post peak as we loose about 5mbd of production from the super giants then the slopes will follow the mathematical models. We won't know until they start into serious decline but I see no reason to expect the decline rates of the super giant fields to be shallow. Most have been produced using advanced extraction methods and these seem to lead to collapse of fields after they past their peak. Once these are gone we could even see the remaining oil production rate increase slightly later as the world oil prices spiral or at least a sort of plateau.
The reason is oil will be expensive allowing marginal extraction and next other existing fields will probably be driven beyond sustainable pumping rates for a time.
After this period of semi-stability which which might not last even a year I see another round of fairly steep declines as more fields fail.
Thus overall I think we will see a 10mbd loss the first 5 years post peak. This is caused by a combination of crashing giant fields reckless extraction and political turmoil.
Since the world peak looks a but spread out its tough to say when the clock starts ticking but 2007-2008 looks about right this its a 10 mbd drop by 2012-2013
This is almost in agreement with Bakhtiari actually I think he is still to optomistic on political factors and I think WestTexas is correct on a increasing export land effect.
Think of a world without KSA thats what we will be facing.
Maybe if we could get those numbers out in the open, we could start to actually work on the theory about why they might be declining. Until then, we might want to consider why they are rising.
WestTexas has posted his export land model a few times.
It needs a permanent home I suspect.
Now if some one can figure out political risk factors in a declining export world.
WestTexas is would it be possible to overlay your export land predictions on top of these models ? I'd love to see the results.
EU Oil Import Export model here:
http://europe.theoildrum.com/story/2006/9/22/95855/4850
So do you have data showing Norwegian oil exports rising? Curious to know - cos I'm turning up loads of BS numbers all over the place these days.
As for Salmon fishing in Alaska - just send the tickets!
As predicted, KSA has joined Norway in showing lower production,and one could reasonably infer, lower exports, given the rapidly rising domestic consumption.
I posted a note from a Russian agency a couple of weeks ago that Russia, through August I believe, was showing a 2.5% drop in year over year oil exports.
So, as predicted, it looks like all three of the top oil exporters are showing declining exports (and note the decline in US total petroleum imports that began at the end of September. The decline has been so sharp that even Forbes Magazine had a brief comment on it.)
The falloff in exports from the top exporters is somewhat analogous to the near certain decline of all four of the current super giant oil fields.
Could someone remind me again why we are supposed to see rising exports (when the top exporters are showing lower exports) and rising world oil production (when all four of the current super gaints are almost certainly all in decline or crashing)?
If you are really comparing our imports this year to last years, at least acknowledge the circumstances and not speak as if your word is The Truth.
Of COURSE our year over year imports are down when you compare them to last year: we had half a million bpd of production shut off for almost 6 months! We didn't draw our crude oil only from the SPR, we imported a lot more then we normally do! Now that a good portion of that production is back up and running, and couple that with the fact that we AREN'T buying crude oil to replace what we used from our SPR last year, the only logical outcome is a declining import rate!
Am I the only one who sees this for what it is?
' (AP) - PARIS-The governments of 26 countries agreed Friday to release the equivalent of 2 million barrels of oil per day from strategic reserves to cope with the aftermath of Hurricane Katrina, the International Energy Agency said.
The Paris-based IEA said its member countries "unanimously support" the measures, which will take effect for an initial period of 30 days. The IEA board will meet in two weeks to review the situation, it said.
"This coordinated response will free up extra supplies to help the market deal more effectively with the disruption caused by Katrina," said British Energy Minister Malcolm Wicks. "This is a global oil market and so a multilateral response is the right way forward."
France said it had agreed to contribute the equivalent of 92,000 barrels of oil per day in refined products - mainly gasoline - and Spain said it will release 70,000 barrels of oil equivalent per day.
The German Economy Ministry said the country would contribute about 6 percent of the total. That would be about 120,000 barrels a day. Britain said it plans to release 73,000 barrels of oil a day for the next 30 days. Portugal also said it would support the IEA plan.
"This request is part of the solidarity effort toward the American people, severely affected by this meteorological cataclysm," the French Industry Ministry said.
Katrina ravaged the Gulf of Mexico coast, shutting down 1.5 million barrels per day of oil production and 2 million barrels a day of refining capacity, according to the IEA.
Under the terms of the international agreements underpinning the IEA, almost half of the emergency stocks released will come from the U.S. Strategic Petroleum Reserve. That - unlike many European states' stockpiles - is almost entirely made up of crude oil rather than refined products including gasoline.
The IEA's American deputy head, William Ramsay, said Washington might have to review its stocks policy as a result of Katrina.
Until now, said Ramsay, a former U.S. ambassador to Congo, "it's always made more sense economically to have the crude on hand and then refineries can turn it into products depending on the requirements of the market at that time."
"But this particular incident is probably going to raise questions that maybe some product stocks would be in order," he said.
The IEA urged members Friday to prioritize gasoline, and France indicated its contribution would be in refined products, mainly gasoline.'
http://209.85.129.104/search?q=cache:YbNL4eqWOzQJ:news.findlaw.com/scripts/printer_friendly.pl%3Fpag e%3D/ap/f/66/09-02-2005/637d0054b286e8c3.html+Katrina+EU+IEA+refined&hl=de&gl=de&ct=clnk &cd=3
The article is really quite good, and a shorter one at http://english.people.com.cn/200509/06/eng20050906_206914.html should help you see just how many people pay attention to what is going on.
Truly, some reading and some information collecting could be useful.
Of course, you are welcome to look at different numbers and assumptions, but be careful in conclusions.
At least for Europe, the exporting countries are exporting less, apart from Russia - who keeps warning they can't keep production up without massive investment, but who is also likely one of the most wasteful oil users in the world, meaning that with efficiency/conservation gains, they could export more without actually reducing their standard of living - I can imagine that Germany will be particularly interested in selling them such technology. But in the case of Britain, they are no longer an exporter, and Norway's output is declining.
Of course, Britain could become an exporter again - they just need to cut their own use of oil by 5% or 15% this year - and again the next year, and the next. See where this is going?
Again, questioning numbers and assumptions is what makes the discussions worthwhile here.
Understanding the numbers and assumptions is part of the basis of the debate, however.
For example, you may want to try to find out how much oil production was 'permanently' lost (in quotes because the oil is still there - sort of like the lost oil from stripper wells in the 1980s) in the U.S. after three 'unusual' hurricanes in two years - you need to subtract that from your temporary supply disruption, as that lost production is still lost. And it was made up by imports.
The export land model is a valuable contribution - its details and implications are certainly open to discussion, but if you think, for example, the world's largest oil producer (and no, that is not America's cuddly friend in the Middle East anymore) is more concerned with selling its oil to the West based on contracts than using it for its own purposes, you really need to learn a bit more about the world we live in.
Though if you want to rely on a nation currently headed by an ex-KGB agent as being a friend of contract law and free markets, please, be my guest. It is about as realistic as assuming that in the next few years, those same massively in debt Americans who are currently buying more large SUVs again will replace such vehicles with ones that at least allow someone to plausibly claim that it is possible to maintain an automobile society without fundamental changes.
That is the entire contention. He believes it is perfectly following his export land model, when in fact it is not. As it was so well put above, our crude oil production declined, and to compensate others released their petrol products for our use. Now that a good portion of our crude oil refining and production is back online, our products imports have declined, while our crude imports have gone up.
If anything thats case closed on WT on this issue.
I think you are not quite grasping the concept of the export land model, as compared to detailed predictions based on it, which could be about as flawed as most other predictions.
Further, you didn't address Britain at all, which is an excellent example of export land dynamics, even if it is considered to be a poor HL model. The British are about to suffer a nasty little trade deficit hole because the oil which everyone knew would be available just isn't coming out of the pipeline. Which is a huge surprise to many professionals, experts, and other parties who still think next year, reality will return to following their projections. The pipeline is the final determiner, nothing else, regardless of what any of us believe. Britain could return to exporting status, after all - they just need to cut their own consumption - which they haven't. Hmmm - internal consumption overrides external economic considerations. And to be clear - it wouldn't surprise me in the least if some month in the future has a higher production volume than Dec. 2005, or August 2006, or whenever - fluctuations are to be expected in the real world, and with oil seemingly stable around $60 a barrel, I'm sure a lot of short term effort is going into maximum production and the speeding up projects to take advantage of high prices - after all, no one at all knows what the price will be in two years. Though keep in mind, lower price leads to lower production - thus a collapsing price reinforces lower production dynamics, it doesn't remove them - which is one of Simmmons's points, by the way, regardless of what anyone thinks of his data - he already lived through one of those cycles, after all.
You seem to focus quite tightly on single points, which is certainly a valid perspective, without realizing that various people here don't attach themselves to any single perspective at all, instead, they recognize the immense complexity and imperfect understanding of any human enterprise.
For example, I am very, very certain that the export land model will apply to Russia, since it fits perfectly into how Russia has been developing over the last 15 years. I have my personal doubts about its application to Saudi Arabia, Kuwait, UAE, etc., since I think those lands may try to go up the value chain, and instead of shipping crude will instead ship refined products or end products, like fertilizer (realistic or not, it makes economic sense), and local consumption will not be that significant. And while a shift from crude to refined products may be very painful for the American oil industry and consumers, it is not quite the same thing as rising internal consumption, and will not be reflected in lower crude production numbers.
As for Latin America, apart from Mexico, do keep in mind that they would rather use their oil for themselves compared to sending it to the U.S. - and quite honestly, the U.S. has been involved in some nasty business in Colombia for decades, much of revolving around oil and pipelines, just to make certain the oil flows north. Let's just say that an anti-drug war sounds so much more noble than an oil war.
The real insight of the export land model is attempting to open eyes too long resting on free market ideology, which is not universal - as pointedly noted in my first post, do you really think that an ex-KGB agent is now a defender of freedom and the American Way? Or he is a big friend of international capital?
The U.S. will be competing for declining exports, and the factor of internal consumption/reduced crude exports in various exporting countries simply reduces the amount of oil available for export. How significant the effect is can be measured in different ways, but any reduction is part of what peak oil is about. And it definitely intensifies the effects for oil consumers, who will be competing for a pool of oil which is shrinking faster than expected.
Or else it will lead to smash and grab - but that is another topic, at this point.
In any case, in regard to my Export Land article in January, I predicted that Russia and Saudi Arabia would join Norway in showing falling exports, and that is exactly what we are now seeing--based on reports by the Saudis and Russians themselves.
In regard to recent US Total Petroleum (crude oil + products) imports, I have been using the (four week running average) number for 12/31/05 as my index number, 12.9 mbpd. US imports fell below the 12/31 number starting on 9/29, and they have been down since then, to 11.5 as of 11/10, down about 1.4 mbpd, or about 11%, from the 12/31 number. We have been meeting demand by drawing down inventories.
I suspect that Hothgor's renewed attacks on yours truly may have something to do with my commentary published on the Energy Bulletin this morning (from ASPO-USA).
I do have a request for our good friend Hothgor: Since you are a self-acknowledged expert on all energy matters, why don't you write a comprehensive article outlining your views and submit it to the Energy Bulletin?
Do you have earler data? It would be interesting to look at the trends.
MMS Gulf report:
The cumulative shut-in oil production for the period 8/26/05-3/22/06 is 139,376,908 bbls, which is equivalent to 25.46% of the yearly production of oil in the GOM (approximately 547.5 million barrels).
= 7 days of annual U.S. consumption.
The cumulative shut-in gas production 8/26/05-3/22/06 is 692.299 BCF, which is equivalent to 18.967 % of the yearly production of gas in the GOM (approximately 3.65 TCF). = to 11 days of annual U.S. consumption.
The first are the sum * 7 for 10 weeks Sept 1 thru Nov 3 for 04, 05, and 06
705,292 - 04; 663,110 - 05; 723,226 - 06 in K of Brls.
The second are the sum * 7 for 52 weeks Nov 10 thru Nov 3 for 04, 05, and 06
3,612,763 - 04; 3,687,754 - 05; 3,696,091 - 06 in K Brls
Of course, at some point in the not too distant future, a precise discussion of oil will be no longer the point, as oil will no longer be the single source of energy for road transport and agriculture. PHEVs, biofuels (Germany is already somewhere around 6% biodiesel I recall imperfectly - this all very hasty), and so on will play a larger role.
As a side note - .7% increase sounds roughly (very roughly, from very spotty memory, and recognizing that the numbers decline over time) like the amount permanently lost in production over those two summers - somewhere between 50-100 kbpd.
Thanks the reason for the intrest is that the most important time period will be the period that oil supply drops by say 4 mbd. This is the point at wich Peak Oil cannot be denied.
So lets assume export land is causing a 2.5% decrease each year.
Depletion is causing say a 4.5% decrease.
Demand is going up by say 3% each year.
In only 3 years we have demand up 9%.
Say we peak now at 85 mbpd so in three years demand will be 92.7 mbd
ExportLand plust depletion is 7% so production is at about 73mbd this give a difference of
92.7 - 73 == 20mbpd.
My point is if we are at peak now we are going to be in serious trouble within just 3 years of peak oil.
Even if I have over estimated by 50% the effect we would still be down 10mbd from demand.
This is huge and its not 2010 when we see major effects from peak oil. CERA undulating plateau only delays the effects of peak oil by a few years if any. The point is demand is going to rapidly out strip the growth of the oil supply basically in 2007 and we may see significant effects as early as 2008.
This assumes a peak in 2005. Oil is required to grow our world economies and our monetary systems are based on growth.
Even if I'm wrong about the date of the peak this sort of analysis points to major effects from even a plateau in production within a few years of its onset.
2007 will be intresting.
His figures, as stated in the graph above, are for "crude oil and natural gas liquids."
http://www.sfu.ca/~asamsamb/homedown.htm#
Anyway, I will send an email to Bakhtiari to have a confirmation.
yr bakhtiari iea (2005)
y2k 75 76
2001 76 77.2
2002 77 76.7
2003 78 79.3
2004 79 81
2005 80 85
2006 81 85
2007 81 88
2008 80 90
yr CO+NGL WOCAP ALL
2000 74.9768 74.7154 77.7932
2001 74.8785 75.6911 77.7174
2002 73.9966 76.6667 76.9567
2003 76.5600 77.9675 79.5655
2004 79.8547 78.9431 83.0049
2005 81.2266 80.2439 84.3381
The RMSE is 1.3926 mbpd for CO+NGL and 2.8716 mbpd for the "ALL Liquids". I don't see any evidence that the WOCAP model is closer to the "All Liquids" numbers. The only year where the WOCAP is closer to the All Liquid level is 2002.
Below is the corresponding chart:
There are many here who do not understand the practice of backtesting and baselines. If he revised in 2003, he would have used 1 2002 baseline. We can see from Khebab's table that Bakhtiari's 2002 figure and EIA's all liquids match almost perfectly ... as they should. How likely is it that he was 2.667-mbd (CO + NGL) out for his 2002 baseline in June 2003.
The man is a fraud and everyone in the oil sector recognizes this fact.
5 trillion barrels. Oil shale cna be extracted as easily as Ghawar.
"Absurb" is the kindest words I have for their models.
Alan
His Y2K figure includes:
64 conv oil
4 non-conv hydrocarbons
6 NGL
1.5
75 (his rounded total)
Bakhtiari admits using ASPO database. Any backtesting that he did in 2003 would have used the IEA & ASPO figures for Y2K. The man is a liar.
Great work!!
And many thanks for including links to more detailed expositions of each analysis. A big benefit to new arrivals and TODders seeking a memory refresh.
Cheers!
The other point I would make is that in general there is so much information here it is hard to present it cleanly. You've done a good job in terms of separating it out in the subsequent graphs, but the main graph on the front page is IMO too confusing. I can't help thinking that an uninitiated person looking at that would just throw up their hands in despair at the complexity, curves going every which way. It seems to send a message that nobody knows what they are doing (which may in fact be accurate, but I'm not sure it is the message you intended to send!).
The average American isn't going to be able to interpret that graph. Heck, even my engineering colleagues wouldn't understand it.
We throw around terms like URR and Bahktiari and expect ordinary folk to get it. No way. Even ordinary peak oilers probably won't understand. This graph is meant for peak oil geeks.
This isn't necessarily a bad thing. As Bart pointed out, we all have our roles, and TOD's is the geeky number-crunching.
But if we want to "spread the word," we can't just send this URL to ten of our closest friends and ask them to pass it on. It needs to be translated first.
Khebab, I like it the way it is - a nice concise update of where we are. Whatever the format, keep these puppies coming.
I was responding to PG's request that we forward the link to "someone new." I'd love to, but I don't know anyone who'd understand it, who isn't already reading it here.
It is especially effective in showing most analysts predictions of a peak 2006 to 2015 versus the CERA prediction of a 2035 peak for conventional oil. Obviously the guy way out in left field (CERA) is suspect to be wrong.
Another value in these graphs is the revision of peak production to lower number as time has progressed. Such is true with EIA's revising from peak about 130 MBPD (2004) to 118MBPD (2006).
So perhaps you could have 5 or 6 images, the first of which shows the EIA and EIA numbers, then the next includes a few of the main plots, then so on and so on - the final image would be as busy as the one you have now, but at least someone could follow how it was built up.
Also if I might add - perhaps use a wider variety of colours for some of the plots - some of the blues are too close together in shade.
Is there any way that Table 1 could be made permanently available on TOD, perhaps in a stats section? I think we'll all be following it very closely, and the numbers are constantly being referenced in TOD comments.
chemist (n) 1. a narrowly bright person who cant do math, and cant stand the sight of blood.
You can also use that for your posts, Khebab, as it may speedup the way you post information. You select the right information to display and embed the information in your post.
For example, the following URL uses the logic I am thinking about: http://userpages.uni-koblenz.de/~krienke/wetter/wetter.cgi - I am sorry, it is in German and has nothing to do with Peak Oil, but rather with displaying of wind velocity or humidity, but you may get the point. On this page you can select the time span you want to have displayed and then the graphs below are redrawn on the fly. When you add a selection list allowing the user to select the sources for the graphs he wants, then we would have a helpful tool.
Of course, such a mechanism has to be supported by the webserver. And, such a tool has to be programmed to fit the needs we have here.
Some technical background: such a mechanism can be provided with the GD library that can be used with Perl which should allow maybe SuperG or any other programmer in Perl to get such a display tool putting together efficiently. A description of the Perl program library can be found http://search.cpan.org/~mverb/GDGraph-1.43/Graph.pm
Thank you for including Laherrère's curves this time. Let me ask bit more, if you don't mind:
. Instead of including Laherrère's 2005 curve, could you show his CO projection next time? It is very close to the Loglets.
. Could you include IIASA's projections? Just to have a good laugh!
Oil and gas: what future? (pdf)
His latest work is allways found at http://www.oilcrisis.com/laherrere/. In these papers you'll also find IIASA's numbers.
Laherrère's projections for All Liquids and Conventional Oil have been static for some time, since he could properly model the new cycle in Offshore production.
My feeling is that it is the NGL's we really need to watch - with increasing amounts of wet gas being produced around the world - NGL's may become increasingly important.
I picture an Economist and a Scientist entering the debate room.
The Economist proposes the following: "You, Mr. Scientist, say that we should assume your Theory of Thermodynamics is the correct model of the Universe and we should take it from there. I say what is sauce for the goose is alphabet soup for the linguist. By all measures of fair and balanced treatment, you must therefore accept that my Theories of Economics are the correct model of the Universe and we should take it from there."

Debate Club
Would it be practical to do this:
Fit the models using the subset of data ending say 15 years ago i.e. from "start of data" to 1991. Then project each of them forward into the period of time from 1991 till present and see what consumption they predict during that period. That would, it seems to me, give some insight into the extent to which they have the power to predict actual behaviour 15 years beyond the end of the data set used to fit them.
Hope this is clear...
I want to send them a short letter asking if the editorialist actually read CERA's data and actually fact-checked its assertions, because the report is highly controversial and should be viewed with circumspection.
What else should I say? What is the biggest problem with this report?
They don't allow very long letters, so I need to keep it simple and to the point.
The way to hammer CERA is focus on their lack of peer review of data and methods. Peer review undergirds real science. CERA is a pretender unless or until they submit their work for review like any other scientist in the world. Otherwise CERA is just demagoguery.
If they want the world to take them seriously, the world should demand peer review and data transparency.
That's right, especially for a highly profitable division of IHS Energy. It's not science, it's -- to quote from The Godfather -- only business.
If there's so much oil sloshing about, then why oh why are the oil companies spending billions to develop far offshore fields like Jack2 (3 to 15 billion barrels spread over 300 sq. miles and more than 5 miles below the surface of the Gulf)? They would only go after such extremely expensive oil, which can only be produced at modest volumes per day, if they had no better way to make money. They're doing it, therefore that's the best option they have.
Don't be surprised if you're ignored. I wrote a reply to my local paper about a "we can drill our way to independence" op-ed recently, pointing out what things like Jack2, etc., mean, and it wasn't published.
Speaking as an ex journalist (computer field), newspapers are about the worst place to try to have such a debate. They're staffed by generalists who, by the nature of their business, have to make coverage decisions about a lot of specialized areas that they know zip about. I'd bet that most newspaper people think 1) the US imports no more than about 25% of its oil, 2) most of those imports come from Saudi Arabia, and 3) SA is by far the largest exporter of oil in the world. Good thing those people aren't in a position to, you know, influence people.
Yeah, thank god for that.
Other than that, I totally agree with you. ;)
Perhaps 1,000 years from the Rape of the Sabines to Romulus Augustulus.
Alan
There is a huge difference between measuring regular progress and having a short term viewpoint. If I say that a glacier is melting faster than it was 90 days ago, my concern is not how the glacier will look in another 90 days, but on what the world will look like in the next generation.
Further, there is genuine concern over the obsession with quarterly bottom lines. Absurd suggestions have been made, like making it illegal to publish quarterly reports, but while such suggestions recognize the problem, they would not help in the least anyway. The real way to sway the behavior of the corporate world would be to change the rules of the game. Significantly raise penalties on shorter term gains. Ease penalties on capital gains from longer term investments. But right now the system is skewed and anyone familiar with the market knows it. No it is NOT 100% of every MBA doing the wrong thing (which was your false, absurd, ridiculous, strawman argument), but there are enough doing so that the market is less "investment" and more "betting sport" than anything else these days.
Markets, companies, investors and MBA make long-term capital investments which, by definition, provide returns over a long timeframe.
It's too bad, because you have dodged what could be a useful discussion. The short-termism of the market is more closely related to ignorance of externalities and high discount rates (as pionted out by Dave and Nate).
Corporations fiddle earnings over short periods of time because these are the benchmarks they are measured against. But this has nothing to do with making long-term investments.
If you had to bet on the results of a marathon and were given information about the position of runners every quarter mile, you might switch your bet several times during the race. However, the investment payoff is long-term - 26 miles.
Your comment
is not only wrong, but another debating tactic like the ones you purport to criticize. Modern finance research and practice knows that value comes from the long term cash flow produced by an asset. Look at Google, worth over $500 per share today. Is that based on huge earnings next quarter, or the long-term prospects of the company?
Now, the answer to every question about Social Security solvency can be "We'll have fusion by then, and unlimited amounts of energy solve all problems." There is something to be said for this from a cost/effectiveness perspective for many issues. The Hirsch Estimate pegs adaptation at 20 years, going with that we should pay attention only early enough to gain public consensus to take action by 20 years before the fact.
Is there a place where I can find a layman's analysis of this information?
http://www.theoildrum.com/special/acronyms
It'd be great to include IEA numbers, but they are a pain cause they put them in PDF and they keep revising all the figures (I know - I have my own very basic spreadsheets).
Don't burn yourself out Khebab - we need you here for the long haul :-)
If you're not reading TOD, you haven't got a clue!
cheers
Phil.
I have to agree with my ASPO colleague Phil on this one. Great work and we admire your work here in Australia.
Regards
David Bell
AKA Beacon Boy
Could you do a graph that shows the differences between EIA Crude/Condensate, EIA (NGPL) and EIA all liquids to see how the crude part has fared over past decade relative to all liquids?
Thanks
The share of crude oil + condensate is now only 86.6% down from 93% in 1980. The share of NGPL has increased from 5% in 1980 to 9.80% in 2006. The share of CO+NGL seems to have peak in 1986 around 98.2%. Note that the share of the "All liquids will always increase because of the refinery gains which is basically a volume expansion factor on the portion of oil that is actually refined.
It is a work of art and it just might spark a conversation or two.
For Crude Oil + Condensate, the peak is still in December 2005, and the peak for Crude Oil + Condensate + NGPL is now May 2005.
I took the average of all the peak dates given in "Fig 6.- Year-on-Year production growth"
You knoe its that whole wisdom of crowds thing.
I know I know they are peak dates for different combinations/types of oil but all are still basically oil.
Interesting to note that peak oil will occur the same year the Mayan calender will end.
Ethanol is not oil, as the creation of it borrows heavily from the other fossil fuel stocks, including oil itself
That is scary. Or is it? How right have those Mayans been? ANy links?
Try here for the answers you seek.
That is not really true, the Mayan calendar rolls over a baktun, but does not end. The Mayan date in Dec 2012 will be 13.0.0.0.0. From Wikipedia "...[this] does not necessarily mark the end of the world according to their beliefs, but a new beginning or time of re-birth".
I prefer "new beginning" as a more positive message. We have a chance to convert to renewable energy and live in a better harmony with the Earth.