Peak Update
Posted by Sam Foucher on September 14, 2006 - 10:45am
I'm proposing to track the last production numbers from the EIA and check how well the different oil production forecasts are performing.
[Update by Khebab, 02:00PM EDT] I've just added two forecasts: Bakhtiari and Koppelaar
[Update by Khebab, 02:00PM EDT] I've just added two forecasts: Bakhtiari and Koppelaar
I put together the following production numbers and forecasts:

Fig 1.- World oil production and various forecasts (1940-2050).
A closer look on the 2000-2015 period:

Fig 2.- World oil production and various forecasts (2000-2020).
The observed growth rates are low but have been lower before (around 2001):

Fig 3.- Year-on-Year production growth rates (or decline rates).
So far, the Loglet analysis, Skrebowski's megaprojects and the population based model are the most consistent with the last production numbers. The WOCAP model (Bakhtiari) is also surprinsigly good especially knowing that this forecast is from 2003. The ASPO and Koppelaar forecasts seem too optimistic and the logistic curve too pessimistic.
Next update in October.
- Production data from BP Statistical Review of World Energy 2006 (Crude oil + NGL).
- EIA data (monthly and annual productions up to June 2006) for crude oil and lease condensate on which I added the NGPL production.
- A simple demographic model based on the observation that the oil produced per capita has been roughly constant for the last 26 years around 4.4496 barrels/capita/year. The world population forecast employed is the UN 2004 Revision Population Database (medium variant).
- Logistic curves derived from the application of Hubbert Linearization technique by Stuart Staniford (see this post).
- Results of the Loglet analysis.
- Chris Skrebowski's megaprojects database (see discussion here).
- The ASPO forecast from the last newsletter (#69): I took the production numbers for 2000, 2005, 2010, 2015 and 2050 and then interpolated the data (spline) for the missing years.
- Rembrandt H. E. M. Koppelaar Oil Production Outlook 2005-2040 -- Foundation Peak Oil Netherlands (2003).
- The WOCAP model from Samsam Bakhtiari (2003).
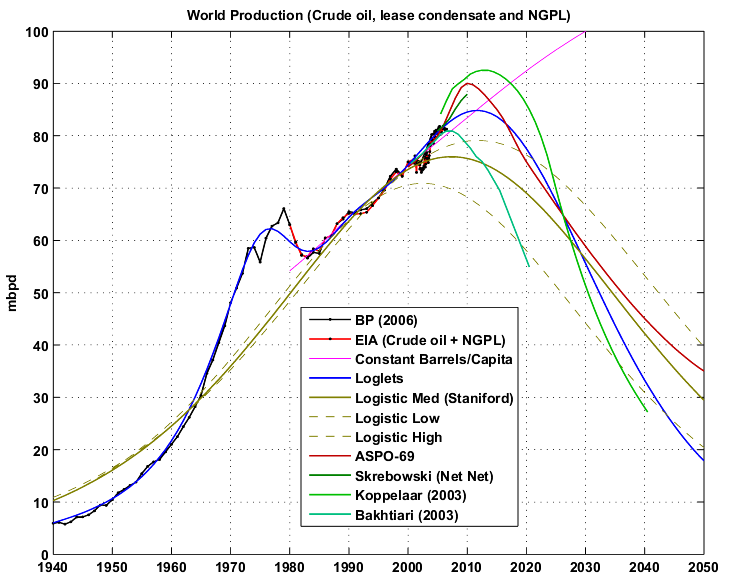
Fig 1.- World oil production and various forecasts (1940-2050).
A closer look on the 2000-2015 period:

Fig 2.- World oil production and various forecasts (2000-2020).
The observed growth rates are low but have been lower before (around 2001):
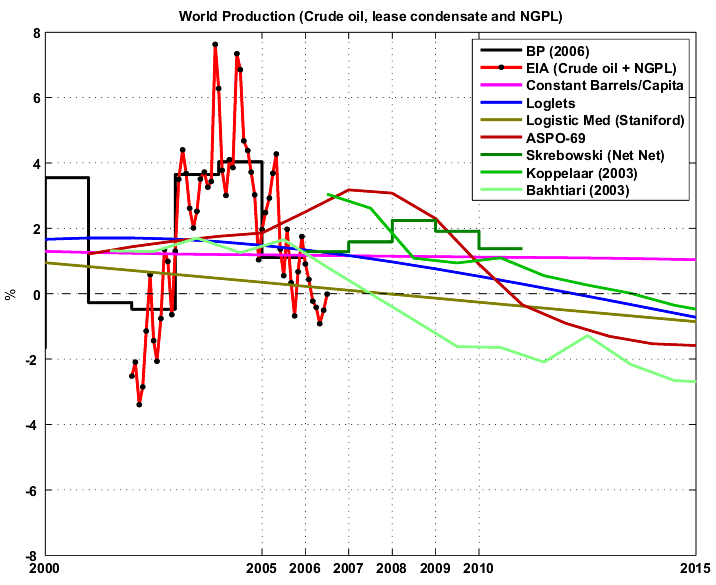
Fig 3.- Year-on-Year production growth rates (or decline rates).
So far, the Loglet analysis, Skrebowski's megaprojects and the population based model are the most consistent with the last production numbers. The WOCAP model (Bakhtiari) is also surprinsigly good especially knowing that this forecast is from 2003. The ASPO and Koppelaar forecasts seem too optimistic and the logistic curve too pessimistic.
Next update in October.
“What people need to hear loud and clear is that we're running out of energy in America.”
—George W. Bush, May 2001
Contact
- Content: editors at theoildrum dot com
- Tech support: support at theoildrum dot com
License

This work is licensed under a Creative Commons Attribution-Share Alike 3.0 United States License.
If the same happens with global production, we may well see a similar fall in production of 5% or whatever, before continuing with the predicted plateau and decline.
In the article, Hirsch looked for large oil regions that had definitely peaked and looked at the characteristics. He settled on
- Texas
- All of North America
- Britain
- Norway
And concluded:I note that a few posters here also use the same technique, to .. "enhance" the point they are trying to make.
Plus, I totally agree with your point, Khebab.
Does anybody know how to either post a single PDF page from a PDF file?
Or...even better... copy or cut a section of a PDF page ("crop") and turn cropped section into a JPEG, GIF, or something else "html" compatible as image?
Or...for the Grand-Prize...take data in a table which appears on a PDF page and export it into an excel spreadsheet?
Major points will be awarded.
Major points awarded.
Sometimes I want to save a chart in Excel as an image and have to paste them first into Word or Powerpoint, which gives the image options under "paste special", then back into Excel. Any better ways to do it?
With tables I use an option that ends up being PNG I think it is, it gives better large image quality than JPEG. Other times I use bitmap option. But mostly it is the Windows enhanced metafile, I think. I never use the paste as excel object option, it always screws things up. I always post into Word with images and then access image in separate folder like you laid out.
I have found another way in which PDF files can be made into other formats in the following sequence, and it allows latitude in editing pictures and text.
- Copy a PDF excerpt (or page) to a clipoard, thence paste onto Microsoft Power Point slide. With the resulting power point master adjust size, also add features text, etc as you may wish.
- Then save the power point in other available "save as" formats that include JPEG, TIFF, GIF, and other options, The power point slides and figures can easily be saved in all those formats, This is a really handy feature of power point
I have prepared several power point technical symposium presentatons then saved as JPEG to send the presentation around as a normal illustrated email. This approach using power points as an intermediate step also preserves fidelity reasonably for editing and anntating digital photos of all sorts for emailing.Major points also awarded.
Once loaded in Irfanview, you can crop any section of your screen shot and save it as a jpg or gif file. Irfanview also allows for easy resizing and basic color corrections.
I use this all the time at work for documentation purposes.
Sorry, non-oil issue. But totally and way cool nonetheless.
Ed
Can't check right now, because I don't have it installed on this computer.
Texas
North America
UK
Norway
Sorry, but cutting and pasting changed the backgrounds from beige to black for some reason. Copy and paste these side-by-side into your favorite image editor to verify for yourself that the percentage ticks on the right axis line up.
The point is the same. None of them have smooth logistic curve shapes. I suspect we know why: when production levels out, a producer increases the drilling rate to increase production. This attempt to increase production at peak succeeds temporarily, but at the cost of damaging the field and increasing the initial decline rate.
I respect Hirsch's work greatly, but I have read that particular report and found that sentence absolutely comical the first time I read it...
""The bell curve has a sharp crest, and you can't see it coming."
Would you define a "bell curve" with a "sharp crest" as being a bell curve? ( :-)
And if "you can't see it coming.", why waste time looking?
This stuff sounds like routine written by Stephen Wright! :-)
Roger Conner known to you as ThatsItImout
....I have a buddy who invented powdered water....now he don't know what to add to it...:-) Stephen Wright
ThatsItImout
http://gdl.msu.edu/~vanhoose/humor/0087.html
http://gdl.msu.edu/~vanhoose/humor/0049.html
Why am I not surprised to find Steven Wright fans here?
Take a look at Stuart's August 3 graph here:
http://www.theoildrum.com/story/2006/8/3/31559/92662
The new 85.5 IEA number is literally off the top of the chart. The EIA however is still at 84.3, right about where it's been the past couple of months.
If you look at the highlights from the IEA September newsletter, it states that August production fell by 400,000 bpd to 85.8. Thus, their most current July number has been revised upward to 86.2.
See http://omrpublic.iea.org/
Can you elaborate on the demographic model? Is this something you have just come up with? I find this line quite compelling - the last 25 odd years has seen very constant growth in demand.
I wonder if the world population may peak in 2012 (your loglet peak) - the only data flaw being the UN's optimistic view of a forever rising population - the demographic line would then follow the loglet down (which is a great euphemism for for famine and war)?
One further question - can you say what the NGPL correction is to go from bp to EIA?
We are apparently not dependent upon air, water, food, oil, shelter, etc.
Anyone who models the population dynamics of any other species besides humans makes the population dependent upon environmental factors.
...yeah, well, when a pig invents the birth control pill, I will consider it an equal....(that was sarcasm....
Roger Conner known to you as ThatsItImout
I've been meaning to get around to looking at global "economic growth", population growth and energy / oil consumption. I think this may be the scariest chart in the world.
I think the loglets are the best approach yet - but I still have a couple of niggling nit picking problems which I'd like to discuss over email - so please get in touch - otherwise I'll correspond through Westexas.
If you want to correspond with me, Super G has given us an email aliases:
Khebab@theoildrum.com
Therefore chickens listen to, and pay for, the radio.
Ice Cream and Sharks - the sun is out?
Skirt length and stock prices - breeding at time of plenty?
Cavities and vocabulary - age?
Population and energy - I'll leave that complex web to the experts
Oil economy -----> "green" revolution and food transportation and storage options ------> increasing populations.
The opposite will be true post peak.
Marco.
By the way, you're winning on our little oil bet today. I haven't been following it, but it looks like it has barely moved an inch.
I can only shake my head when I read these folks who think that we've turned the corner on the population issue. As if a slow down in growth were the same as a reversal in absolute numbers
I have been wondering if its possible to determine a finished oil product that is the most sensitive indicator of peak oil. What is the canary in the coal mine ?
I know that finished gasoline stocks are closely watched but I don't think they are the best indicator.
My proposal is that we track two commodities along with total oil production in volume and price. I think if we are at the peak that total oil production is no longer the best indicator of supply/demand curve for oil since by definition it won't be changing that much.
Thus I propose we also track.
Bunker Fuel and Asphalt.
The reasoning is simple both are traditionally cheap residues of the simple refineries for light sweet crude.
But if the world has peaked then a few things happen.
More refineries move to complex cracking processes lowering the yield of these residual products.
Refiners move to meet the demand for the highest priced finished product gasoline etc.
Now I've been reading on bunker fuel prices and they have increased dramatically in the last few years with actual shortages occurring. In fact there seems to be a crisis situation in the bunker fuel markets that goes almost unreported by the MSM.
Here are some articles
Asphalt
http://www.thepacket.ca/index.cfm?iid=1728&sid=13027
Bunker Fuel
http://starbulletin.com/2005/12/10/business/story02.html
So if we track the price of both these products which are really the scrap products of the traditional cheap oil/simple refinery production I think we can see the real peak in oil production better then just raw crude production numbers alone.
To add to my comment I finally found a chart of bunker fuel prices. Its near the middle of this page.
http://www.skaugen.com/archive/annualreport/2005/content/analytical.htm
Traditionally bunker fuel sells at a discount vs crude oil.
In this chart it seems this is no longer the case bunker fuel is now more expensive then crude oil and has become a competitive part of the product mix. This is a pretty significant change in my opinion.
I believe this reinforces my point that tracking these products will be a more sensitive indicator of the state of the oil supply around the peak.
indicating, yes, that bunker fuel has increased in price much faster than crude.
Don't know how bad this gets before it starts choking off trade? but bunker fuel is still a very minor part of the cost of doing business.
Asphalt is potentially more serious, because infrastructure and maintenance projects are slowing down all over the world due to cost blowouts.
Thanks for doing the link.
First the point is the two seem to be the leading indicators of peak oil. And bunker fuel is important since its no longer basically a waste product of the refining industry but must compete with gasoline production same with asphalt. This is a major shift in the economics of world trade.
If I'm right you will see the cost of bunker fuel and asphalt continue to rise until basically the products are practically no longer available since they would now be discounted only vs the cost of refining into gasoline/diesel fuel.
When we are really post peak I expect exactly that to happen and when bunker fuel is priced via a refining discount vs other finished products it won't be a minor component of world trade. Basically the shipping industry is going to be forced to pay refiners to not make gasoline/diesel fuel.
As with all my predictions only time will tell.
But bunker fuel can not possibly be priced off the market. I suspect that demand inflexibility is actually much greater than for gasoline, perhaps comparable with diesel. Because they actually make the world go round, unlike gasoline which is used largely for frivolous purposes. Many, many private individuals will be priced out of the gasoline market before shippers are priced out of buying bunker fuel.
If price really became a problem, then freighters would convert to burning coal anyway. Not a show-stopper.
But asphalt might be a show-stopper. You can only delay roading projects a year or two, then serious degradation sets in. Decadence. When the Romans could no longer maintain the aqueducts, the show was over.
You comments have given me this vision of soccer moms pulling up in their SUV's to a ship at port and battling it out with the burly sailors over oil.
Thanks :)
I don't agree if you impose rationing for bunker fuel you will cause a gasoline shortage. And bunker fuel is sold internationally so there is no easy way to ensure it remains easily priced who is going to do the rationing ?
Instead the price will be passed on to the consumer leading to higher prices for imported goods.
For roads I think what you will find at least in the US is that the miles and miles of country roads will go unmaintained and revert to gravel or the local government will make them private roads maintained by the residents. Considering how many miles of lightly travelled roads exist in the US this will hide the cost of asphalt for some time. Or of course god forbid raise taxes. Plus of course the cost can be hidden via increased highway subsidies and opening up the usage of these subsidies. And there is of course the chance for direct subsidies of asphalt costs or local rationing. All of these factors tend to cloud the cost of asphalt. I'm not sure how easy it is to track and demand destruction may make it less sensitive than bunker fuel.
As you said demand for bunker fuel is pretty ineleastic.
So of the two I prefer bunker fuel over asphalt demand is ineleastic it can't easily be regulated or subsidized etc.
The two together give a nice overview with volume of asphalt being a pretty good indicator of the amount of demand destruction occuring.
We are just going to have to watch and see how the trends play out.
But the main point is we should really watch the price and if possible the amount produced of both of these products vs the price of oil since I think they precisely determine the peak well before we see significant declines in output.
Its interesting that the crossover point for bunker fuel
priced above oil looks to be Jan 05 leading the earliest claim for peak oil. When we start declining we should see the spread increase steeply vs the price of oil even as production does not fall much. It does not look like we are past peak yet but are hovering around the top. I think these indicators will give up to a six month lead in detecting peak oil and decline rates over total oil production.
We will also see some effort given to taxing trucks by weight.
Mild steel for horseshoes might be hard to find as well.
To show this is true drive fast down a country two-lane blacktop road at night and watch the suprised deer in your headlights as it scrambles hard for traction. Smack! Venison for dinner tonight.
Ok..back to the regular scheduled debate.
Hear, hear. Asphalt maintenance may indeed become an issue, but perhaps we can cut down on frivolous roads as well frivolous road use.
But I suspect increasing asphalt prices will affect concrete prices as well, since that is the only serious competitor I know of. Only, the Chinese use even more concrete than oil nowadays...
http://www.solutionsmagazine.co.uk/newbuildings.aspx
Unfortunately the newbuildings mag requires a subscription.
While I know that that are a small number of ancient coal-fired steam ships still in active service, I'd be very surprised if anybody still makes coal-fired boilers for marine service.
It's not just a question of switching fuels. An oil-fired boiler and coal-fired one have major differences in the construction of the firebox, plus a coal-fired boiler needs to have provisions for ash handling.
However, I'm sure that if there is a demand for coal-fired marine boilers, the boiler companies can merely dust off some of their old blueprints and make one. It's just that I don't think you're going to be able to buy them off the shelf at the moment.
I fully agree that making an oil-to-coal transition for marine transportation would be a major undertaking. There would need to be coaling stations, coal-handling equipment, and a whole number of other logistical requirements. It could be done, but not without a great deal of messiness and expense.
One effect is that it would increase employment in the maritime sector. A coal-fired ship needs firemen, coal handlers, more maintenance crew, etc. Also more people for coaling stations.
Another point that some people need to realize is that it would probably be economically prohibitive to retrofit a coal-fired propulsion system into an existing ship, as it would require major surgery and a almost total rebuild of parts of the ship. When the use of oil began to overtake coal as a marine fuel, it was relatively easy to convert an existing coal-burner to an oil-fired system. Going from oil to coal is much more difficult.
It seems to me that the loss of some energy efficiency by going CTL would be more than paid back by keeping the same world wide infrastructure. Assuming that would work...
I would see no reason why the appropriate heavier fractions from coal-to-liquid production couldn't be used in existing oil-fired ship propulsion systems (with perhaps some very minor modifications to the burners and control systems).
As I understand it, much of the difficulty with CTL production is making the ligher fractions. So perhaps if a CTL were dedicated to making only the heavy stuff, such as bunker oil for use in ships, it might improve the economics and also allow more actual petroleum to be diverted to gasoline and diesel for cars and trucks. Just a thought.
It would be very hard for a fleet operator to buy a single coal fueled ship for an existing fleet. It would have to be done by either a small operator (dry bulk is disaggregated) or of significant scale in a larger fleet to enable shoring of spare parts and training of mechanics. Ships would also have to be able to count on obtaining new coal when they run out as easily as the can get new bunker now - ie. at every port of call.
Container and liquid bulk are neqwer fleets with higher value ships. My guess is they would be even less likely to consider coal.
Some fized route operators (liners, or Chinese fleets) muight also be able to do it as they can control their ports of call and could time them with fuel purchases.
Take powdered coal (good quality) and mix it with bunker fuel as an extender. It would need to be stirred every so often I suspect, no matter how fine.
Powdered coal + water. Venezula sells some NASTY stuff that mixes very heavy oil with water for use in power plants.
- Hypothesis : bunker fuel has approx the same energy density of crude oil or domestic fuel, about 45 gigajoules per metric ton
- Coal has half the energy density, 24 GJ per metric ton
(numbers from this conversion page)-- Coal in 2005 : about $60 per metric ton (BP spreadsheet)
- Bunker fuel : about $300 per metric ton (web sites)
So it would appear that, currently, bunker fuel is three times more expensive than coal for a given energy content.Historically, this is very high (in 1995, at $44 and $100 respectively, there was very little difference in energy/price).
So, if these high prices are not just a short-term effect of a supply crunch, but are here to stay, and if the economics of shipping is very sensitive to the price of bunker fuel (which I am not convinced of), then I would expect shipping companies to be already contemplating going over to coal, at least for new ships (which presumably have a long lead time). In a decade or two.
I wonder, will they be steam ships, or coal/electric?
Right of course they will switch to coal. I'm pretty sure it will be IGCC plants. And probably intially use some sort of coal mixed with bunker fuel.
Or maybe this which is coal powder mixed with water.
http://www.nationmultimedia.com/2006/08/03/business/business_30010216.php
Okay maybe your right at some point they will switch back to coal for shipping. Or would in theory.
The problem is there is
now no infrastructure to transport coal to the port manage it etc. The cost to build this infrastructure would be very high in the light of peak oil and competition for rail transport. I supect we might not be able to afford to switch.
Also at this point CTL processes would be competing for the coal. Also the global warming aspects of using coal probably won't be ignored at this time since we
will be feeling the effect and Bush will be gone.
Its a bit of a catch 22 situation also.
If enough ships switch to coal the price of bunker fuel would come down lowering the incentive to switch. I think the economics of going from a high quality fuel to a low quality fuel are quite different from the reverse. No matter how you calculate it oil is a much better fuel then coal.
I think that what will actually happen is they will simply pass on the costs to the consumer. Remember the consumer also has to pay the cost of overland shipping also. Eventually the expense will be one factor in reversing globalization. So at the end of the day we will probably do nothing. For the US this points to Mexico as becoming increasingly important over time as a source of cheap labor.
Here is a nice articel on the effect of the price of bunker
fuel on commodities.
http://starbulletin.com/2006/03/11/business/story01.html
The mention for a can of food the current cost is 7/10 of a cent going up to 9/10 lets just say it 1 cent now.
Does not sound that bad but 1 cent a can for food is a lot of money.
Found this link
http://files.bnpmedia.com/PS/Studies/N-Z/Files/PDF/OutlookForMetalCans.pdf#search=%22number%20of%20c ans%20of%20canned%20food%20consumed%20in%20the%20US%22
Now the total for the us is 32 billion so say 100 million added cost just for canned food in the use alone. I'm g uessing at the amount thats shipped from overseas this may be high.
But the point is you can multiply this number to see that the increased cost of shipping is in the billions of dollars. So its not trivial. Include additional shipping costs from overland shipping and your talking about a not trivial impact on the US economy. Some of this will be passed on to the consumer some will be born as lower profits. For a lot of products profit margins are low.
See this for example
http://www.foodmarketexchange.com/datacenter/laws/dc_lr_update.htm
I don't know how many cans of pineapple this company shipped
but you can see that profits are not large in the food industry. For import companies competing in tight global markets with profit margins hovering around zero this additional cost alone is enough to make them unprofitable.
Read this for example
http://www.newsandtech.com/issues/2005/11-05/nt/11-05_inkprices.htm
This is a american company and its problems are katrina related but it give a pretty good rundown on how high oil prices effect a company.
This is important the graph is using two diffrent measures metric tons and barrels
Assuming 7.3 barrels per metric ton ( prop not right since
the stuff is heavy )
we have one metric ton of oil == 400 dollars
right now bunker fuel is at 250 +.
Even though I made a mistake its even better since it means
my obeservation is a predition.
Mike
How many old empty parking lots can be bulldozed up and reused?
As shopping malls, heck how about the square miles of parking lots from closed MFG plants?
They'll be dug up and remelted and reused.
I heard that Asphalt is a VERY highly reusable product in the highway and parking lot markets.
We WILL DeConstruct/Cannibalize nearly EVERYTHING that is not being used in the future. Parking Lots, Cars, Houses, etc.
The FLEA Market/black market business is going to be incredible.
John
I think when people start stealing parking lots we can
assume peak oil has arrived :)
Walmart in Boonville will be closed today last night asphalt bandits stole the parking lot.
"Sous les pavés, la plage!"
Under the paving stones is the beach.
Need a new slogan. Death to cars! Liberate the roads!
For information on asphalt recycling look here: http://www.martec.ca/technology/asphalt_recycling_techniques.htm
Not sure what you mean by this. If you think the concept is wrong then explain.
The point is in the era of cheap light crude bunker fuel and asphalt was sold at a discount vs oil. Now with far more oil being refined in more sophisticated refineries they can crack the residual fraction to make more gasoline or use the coke process. In both cases the amount of residual oil drops and its not longer a loss product that it was in the past.
The graph shows this has already happened. I propose that this is a leading indicator of peak oil and when the price spread for residual fuel oil begins to increase rapidly then we know were at the peak.
What's happening is more and more oil is getting cracked to gasoline/diesel/jet fuel or other higher return products.
We are beginning to see we don't have enough oil for the bunker fuel/asphalt markets right now. Other methods cannot predict peak oil until it is well past this approach will tell us if we are at past peak within months of it happening. I think knowing this is a pretty big deal.
Why not the Canadian oil sands are basically asphalt there being converted to higher grade oils via cracking.
We can do the same with former waste fractions.
Please explain why you think the argument is flawed.
They are two different metrics.
Bunker Fuel demand is inelastic like gasoline. So you should
see the price curve act in the following manner.
1.) become more expensive then oil ( this has happened)
2.) The spread between the price of bunker fuel and oil will increase linearly ( this may be starting to happen )
3.) Increase exponentially at the peak. This is my main prediction.
1.) Corresponds with peak oil but leads it in time.
2.) corresponds to the peak
3.) corresponds to post peak or the decline phase.
The final situation 3 starts occurring because not only are oil supplies tight but production is shifting to produce more of the higher grade products per barrel. So the price of bunker fuel becomes a refining discount against the price of gasoline not a premium against the price of a barrel of oil. Note that during this time gasoline/diesel stock will be adequate but shortages of Bunker fuel will start to occur. This is why I'm saying its the lead indicator of peak oil. I know we peaked because of the cross over of price of bunker fuel vs oil. Now we just need to watch for the bunker fuel price to take off till its setting right below gasoline/diesel. Then the party is over.
Asphalt is more difficult to measure but interesting to watch since its market suffers demand destruction and as others pointed out recycling is possible I don't think that play a huge role though. The important point with asphalt is demand destruction i.e how many projects are delayed or cancelled at what price. You should see demand remain flat or even dip as the price goes up. I agree asphalt is messy but as far as I know its the first viable metric for demand destruction I've seen. Measuring demand destruction is not trivial.
Interesting concept. My problem is this:
The impacts on bunker prices and ratios of production seem to stem purely from price changes and not from factors unique to peak oil. Old hydroskimmer refineries (the lowest configuration that makes gasoline) produced about 30% fuel oil (or bunker oil).
As gasoline demand went up over the last decade, it was cheaper and easier to add hydrocrackers which would reduce the fuel oil production to about 10% and increase gasoline (or diesel).
As spreads between light and heavy fuels and products increased, this type (and other types) of refinery increased.
The resulting low level of bunker production may have resulted in a situation where small increases in demand push prices up. Shipping volumes have been up massively, which could account for it.
But all of this can be explained by price. I am not sure that the price of bunker fuel adds any information that can not be obtained from the oil price figure.
If you are looking for a second indicator, I think crack spreads could be more useful. First, since light oil would be depleted first, one would expect spreads to broaden. Second, the spread is not entirely determined by the oil price and can deviate from it.
On the refining side the only thing that is important is that most of them are capabable of hydro cracking or in general being able to upgrade their input barrels to produce more gasoline/diesel. So refiing is important to the point we have enough capacity to control the product mix. The number of simple refineries is decreasing each year at some point we will be able to refine more of each barrel of oil to gasoline/diesel resulting in less bunker fuel production then demand.
So on the input side we do have a refinery problem but this is fixed by ugrading them to complex refineries so they can control the product spread. You don't need all of the refineries converted but enough so that the bunker fuel market ends up under supplied or with tight supplies.
We seem to be in this phase now which is why bunker fuel prices are increasing. Per barrel of oil the product mix favors gasoline/diesel as we approach the peak.
I was actually wrong about having reached the crossover point I got caught on tons vs barrels. But right now assuming 400 dollars per metric ton for crude we have 250-300 dollars per ton for fuel oil. Its not quite crossed over yet but when it does it will be a valuable product not basically a waste product of refining.
Its only worth more when supply is not meeting demand which means we have a real shortage of the product. Once bunker fuel crosses over in price above crude we know we peaked.
The next point is when it flattens again below the price of other more refined products gasoline/diesel at this point its only discounted vs refining costs so your paying refineries to not produce gasoline.
To repeat myself somewhat.
1.) Crude supplies become tight refiners cannot meet gasoline demand with the current mix of refineries they upgrade by adding cracking capabilities.
Price of bunker fuel starts increasing because of tight supplies
2.) Gasoline demand met price of crude goes down
We have become more efficient now then in the past.
This is why gasoline/diesel prices are not a good indicator
of peak since you can always upgrade refining capability
to produce more gasoline from a barrel of oil.
No one else has postulted this to my knowledge but if we
can find numbers on the distribution of refineries complex vs simple this is easy to prove.
Price of bunker fuel stays high variable but high.
This is one of my major predictions bunker fuel prices
continue to creep upwards even as the price of oil drops.
They can be watched here
http://www.bunkerworld.com/index_fs.html
3.) More refineries convert to complex over time to continue to meet gasoline demand at some point the supply of bunker fuel is actually in a real shortage price rises until its above the price of crude. This is a important indicator since at this point we know for a fact that we are not meeting market needs.
4.) Bunker fuel prices hit the refining cost ceiling and remain discounted vs more refined products only by the refining cost. At this point your paying refiners to make bunker fuel. Their profit margins are similar across all products.
To date we have looked at supply and many follow gasoline prices but they are not the leading product indicator of peak oil my point is its the low end products that are the first to go into peak and post peak pricing. Also note I'm looking at relative prices not the absolute price which is variable. Whats important is that the consumer markets for a barrel of oil begin to compete to get the product they need. In the past bunker fuel was not really part of the product mix since it was sold at a discount with the price purely demand driven. This is no longer true in my opinion.
Now there exist a number of markets for residual oil. But in
many cases they can also use NG for example or there are other factors that allow for demand destruction. Bunker Fuel is nicely inelastic like gasoline the only overt controlling factor is the growth rate of the world economy. And since traditionally its basically a waste product with the price driven by demand its a perfect indicator of peak oil.
If you disagree then explain what should happen to the price of bunker fuel during and after peak oil.
Finally correcting for the metric ton to barrel conversion
it looks like we are not post at peak yet since now the price for bunker fuel is around 200-300 dollars a metric ton and it would need to be around 400 dollars to become a valued product. And of course you have to factor in any slowing of the overall world economy since this is really the only dampening factor on bunker fuel prices as we approach peak and crossover.
But, again, isn't this all explained by price. What does peak oil bring to the picture that mere high prices don't?
Likely, there is a scarcity effect in high bunker fuel prices, as Jack indicates. This means that the merchants (rather than the refiners : the distinction is probably important) are making a profit from the scarcity.
There ought to be some "natural" ratio between gasoline and bunker fuel prices, based on the profitability of one or the other. i.e.
- it may be that refineries will increase their output of bunker fuel because current high prices make it more profitable than gasoline (thus making the price trend downward to that natural ratio)
- or on the contrary, perhaps the upward trend will continue, as refineries become able to crack more and more gunk, until the final ratio is reached?
Either way, frankly I can't see why any of this is intimately connected with the oil production peak. There's a logical leap there that I can't follow.Refineries will not increase the production of bunker fuel over gasoline since gasoline/diesel will basically always be worth more. Or at least they won't until the price of Bunker Fuel hits its ceiling price which is the refining premium to convert it to gasoline.
I'm saying in a peak oil situation refineries will first upgrade to crack more oil no more simple refineries and second they will service the gas/diesel market first since this is the most profitable.
The first place we will see real shortages is in the bunker fuel market driving prices first above the price of a barrel of oil and next they will increase till they hit the refinery ceiling.
I made a mistake on the graph its in metric tons vs barrels so right now bunker fuel is about half the value of a barrel of oil.
Recycled asphalt paving has additional properties relating to grading of materials and how it packs, etc.... that make it desirable far beyond fuel.
cfm in Gray, ME
Curious that ASPO is too optimistic, though...
It makes sence to me that at least the ngl's might not be seen by logistics type oil curves because these reserves are of a type not economic in the past.
Now, who whould expect to see that? :)
Nice stuff Khebab, as usual.
The constant per capita curve crosses the Loglet right at peak.
What does it mean?
The differing numbers are used by Hutter to support his views, and by westexas to support his. Here we are preferring EIA data again. In the long run, I'm sure its a minor point, but as we observe figures at the moment, it does make a difference. I'm not sure what to think, myself.
Well, ASPO certainly seems to be getting more optimistic as time goes on.
For JUL 2006, ASPO put total 'Gas Liquid' at 276 Gb
For AUG 2006, ASPO put total 'Gas Liquid' at 354 Gb
... makes an increase of 78 Gb or over 25%
... equivalent to approx. 5 GOM mini-elephant discoveries.
Does anybody have the time to read through the ASPO September newsletter to see if there is any explanation for this wondrous change?
.This may explain why BP puts total reserves for end-2005 at 1200 Gb, while ASPO (since September this year) puts them at 2500 Gb.
And I was going to party like it was 1859 with that much oil left, see Drakes well in the middle of the page.
IF you guys are proven right over time, you will potentially become MSM superstars-- consider getting agents and PR flacks lined up ahead of time to run interference for you. Then, the MSM will ignore Lynch & Yergin postPeak, yet will pry into every detail of your lives. In public, you might have more papparazzi flash-cameras going off in your face than the late Princess Diana: it will be very disconcerting to you and your families.
Keep up your excellent work, but be prepared. Maybe Matt Simmons can give you guys good advice on handling the media.
Bob Shaw in Phx,Az Are Humans Smarter than Yeast?
In regard to Peak Oil, in addition to the HL model, I remain focused on the four largest producing fields, especially Ghawar & Cantarell.
I think that a lot of analysts are underestimating depletion from the large, old oil fields. Does anyone see much of a future for high water cut fields like the (75% water cut) Prudhoe Bay Field?
BTW, Mexico's production is falling pretty much as Khebab's HL plot predicted.
I've combined the two into one spreadsheet. I've only been able to create an image of it.
http://oilcharts.blogspot.com/
The actual spreadsheet with expandable rows breaks out NGPL's, RPG, and other liquids for the top 30 countries.
Does weird things on my Mac, but it works ...
year 2006 2007 2008 2009 2010
mbpd 85 83 81 79 77
median $70 $70 $70 $70 $70
range ±10 ±15 ±20 ±25 ±30
In a year or so this could look stupid, or not.
No manthingy knoweth the dayze or the hour.
Only Ma does.
Year 2006 2007 2008 2009 2010 2011
Low $67 $65 $65 $70 $80 $95
Mid $70 $85 $102 $120 $140 $165
High $75 $95 $120 $150 $190 $240
However, the real range of probable prices is much wider - I don't consider severe global economic depression or major geopolitical disruption of greater than 5% of global supply in the above numbers, and the likelihood of one or the other of those (or similar) is probably greater than 20%, perhaps even higher than 50%.
My 'scientific' WAG at the average 2010 price if global (all liquids) production declined to 77 mbpd by then - without a global depression greater than the 1930s - is $515.
I am "Renewable Energy" bod for E. Mids CPRE, and used to work in UK elec supply .
Perhaps thi is not the best format, but I'll learn!
COMMENT,NOW.
The UK electricity situation is indeed serious, and Tony's Govt is being very slow to realise - despite yesterday's "new initiative", and nuclear possibilities.
Just now, my "local" power station (Ratcliffe - 2000MW)is shut down due to an accident last May. The problem, or similar ones, could affect more older plant - very serious potential for next winter.
The "free market approach" appears to lead to a precarious future, relying on imported gas! Any nuclear time-scale will be such that fossil fuelled generation(including coal) will be needed for long into the future. CO2, did you say?
Wind power prospects, whatever the planners achieve, simlpy cannot bridge the gap - Govt subsidies must support all watery (tide,wave, dam/barrage, run of river)research, as well as raising awareness of energy saving on a larger scale..................................Brian Newsome
Please contact me. My address is Alan_Drake (at) Juno dott com
a rose colored tint.