Peak Oil Update - October 2006: Production Forecasts and EIA Oil Production Numbers
Posted by Sam Foucher on October 16, 2006 - 11:36am
[Update by Khebab on 10/17/06 at 9:40 AM EDT]I made some corrections in Table I and added Deffeyes forecast.
An update on the last production numbers from the EIA along with different oil production forecasts.
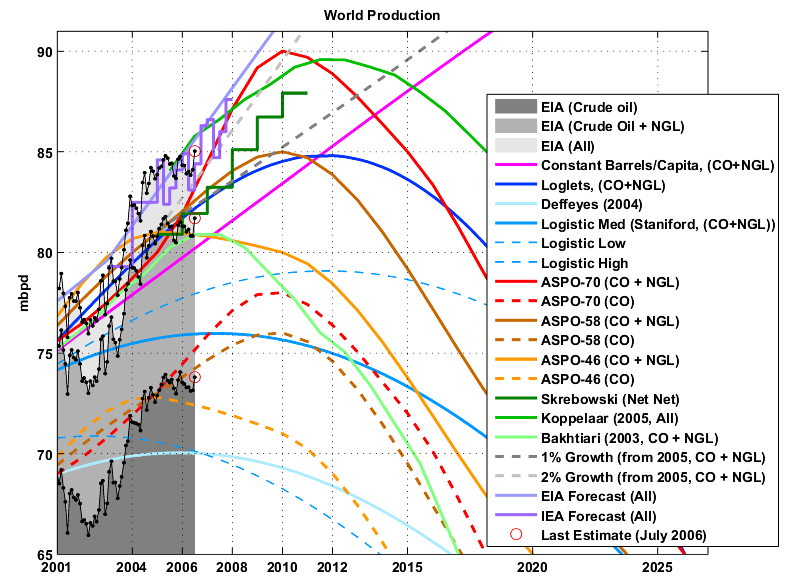
Fig 1.- World oil production (EIA Monthly) and various forecasts (2000-2020). Click to Enlarge.
An update on the last production numbers from the EIA along with different oil production forecasts.
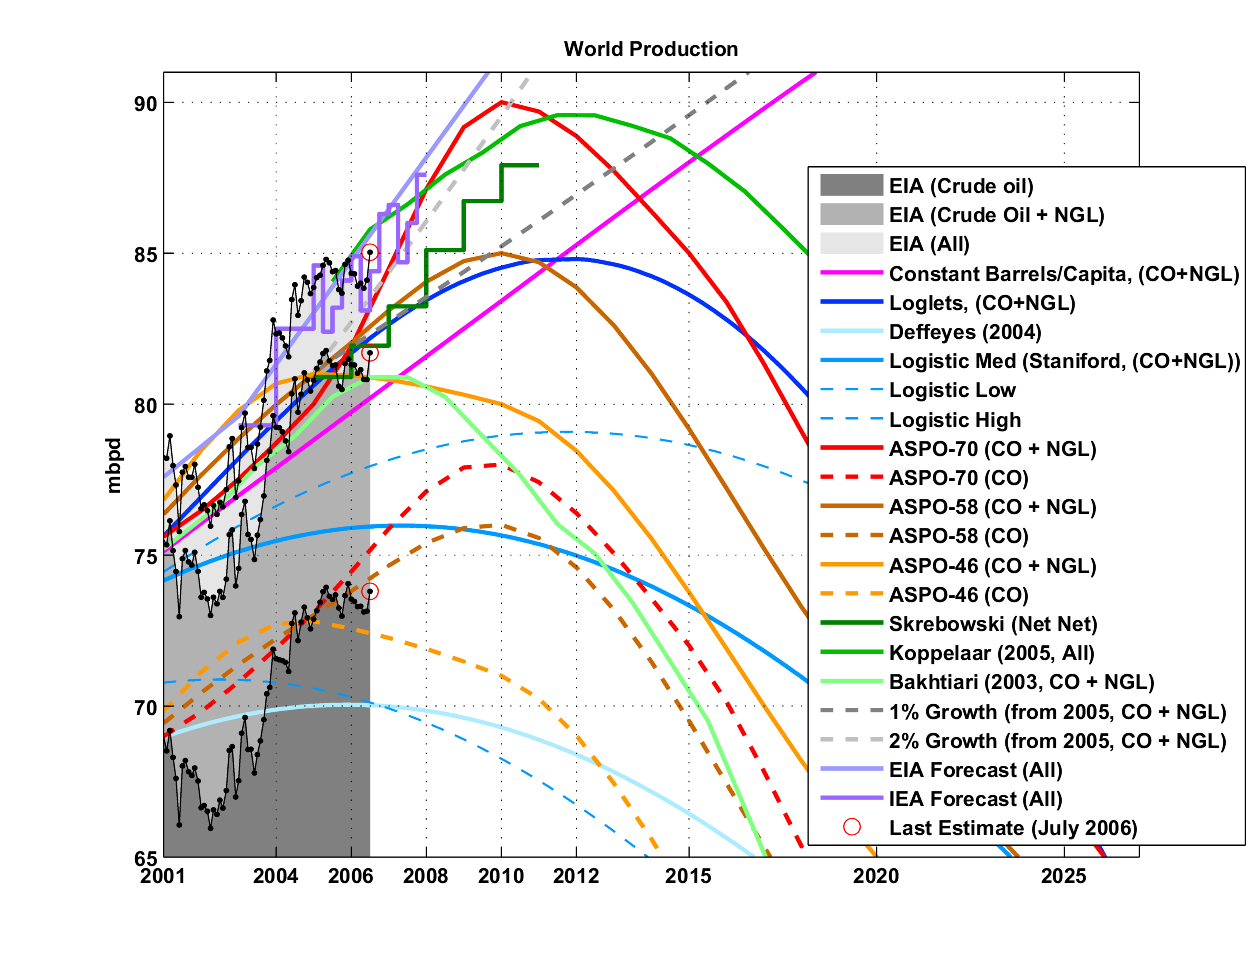
Fig 1.- World oil production (EIA Monthly) and various forecasts (2000-2020). Click to Enlarge.
Data
sources for the production numbers:
Most of the datasets above are compiled in an EditGrid spreadsheet.
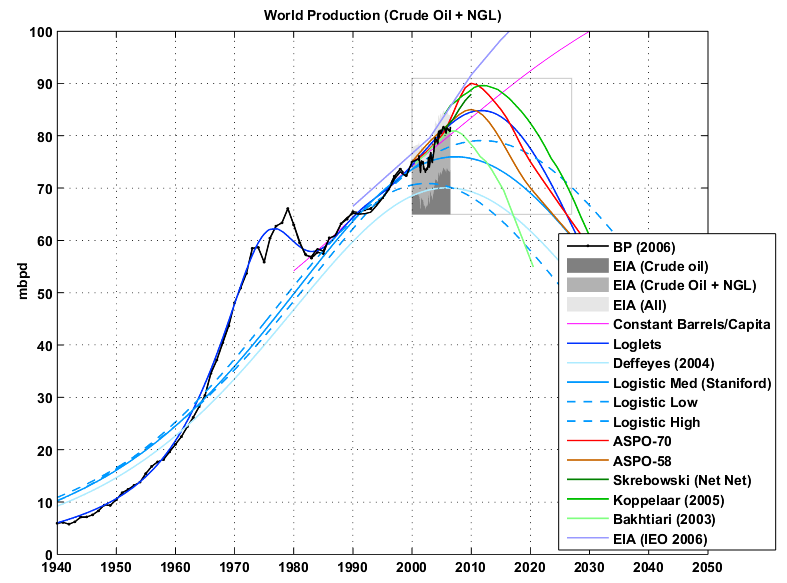
Fig 2.- World oil production (Crude oil + NGL) and various forecasts (1940-2050). Click to Enlarge.
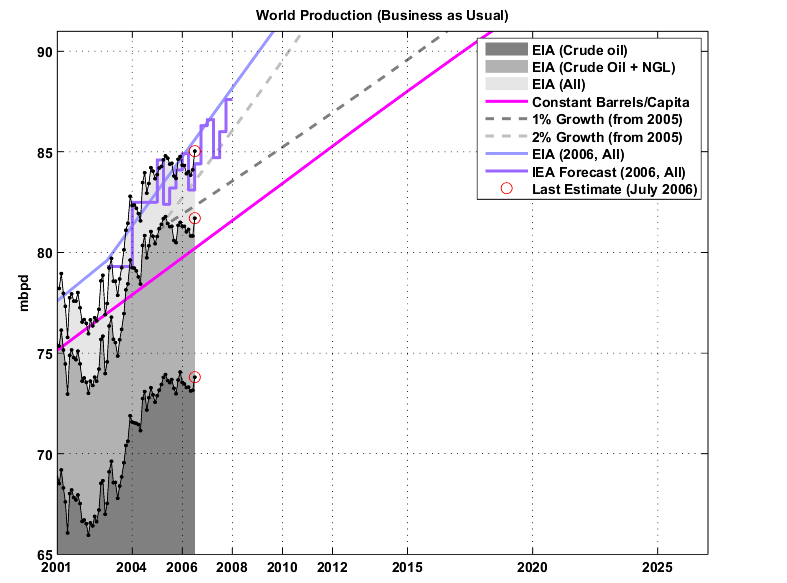
Fig 3.- Production forecasts assuming no visible peak. Click to Enlarge.
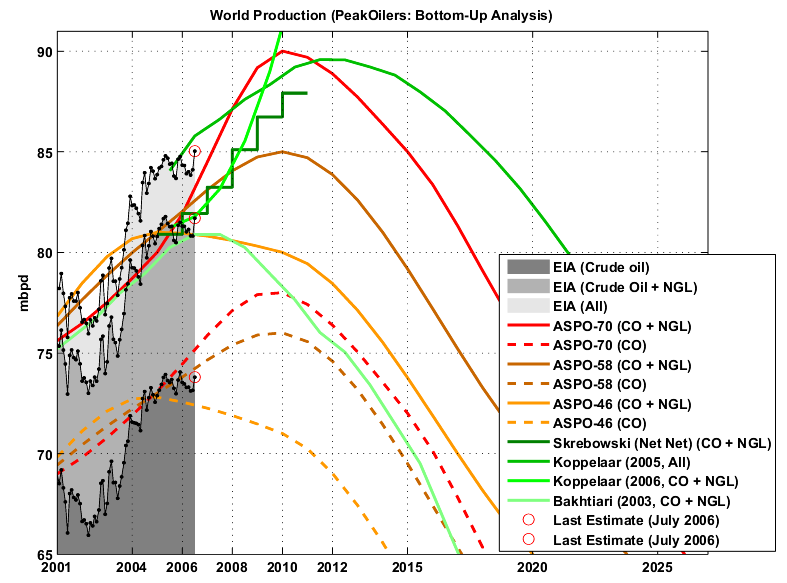
Fig 4.- Forecasts by PeakOilers based on bottom-up methodologies. Click to Enlarge.
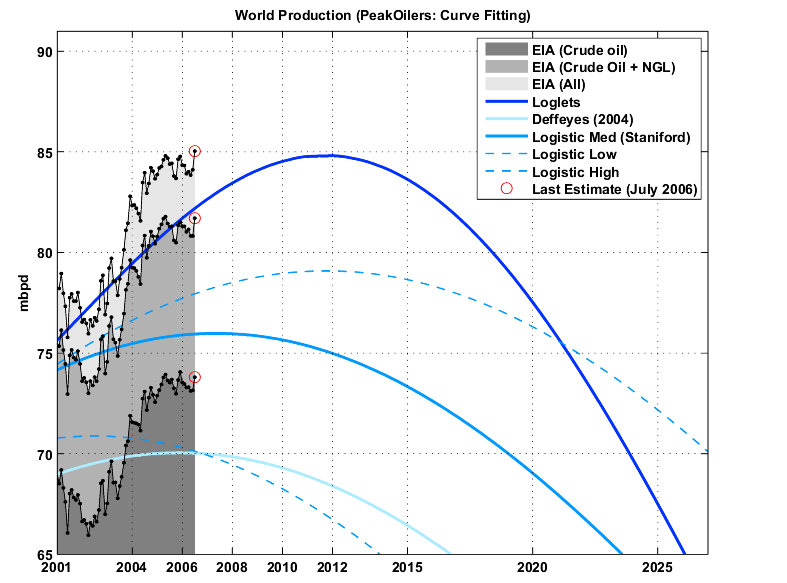
Fig 5.- Forecasts by PeakOilers using curve fitting methodologies. Click to Enlarge.

Fig 6.- Year-on-Year production growth. Click to Enlarge.
Table I. Summary of all the forecasts (figures are in mbpd) as well as the last EIA estimates.
September 2006
- Production data from BP Statistical Review of World Energy 2006 (Crude oil + NGL).
- EIA data (monthly and annual productions up to July 2006) for crude oil and lease condensate (noted CO) on which I added the NGPL production (noted CO+NGL).
Most of the datasets above are compiled in an EditGrid spreadsheet.
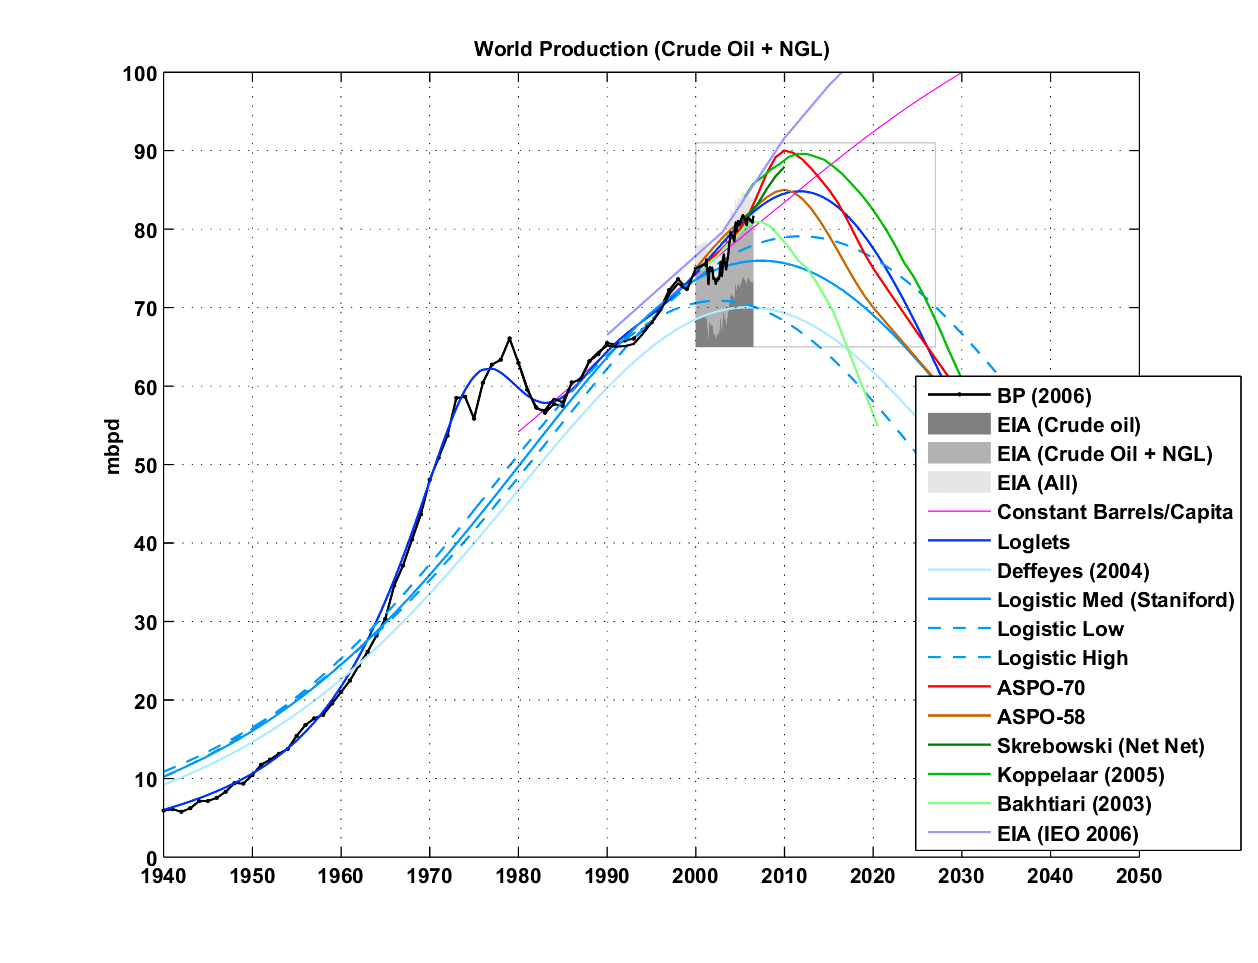
Fig 2.- World oil production (Crude oil + NGL) and various forecasts (1940-2050). Click to Enlarge.
Business as Usual
- EIA's International Energy Outlook 2006, reference case (Table E4).
- IEA total liquid demand forecast for 2006 and 2007 (Table1.xls).
- A simple demographic model based on the observation that the oil produced per capita has been roughly constant for the last 26 years around 4.4496 barrels/capita/year (Crude Oil + NGL). The world population forecast employed is the UN 2004 Revision Population Database (medium variant).
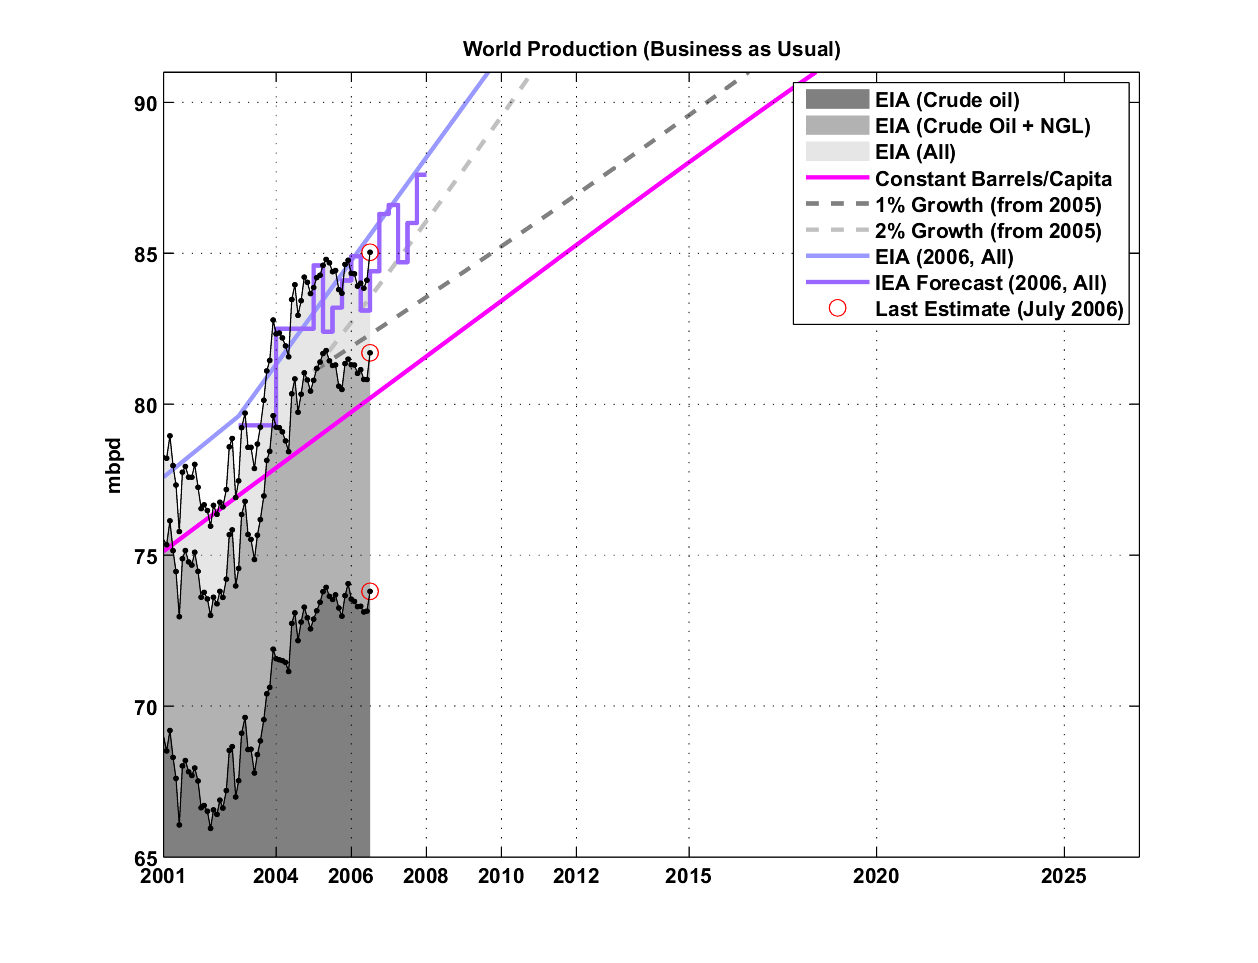
Fig 3.- Production forecasts assuming no visible peak. Click to Enlarge.
PeakOilers: Bottom-Up Analysis
- Chris Skrebowski's megaprojects database (see discussion here).
- The ASPO forecast from the last newsletter (#70): I took the production numbers for 2000, 2005, 2010, 2015 and 2050 and then interpolated the data (spline) for the missing years. I added the previous forecast issued one year and two years ago (newsletter #58 and #46 repectively). There was no revision since August 2006.
- Rembrandt H. E. M. Koppelaar (Oil Supply Analysis 2006 - 2007): "Between 2006 and 2010 nearly 25 mbpd of new production is expected to come on-stream leading to a production (all liquids) level of 93-94 mbpd (91 mbpd for CO+NGL) in 2010 with the incorporation of a decline rate of 4% over present day production".
- Koppelaar Oil Production Outlook 2005-2040 - Foundation Peak Oil Netherlands (November 2005 Edition).
- The WOCAP model from Samsam Bakhtiari (2003). The forecast is for crude oil plus NGL.
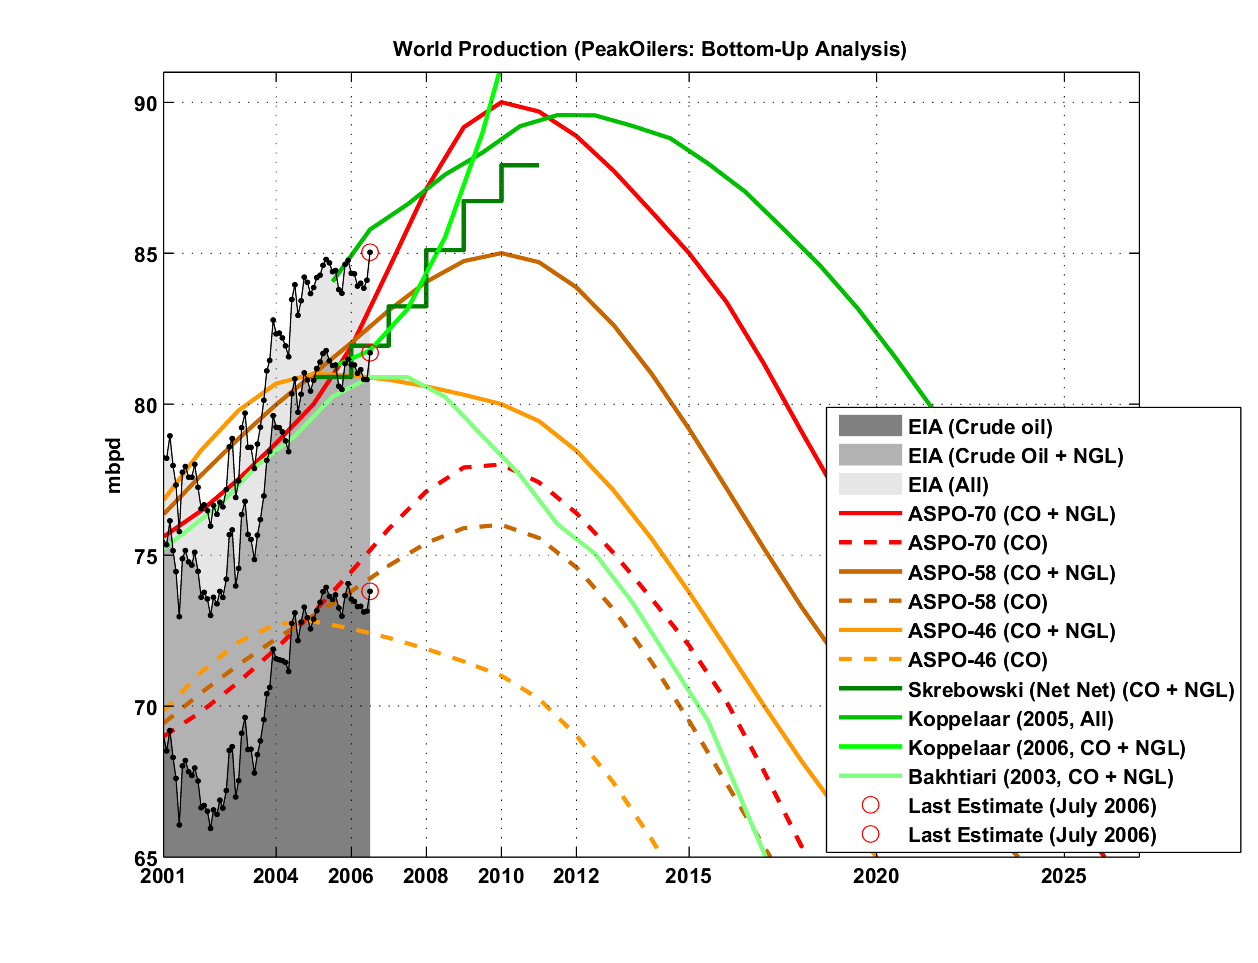
Fig 4.- Forecasts by PeakOilers based on bottom-up methodologies. Click to Enlarge.
PeakOilers: Curve Fitting
The two following results are for Crude Oil plus NGL (CO+NGL) production:- Professor Kenneth S. Deffeyes forecast (Beyond Oil: The View From Hubbert's Peak): Logistic curve fit applied on crude oil only with URR= 2013 Gb and peak date around November 24th, 2005.
- Logistic curves derived from the application of Hubbert Linearization technique by Stuart Staniford (see this post).
- Results of the Loglet analysis.
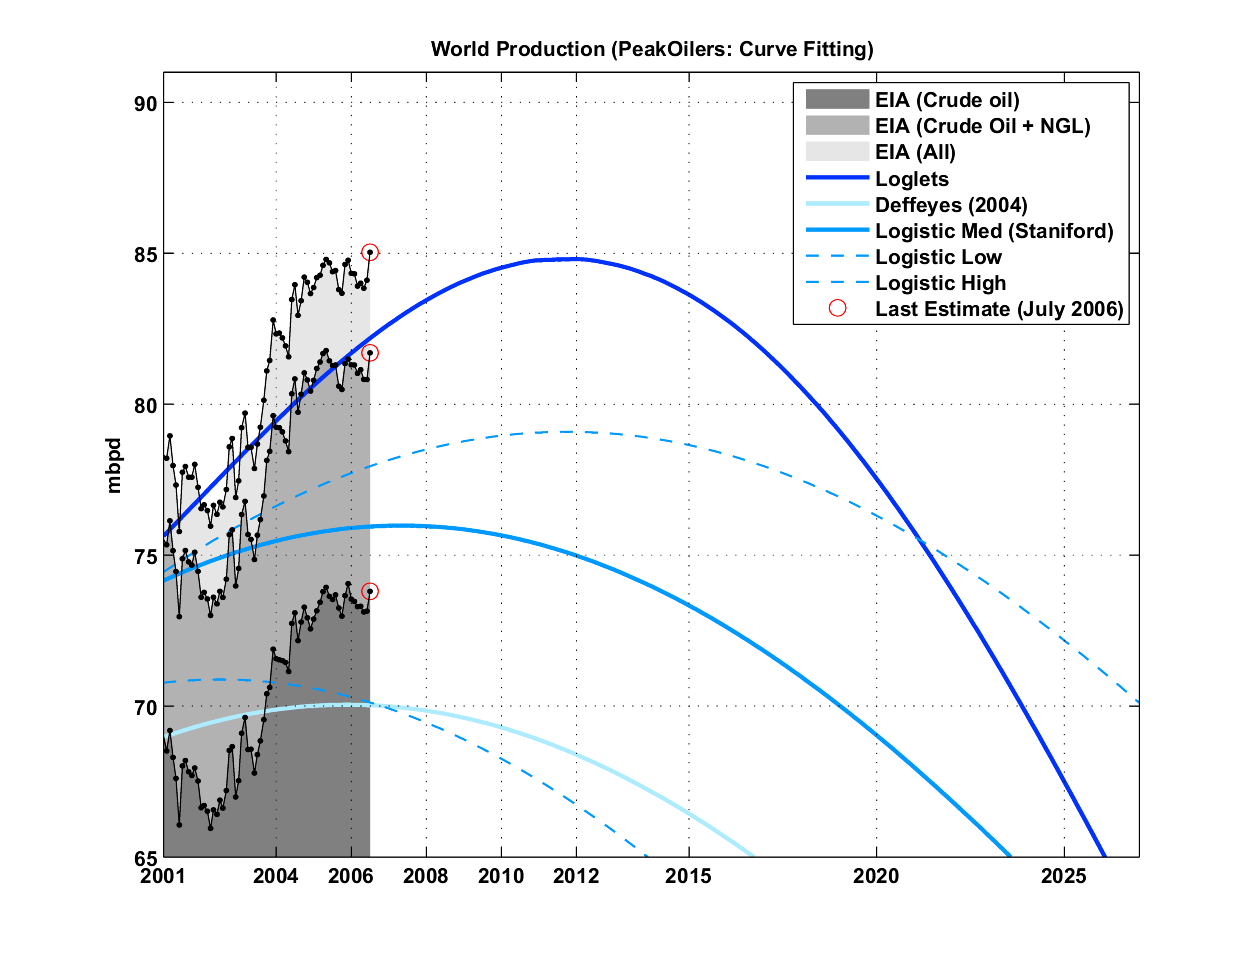
Fig 5.- Forecasts by PeakOilers using curve fitting methodologies. Click to Enlarge.
Production Growth

Fig 6.- Year-on-Year production growth. Click to Enlarge.
| Forecast | 2005 | 2006 | 2010 | 2015 | Peak Date | Peak Value |
|---|---|---|---|---|---|---|
| All Liquids | ||||||
| Observed (All Liquids) | 84.34 | 84.22 | NA | NA | 2006-07 | 85.03 |
| Koppelaar (2005) | 84.06 | 85.78 | 89.21 | 87.98 | 2011 | 89.58 |
| EIA (IEO, 2006) | 82.70 | 84.50 | 91.60 | 98.30 | ? | ? |
| IEA (2006) | 83.38 | 84.40 | NA | NA | ? | ? |
| Crude oil + NGL | ||||||
| Observed (EIA) | 81.23 | 81.15 | NA | NA | 2005-05 | 81.77 |
| ASPO-70 | 80.00 | 81.90 | 90.00 | 85.00 | 2010 | 90.00 |
| ASPO-58 | 81.00 | 82.03 | 85.00 | 79.18 | 2010 | 85.00 |
| ASPO-45 | 81.00 | 80.95 | 80.00 | 73.77 | 2005 | 81.00 |
| Koppelaar (2006) | 81.76 | 82.31 | 91.00 | NA | 2010 | 91.00 |
| Bakhtiari (2003) | 80.24 | 80.89 | 77.64 | 69.51 | 2006 | 80.89 |
| Skrebowski (2006) | 80.90 | 81.42 | 87.32 | NA | >2010 | >87.92 |
| Staniford (High) | 77.45 | 77.92 | 79.01 | 78.51 | 2011-10 | 79.08 |
| Staniford (Med) | 75.81 | 75.94 | 75.52 | 73.00 | 2007-05 | 75.98 |
| Staniford (Low) | 70.46 | 70.13 | 67.92 | 63.40 | 2002-07 | 70.88 |
| Loglets | 81.12 | 82.14 | 84.65 | 83.26 | 2012-01 | 84.80 |
| Constant barrels/capita | 78.81 | 79.73 | 83.42 | 88.01 | 2050 | 110.64 |
| Crude oil + lease condensate | ||||||
| Observed (EIA) | 73.49 | 73.38 | NA | NA | 2005-12 | 74.05 |
| ASPO-70 | 73.10 | 74.45 | 78.00 | 72.00 | 2010 | 78.00 |
| ASPO-58 | 73.00 | 73.80 | 76.00 | 69.50 | 2010 | 76.00 |
| ASPO-58 | 72.80 | 72.56 | 71.00 | 63.55 | 2005 | 72.80 |
| Deffeyes (2004) | 70.03 | 70.02 | 69.11 | 66.07 | 2005-12 | 70.04 |
Table I. Summary of all the forecasts (figures are in mbpd) as well as the last EIA estimates.
Next update in November.
Previous Update:September 2006
Peak Oil Update - October 2006: Production Forecasts and EIA Oil Production Numbers
PDF version
135 comments
Peak Oil Update - October 2006: Production Forecasts and EIA Oil Production Numbers
PDF version
135 comments
“My father rode a camel. I drive a car. My son flies a jet-plane. His son will ride a camel.”
—Saudi saying
Contact
- Content: editors at theoildrum dot com
- Tech support: support at theoildrum dot com
License

This work is licensed under a Creative Commons Attribution-Share Alike 3.0 United States License.
What we mean by this is sending and rating these links at reddit, digg, del.icio.us, /., fark, stumbleupon, metafilter, and the like. Reddit, Digg, and del.icio.us are available up in the little icons under the title. These services only take a moment to sign up for...so please, if you liked this piece, make sure to spend a few seconds and help this information get spread around.
The other conclusion I can draw is that we will peak no later than the 2010 timeframe, assuming we aren't all ready at the plateau. If both Ghawar and Cantarell are collapsing as reported, all bets are off.
"good night nurse," as Archie would have said.
It appears to me that OPEC is becoming increasingly confident that there is no competition out there that could realistically reduce call on their oil to any meaningful degree.
Their population has doubled or more, and they need the money.
They were terrified of Carter's coal-to-liquids project, but CTL is now slowed down by global warming concerns. Corn ethanol can't scale to large volumes, cellulosic ethanol has an uncertain development path, and electrification of transportation will take a little while.
They'll develop eventually, but it will take a little while, and by that time the royal families will be in Europe living on their bank accounts.
They are building refineries because the new oil is so poor in quality that most worldwide refineries can't process it. They don't want to produce oil they can't sell due to worldwide refinery limitations. As you know, we are not building new ones in the US, although they are certainly being modified & expanded. There are significant pollution problems with the sour, contaminated oil which would probably make licensing & environmental regs very hard to overcome here for example.
Alternatives to oil have large R&D and manufacturing plant investment costs, and long lead times. These barriers to entry have protected oil.
Typically, they also have low operating costs. Once built, such plants will stay in operation even if oil returns to a low price. We have seen this with CTL.
More importantly, there are large unknowns in R&D. If a great deal of $ is invested in R&D, and effective & cheap alternatives are found and made to work (such as Eestor ultracapacitors), oil could be displaced surprisingly quickly. Even if we only get the incremental progress that is pretty reliable, next-gen li-ion batteries will likely be competitive with oil in the next 5 years. Once that tipping point is reached electric transportation might actually become better than oil in every way, and oil could be displaced relatively quickly.
We could have astronomical oil prices for 10-15 years, only to have them crash as the growth curve for alternatives catches up with demand and the remaining oil becomes largely obsolete for transportation.
I think the Saudi's know this (though much of OPEC does not), but know they have mostly lost the power to cap prices. OTOH, they still have some power to choose how much prices drop from their recent peak, as supply has caught up with demand for the moment. Even if depletion will kick in fairly soon and raise prices again, it would be in their best interest to let prices crash for a year or so (or as close to that as they can manage) before then to kill off alternatives for as long as possible. I think they aren't doing so because they want to maximise revenue for the short-term, to make their citizens (and other OPEC members) happy.
Or maybe they're not that smart. Yamani (SA's oil minister in the 80's) knew this stuff...
Not so. Oil can be replaced relatively easily with electricity.
Let's review the background. First, electric vehicles are about 8 times more efficient than your average gasoline vehicle (1,600 watt-hours/mile vs 200 whrs/mile). Second, there is no real threat of electrical shortages: the articles you're thinking deal with peak supply/demand and lack of investment in infrastructure, rather than shortages of energy supplies. There's plenty of excess capacity during off-peak times: the average utilization of the US grid is less than 50% (440GW average vs 905 peak capacity). Oil & Gas supply only 21% of US electricity, and can be relatively easily replaced with wind (preferably) and coal.
The average demand in the US is about 440 gigawatts (GW), and to replace all 210M light vehicles (cars, SUV's, pickups, etc) with electric vehicles would require only about 57GW, or an increase of 13%, which could easily be done at night with excess capacity, and largely from wind power.
Electricity is the easy part, and is much cheaper than oil ($.02/mile, versus $.10 per mile for gasoline). Replacing oil as a portable source of transportation energy is the hard part.
I like the Tesla too.
I think of hybrids as the vanguard of the movement to electric vehicles. The drivetrain of hybrids like the Prius or Escape are roughly 40% electric, despite the fact that the original source of their electricity is gasoline. With 1.8% of the market, that means that the market is already about .7% electric.
As hybrids grow, and plug-ins are introduced, the light-vehicle market will gradually transform, and as batteries improve the EV range can expand.
The nice thing about these hybrids is that in an emergency they could be upgraded to plugins quite easily, thus greatly reducing the 20 year adaptation window assumed by people like Hirsch. I wish the US would break past it's current paralysis (in part due to the current Pres. administration) and greatly accelerate progress, but fortunately we are moving forward with some kind of noticeable speed.
Are you in PG&E's service territory? I understand they're installing time of day meters in the next year or so - are they going to do that for you? I would think that would help with making PV pay, as you would be able to sell power to PG&E at a high rate during the day, and charge an EV at night at much lower rates.
"However, the spare capacity, as I understand it, includes hydro, natl gas and other generation that really can't sustain an all out 24/7 production."
As I noted previously, I don't believe there's a real danger of the lights going out Mad-Max-wise, as there's always coal (and nuclear in the longer-run) as a last resort. California is an interesting case, as it has made a policy decision not to use coal, and therefore uses gas for about 50% of it's power generation. It does have a little nuclear, which gets more important at night. In the following discussion we have to keep in mind that during all the acrobatics CA will go through to deal with electrical generation that coal will still be there as a last-resort - I don't think anyone can realistically believe that CA would not use coal & nuclear if they were the only choices to prevent serious, long-lasting blackouts.
As far as off-peak energy production goes, you're right, nat gas turbines aren't really meant for base-load production. Wind is the clear answer. Texas just passed CA for windmill installation, but I expect CA has a fair amount in the planning process, including a lot of replacements of older, small inefficient turbines. Altamonte is an important site, which unfortunately has real bird problems (realistically the only site in the country to have such problems). I suspect some wind power from mid-west states, and West Texas might go all the way to CA.
One possibility for CA are offshore floating windturbine structures , which are based on proven oilrig technology but still in development. They'd reduce costs, raise reliability, take care of visibility problems, and I suspect could be sited to solve the heatwave peak output decline problem. Another is kite-based windturbines, which I believe will be faster to install, can take advantage of stronger & more reliable high winds, and have reduced structural costs - they're still in R&D, though, and more speculative.
Peak power is a little more difficult. On-shore wind in CA may only provide about 15% of it's normal output during serious heatwaves. In the longrun solar is the obvious complement, as it's at it's best during such heatwaves. I understand that CA is hoping to get about 5-6% of it's peak power from PV over the next 10 years (3GW vs 50GW peak capacity). Here it's important to remember that PV prices are artificially high right now due to soaring demand and subsidy programs; that underlying PV costs are falling quickly; supply is ramping up; and building integrated PV will slash Balance of System costs, so eventually PV consumer pricing will fall sharply. . Also, there's pretty good indication that the A/C peak demand is pretty artificial, and could be seriously reduced by time-of-day metering and other demand management programs. Electric vehicles will help a great deal here, with planned charging and even Vehicle-to-grid peak supply.
CA is likely to have some difficult times coping with nat gas depletion, especially without using coal. The energy is there, but they'll have to move fast to take advantage of it. In the meantime I suspect electicity imports to CA, and rates, will go up.
Thanks very much for your post. It's nice to see people actually think these issues through with real numbers.
I've come to the same conclusions based on these calculations. It's great to get these independent confirmations.
But it's very nice to hear that it makes a difference to people.
Interesting to see again how Colin's projections are the most optimistic up to 2011. But note that for Crude solely his curves are very close to the real thing (especially on the ASPO-58 model).
Also very important to note is the plateau in Crude production since mid-2004. When will it go over 75 Md/d?
Does anybody know what liquids are on the non-Crude non-NGPL group?
Khebab, I think there's a major modeler left out: Laherrère. Would it be too much to ask you to include his curves in November?
Agreed. The big change in the ASPO forecast (between #70 and #58) seems to come from a NGPL increase. Bakhtiari's projection is the oldest and fairly accurate so far.
Re: Does anybody know what liquids are on the non-Crude non-NGPL group?
from the EIA website:
Re: Khebab, I think there's a major modeler left out: Laherrère. Would it be too much to ask you to include his curves in November?
You're right, I just didn't have time to include his last forecast. It will be included in the next update.
You are slowly moving mountains here at TOD.
Ron Patterson
But mostly, thanks again for your efforts.
Campbell has some simplistic modelling of NGL's that does not account for real growth in world natural gas production, and that does not include that naturgal gas from mature fields normally becomes "drier" with time.
That is the GOR (Gas Oil Ratio or Gas NGL Ratio if you prefer) normally increases with time for natural gas fields, thus less NGL's from the same amount of natural gas.
Modelling NGL (NGPL) is in my opinion a very challenging task.
But I can briefly share with you all some of my experiences and observations on NGL's.
REGIONAL DEVELOPMENTS
In the Norwegian (and most likely the UK) part of the North Sea owners normally prefer to develop the richest natural gas field first. There are of course exceptions to this (rule) depending on availability to infrastructure to transport natural gas to buyers etc..
Richest gas fields are those with a low GOR (Gas Oil/NGL/LIQUIDS Ratio) and these developments usually use recirculation of some of the natural gas to increase initial NGL/CONDENSATE recoveries. Thus the initially GOR will tend to be quite high and then decrease (quite rapidly) with time, the natural gas becomes "leaner" or "drier". The reason for developing the richest gas fields within a region first, are of course that these will give the highest return on the investment, ref. "The Law of Diminishing Returns".
What Campbell/ASPO has done is using the GOR (based on historical EIA data) for US (North America) and applying this to the rest of the world, and further that growth in world natural gas production follows the "base case" forecast from EIA in their International Energy Outlook. This is very simplistic and reflects a poor understanding of natural gas and NGL's, which thus becomes the source for "misleading" NGL forecasts by Campbell/ASPO, to put it mildly.
1) EIA NGL (table 1.3) data lists Saudi Arabia as the worlds biggest producer of NGL's having around 19 % of world NGL's production, 2005 data. Using data from BP Statistical Review, Saudi Arabia had approximately 2,5 % of worlds natural gas production in 2005.
This suggests that there is a substantial NGL production in Saudi Arabia from what is classified as oil fields. On NCS (Norwegian Continental Shelf) several oilfields also has some associated NGL production.
2) Russia, presently the world's largest producer of natural gas, and growing, is reported by EIA (table 1.3) to have a declining NGL production. This suggests drier gas is being produced from Russia. Data may of course be subject to future revisions.
3) USA is reported by EIA (table 1.3) to have a declining NGL production (natural gas production is also declining). The interesting with US NGL production is that presently the processing margins are very good, which gives a good economical incentive to recover as much NGL as possible, and despite this the NGL recovery continues to decline.
Some time ago when natural gas prices were relatively high (relative to oil on a Btu basis)) producers got better paid for leaving some of the NGL's in the gas, and selling it as natural gas instead of recovering the NGL's.
4) EIA data on NGL's (table 1.3) shows that world NGL production had a high of 8,0 Mb/d back in February 2005 and has since been declining, and was 7,9 Mb/d as of July 2006.
Data may of course be subject to future revisions, but presently it looks very much as if world NGL's production is running pretty flat. A diagram in this post http://energikrise.blogspot.com/2006/08/utsikten-fra-et-unikt-plat.html illustrates this. (Scroll down a little).
5) World natural gas production has seen some healthy growth in recent years and North America and Eurasia (Europe and the countries of the Former Soviet Union) produces about two thirds of the worlds natural gas. Most of the reserves are in Russia and the Middle East.
Natural gas production in North America is declining, and the annual report for Gazprom (for 2005), shows an expectation of a modest increase in natural gas production from Russia towards 2010, and production in Europe with the exception of Norway is declining. Norway's increase in production will not be able to fully offset the expected declines in natural gas production from other European producers (like UK, Denmark, Germany). All of this gives a picture that the regions presently having two thirds of the world's production of natural gas, at best, will stay flat towards 2010.
That leaves near future growth to come from the regions presently having one third of world's production like Africa, Asia and Pacific, Middle East and South America.
In South America gas production in Argentina, largest producer in South America is expected soon to enter decline (thus reducing their exports to Chile and other neighbours). Venezuela has according to official sources the largest gas reserves in this region, but has presently little or no exports of natural gas. In other words there should not be expected much growth in natural gas production from South America in the near future.
This leaves all of the near future growth to come from Africa, Middle East and Asia and Pacific, which will grow.
Given the lead-time and investments needed to establish infrastructure from the most prolific regions (Middle East with most of the "stranded gas") it is hard to see that this is presently happening, thus growth from this area will have a hard time to fill the gap for world growth in natural gas production.
Natural gas used for GTL (see below) should in my opinion be counted as liquids, as this natural gas will never enter the market as natural gas.
Based on the description above it should be expected that future growth, towards 2010 - 2015) in world natural gas production will be very modest.
6) Campbell/ASPO has in one of their newsletters (from Jan/Feb 2004, if memory serves me right) described increased liquid recoveries from natural gas by GTL (Gas To Liquids; Fischer-Tropsch) technology (which I don't know is included in the NGL forecasts made by Campbell/ASPO).
By including liquids from GTL Campbell/ASPO fails to recognize that GTL is a conversion process by which methane (CH4) is converted to liquid fuels.
GTL is, as most TOD readers are aware of, a very energy and capital intensive process.
From the brief description above I expect worlds NGL's production to decline, if it hasn't already.
So far I have not seen any detailed analysis for natural gas/NGL's performed and published by Campbell/ASPO, and until they produce such a document/an analysis all their projections for natural gas and NGL's should be looked upon with a healthy portion of scepticisms.
Should Campbell/ASPO have some credibility for representing ASPO (The Association for the Study of Peak Oil and (natural) Gas), the least they could do was to produce more documentation in the form of detailed studies (and analysis) for future development of world production of natural gas/NGL's.
I have some diagrams for Norwegian gas fields (based on historical data from NPD (Norwegian Petroleum Directorate) illustrating this.
If you are interested you may reach me through the following E-mail address:
nrgyman2000 at yahoo dot no
and I could E-mail you some diagrams in JPG/GIF format.
Best rgds
NGM2
By including liquids from GTL Campbell/ASPO fails to ....
should read
By including liquids from GTL as NGL's Campbell/ASPO fails to.....
No, horrifying was that giant ditch you see from 1978 to the mid 1980's. Right now we are where I can recall us being then, right in the center of the storm, with so much "noise" in the stats that nothing can be clearly seen.
Remember that OPEC keeps saying they fully intend to turn the taps back a bit more, just for insurance, while at the same time they are spending billions developing difficult fields in remote regions of Saudi Arabia, and getting into offshore in a much bigger way (what a dream place for offshore by the way, shallow protected water, always sunny climes, it makes the North Sea and the Gulf of Mexico seem like something right out of Dante's Inferno by comparison!)
Let's stop for a second: Why Saudi Arabia do that? Talk cut, but at the same time, spend on development? Could it be that they want "their price" and know that if Canterell is flat or declining, the North Sea is known to be declining, Bergen in Kuwait is known to be declining.....yeah, peak or no peak, I am sure you will see the production side come down some, as Saudi Arabia, Norway, and even Mexico and Canada fully intend to get the maximum price they can get.
Folks, we will be bled to death either way. The march away from oil must continue, and will, and must speed up and will. Frankly, the production numbers are meaningless, and tell us nothing about the bigger geological picture, just as they did not in 1971, 1973, 1979, 2001, or now. Our fate was sealed at the first one, in 1971, when we lost control of our national energy destiny. All the rest has been a long formality.
Roger Conner known to you as ThatsItImout
I read a fact this morning that is related in a round about way. In march 01 only 5% of polled economists said we would enter a recession in the coming year. 5% mind you. 20/20 hindsight said they were already IN IT! Here's my point. There may be 5% of us in the country who see PO and within that 5%, many would argue for the peak now - 2010 or so. Sadly, I have concluded we are the canary in the coal mine. As Rockhound in the movie Armegeddon says, it sucks being right.
http://www.editgrid.com/user/graphoilogy/Oil_Production
It's not completely up to date but it will be in the next few days.
I would say that it's all about the depletion rate in mature oilfeilds. For instance, Rembrandt Koppelaar is assuming a depletion rate between 4 and 6%. At 6%, net supply will increase only by 445 kbpd for 2007 compared to 2005.
http://www.editgrid.com/user/graphoilogy/Oil_Production
You can get that site to export it to Excel or a variety of other formats.
I wonder if similar work could not be done for consumption.
Sort of a global version of West Texas's export land model.
I think that changing consumption patterns china in particular is sufficient for the Western countries to be post peak relative to available oil. In short did the US consume less oil this year than last ? Thus China/India consumed a higher percentage of the worlds resources then they did last year and if it was greater then production then from the US perspective the peak has happened solely from changing consumption patterns. So have we passed peak consumption yet in the US ?
Basically if we have really peaked you will see consumption decline slowly in western countries as they become more efficient then next in China/India as they are priced out of the market. And of course crashing consumption in Africa and other third world countries.
We hear that third world consumption has dropped significantly but I've never seen any proof of this.
In any case initial efficiency increases/demand destruction will delay the massive price runup when supply cannot meet core demand.
So knowing the consumption pattern is pretty important.
One indirect way of seeing a drop in oil-product consumption would be to watch for deforestation in the 3rd world. (visable via public satillite pictures)
The mantra for a number of years was 'stop cutting down your trees for cooking fires - use these oil based cookstoves'.
I think deforestation will be one of the worst aspects of peak oil. Coupling massive deforestation with current global warming is the one thing I really fear.
Also note that the seas will probably be fished out under these conditions and we could be facing a major extinction.
We will see.
I don't think we will be very effective at eradicating marine life by fishing, except the larger species. Pollution is more of a worry, then, unless we find a way to trawl for plankton and make food out of it.
Plant and animal species take 100,000's of years to optimize to environments. Gene flow takes longer than 500 years to occur. The food web has become mighty thin in many places. This happens now locally but few care or even notice if it doesn't impact their lifestyle (examples, ocean reefs, forest communities, U.S. fresh water ecosystems). This is why global warming is such a problem. Change the temperature by 2 degrees C in temperate areas for multiple years in a row and you are liable to destroy half the plant and animal life there in a few decades.
Not an experiment I want to run on a global scale. We are in the "Land of unintended consequences" when man alters ecosystems.
In rich, industrialized nations, if prices were to double again, I suspect there will be some demand destruction but not demand collapse. What will happen in China, India, Malaysia, Africa etc etc if prices double again in, say, the next 2 years? Could demand drop precipitously? I don't have a solid basis for predicting this--- does anyone else have a better handle on it?
In the U.S., most people already have vehicles that are completely integrated into their lives and most will remain capable of filling the tanks when prices double. Sure, China is a large and collectively powerful nation, but a relatively small (albeit growing) percentage own vehicles that cost a large proportion of income. We always talk about the importance of growing Chinese demand in the peak oil scenario. Could that growth be cut off at the knees if prices rise substantially? Or will Chinese state foresight in gleaning contracts with oil producers ameliorate the impact?
Oil exporters don't mind taking dollars and using the dollars to buy the goods they need, mostly from europe and asia. The question is, how long will they continue selling more oil than they need to finance their imports? How long will they continue to think that dollar denominated securities are a better long-term investment than their (depleting) oil?
We urgently need the various despots to stay in power because our interests are aligned - they need an excess of dollars to transfer wealth out of the various opec countries, and we want them to continue accepting our paper in eachange for oil. A conversion to democracy would be a disaster unless, of course, we are referring to the corrupt version that would merely change the numbers on the swiss accounts receiving excess oil revenues. It may be assumed that regional democracy was not the reason why we invaded Iraq.
Thinking that all they make is of poor quality is refusing to see what is happening, not just there but here, too. The US has slipped from the #1 exporter not just because of high wages - german wages, and I think japanese too, are quite a bit higher than US wages, even union ones - but because of often shoddy workmanship. Note that, while apprentice programs are still fairly plentiful in Europe, they are non-existant in the US. Our best cars are not make by US companies but by Japanese transplants that make quality the most important thing. Maybe our best hope that they will face high quality US competition will be from future chinese ones.
What do we have that others want besides planes and guns? ANd, boeing's current renaissance may be short lived... first, we are making major production sharing agreements with asians, including 'low quality' chinese, and second, most at tod think planes do not have a bright future. Luckily, there will always be guns.
Famous last words...
Nothing to do with China in particular, but it is more American consumers unending appetite for inexpensive consumer goods. Walmart has spearheaded the effort to move production overseas, and they keep pushing Chinese suppliers to further cut costs. Under these circumstances, I have a hard time seeing how you will get anything but crap on the shelves here in the U.S....
Paris Hilton and Windows XP - now that's quality :)
You're not looking in the right places. For example, about 70% of the worlds photocopiers are manufactured in the city of Shenzen, but they are sold by companies like Minolta and Samsung.
This is how Samsung describes Shenzhen:
Shenzhen is a base for researching, developing, manufacturing, buying and selling computers and parts, telecommunications materials, audio and video products, leisure and electronics goods, and bioengineered products. Around 3,000 companies are here making all the parts used in computers, not counting the semiconductor chips. Each year, more than 30 million computers are assembled in the Shenzhen zone. The color TV and computer production volume at Shenzhen is the highest of any Chinese region. Over 80% of all the program control exchangers that are made in China come from Shenzhen. The area is ranked third in China for hard disc drive heads, and software exports from Shenzhen have led for the past five years. Shenzhen also produces 30% of all the Chinese mobile phones. Machines and appliances represent another major sector at Shenzhen, For example, 80% of all Chinese color photocopiers are made here. Shenzhen ranks first in Asia in the production of plastic-making machines and the world's largest producer of shipping containers and digital watches. Shenzhen leads China in the plastics, fashion, precious metals and printing industries.
Democracy only started to be heard at the same time as demands for an exit strategy.
Of course the situation would have been completely different if Iraq didn't have oil. But the US didn't invade Kuwait. If the US sought to gain greater access to Iraqi oil, wouldn't it have made more sense to negotiate big contracts for US companies in exchange for reduction of sanctions? And would you claim that the reason France and Russia opposed the war was not "because of oil"?
The US war in Iraq has been a travesty, but the reasons for it are complex and can not be waved away by petty sloganeering.
We may never know the whole truth, but we owe it to ourselves to do better than vapid and threadbare one liners.
As for the sheer incompetence of the Bush League - well, I don't have an answer for that, but sure, in hindsight, smash and grab (or was that shock and awe?) was a lot dumber than dealing with a dictatorial regime (like our good friends, the House of Saud), but then, greed for power and money is pretty well known for making people act like idiots.
As for who invaded Kuwait, that was Iraq - to protect Iraqi oil interests, according to the Iraqi government at the time, as they accused the Kuwaitis of drilling into and pumping oil out of Iraqi territory. At least that excuse for invading another country can be understood - unlike any reason currently offered by those who planned and executed the invasion of Iraq this time round (though as the current president of the World Bank said several years ago, from a bureaucratic perspective, WMDs were convenient as an excuse). Even better, it looks like the Iraqis hoped to pay off their crushing debts (from the Iran-Iraq war) using other people's wealth.
Why it is so difficult for people to understand the central importance of oil to countries that require oil for their economies to function (either as consumers or as producers) escapes me.
For fun, look at WWII, and many of the major sea and land campaigns. The Germans, for example, weren't sending U-boats to the places like Trinidad because the weather was nice, and Rommel wasn't tooling around in the desert because sandboxes are fun to play in, Ploesti wasn't a central strategic target because vampires lived in Romania, and Stalingrad wasn't fought over because of its name. And these battles are carefully picked for being roughly in the same time frame (1942/43) - that is, when the Germans, not being able to either cut their enemies' oil supplies nor secure their own, began their slide to total destruction.
I find blood for oil trite too, by the way. Though again, in WWII, the Japanese found oil and steel a reason to attack Pearl Harbor. Though since Hawai'i has neither oil or steel, I guess the reason for the Japanese attack must have been for love of the Emperor and world peace, or because America had been flouting international treaties, or because Roosevelt was a dangerous socialist, or ....
If we wish to continue beyond one liners, check out where Grozny sits in relation to a few pipeline routes, and then ask yourself why Grozny was flattened, and then ask why the EU has nothing much to say about the whole thing. Then we could hop on over to Columbia, with a skip in Sudan (don't want to leave out the world's second largest oil consumer, even as they struggle over the scraps).
Decency and oil seem to mix about as well as oil and water.
Of course the predominant reason for the disproportionate involvement of the US in the ME is oil. But it doesn't add any information to extend it to say every action by every external participant in the region is because of oil.
So, yes, the US attacked Iraq because of oil. The US didn't attack Saudi Arabia because of oil. France opposed the US attack because of oil. All true, but not particularly profound.
Your explanation above is far more useful, but still doesn't provide a ditrect casuse for the Iraq wars, first or second. Japan went to war with the US, in part because the US threatened to directly cut off supply oil (and other resources).
Iraq possessed oil and threatened to break loose from a constraint mechanism that the US and other powers put on it. In part the US feared that this would destabilize the region and threaten future oil supplies. There are other reasons, but this does seem the big one.
I didn't mean to pick on you in particular for the "oil is the reason" issue. In fact, I may have chosen to speak up this time , rather than the hundreds of other time this has been posted, because I know you are much smarter than that silly little slogan. You know history and can see the deeper meaning that oil is a root cause for attention that the big powers give to the ME.
But for most people, I think "Blood for oil" and similar chants are an easy way to oppose the war without doing the hard work of understanding what it all means. Sort saying "I don't need to think because I have this catchy slogan that someone else gave me. So, if I just oput the bumper sticker on my car, I am clean of any war related guilt."
I was also in a mood to use the words words banal, vapid and trite and so couldn't resist the opportunity.
The 9/11 attack caused the Iraq invasion, but there was no reason for the invasion of Iraq, it just followed on from the 9/11 attack without any particular logic or reason.
Our self interest does not necessarily lie in getting rid of dictators, no matter how brutal.
How come in practically every article that I see around peak oil and various projections for the year of peak that even though there seems to be some kind of general agreement that Deffeyes peak date of Fall 2005 may have been right and the actual figures seem to support it, that the vast majority of people seem to talk about the peak date being in the future between now and 2010 or even 2012?
Article after article seems to completely ignore the peak date of 2005 and what's more I noticed that 3 or 4 years ago, within the peak oil community /websites, 2010 was scoffed at as being too optimistic, but now it does not seem to be. It's like as if D-day is always just 3 or 4 years away into the future but never now. And so as time has passed on, the date has been nudged forward.
In fact I see the exact same process happening with all things to do with the environment. The general message is, whether it be mass extinction, destruction of the rainforest, collapse of fisheries or global warming, is that things are bad BUT there is still time left to make changes.
Well I just don't buy that. I see it either as some human trait that just can't let go of hope and continues with denial right up to and into disaster. In all of the above cases I would see that it is already too late. Much damage has been done and much has been permanently lost. But we continue to fool ourselves that we can somehow fix things. Lets look at it this way, the Dodo is extinct. It's gone and so have thousands of other species we hardly ever knew the name of. And they ain't coming back.
And so its the same with peak oil dates. By this process of convincing ourselves it still in the future, we can still entertain our fanatasies. Its like as if there is some hidden thread that says; yes peak oil will be a turning point and there will be lots of bad surprises, and then things like NGL liquids or some deep water oil field comes online to make it all last a bit longer and there is some kind of sigh of relief. Also all the projections take the blightly view that on the down slope that we will happily use up all the remaining oil. In this is implicit that since there will still be significant quantities of oil available there is sort of the carrot put out there, that even we are clever enough, there will be enough oil still around to get around this problem.
There is not a mention of how this (issue) is very much inter-related with global warming and if we are to get serious about it, then we should NOT even attempt to burn anymore of the remaining oil that is left. If that step is not taken, things will be very much worse on that front. I recall about 20 years ago when the global warming debate arose the questions were basically is it possible, but if so it will obviously be only the mild warming of 1 or 2 degrees. Now I see (correct me if I am wrong), that not only is it happening, but the mild warming is a given that it will happen no matter what happens now, and there seems to be a general acceptance of the medium case of intermediate warming with plenty of worry about the worst case of up to 5 or 6 degrees. But again we see the same phonemena of that we still have 10 or pick your favourite number years left to revert this.
Again apologies if this distracts from the main work gone into the article above.
-Terence
And while I personally think Deffeyes is likely right, it's too soon to say for sure. You only see the peak in the rear view mirror.
This bump up "estimate" could be revised downwards later, it could be a one month abberation -- OR, it could signal the onset of a huge surge of offshore oil that Campbell and Skrebowski have been anticipating.
Without it, Deffeyes is correct on Dec '05. If it is an outlier, he would still get the credit. If the numbers continue going upwards, then perhaps offshore oil really will cancel onshore depletion for awhile.
Any comments?
However, I suspect the July number will be revised downward. Seems like all the estimates are later revised downward these days.
In talks I say "between last year and 2012", but in private I always say it's a done deal.
I think that it is simply getting harder to track new production because it's coming from a large number of inreasingly smaller projects. Production of crude oil seems to get flatter and flatter with time, the EIA cumulated revisions are almost always downward for crude oil by almost 300 kbpd in average( see my previous story here).
Terence - Important points. Thanks for sharing. I assume that you, like myself, are not an expert in the oil business. Many contributors here are, obviously, but we layfolk still have something valuable to contribute as well. They provide the foundation, we can 'flesh out' the ramifications.
As far as 'The Date'. AFAIK, we have not surpassed Dec. 05 in production. But it's close. 'Bumpy plateau' is generally accepted. There just isn't enough precision to know - both unitntentionally and intentionally. There is also the issue of geologic peak vs. (what are we calling it...?) functional peak. War in Iraq, unrest in Nigeria, storms in the GOM, all serve to 'artificially' limit production. For example, what if geo. peak passes during a time of 'artificially' limited production. In that case, no one will know for some time...
I find a valuable way to divide informed from uninformed discussion of these issues is by how they address just those issues you've raised. Also the running out vs. decline issue. Most commenters here agree on some basics - decline is not the same as 'running out', peak is here - or near - but we MAY increase production a little, and won't know except in hindsight.
As far as the environment, you say: "...continue with denial right up to and into disaster...". I think that's about right for many humans. We cross threshold after threshold and just keep moving the bar. Overshoot is not a theory any more than gravity or peak oil.
One thing we do is substitute a less diminished resource for a more diminished resource. Dropping trophic levels to consume lower on the food chain. The damage mounts but life goes on in a relatively normal manner. Environmental damage (change) is subtle, sometimes, and life is persistent. Another factor is that we ravage things out of our sights. Our neighborhoods don't change much, just distant places... Ask some old-timers and they can really sense change.
Human nature (*warningwarning*) doesn't do long-term well (a common discussion here...). As far as the climate goes, it's complicated stuff. I HATE to quote Rumsfeld (sp.?) but... there are knowns, there are known unknowns, and then there are unknown unknowns...
Seeking out the relatively well-accepted known knowns of climate change paints a scary picture. The maybe's are really scary. Geologic time is (almost) as slow as space travel is far, but to see changes at the rate we are now is truly remarkable and shocking.
Personally, I think we're doomed.
According to Megan Quinn's Article on the Community Solution Conference:
I have been following the Middle East Economic Survey's figures for a coupls of years, and their August crude numbers were released on Oct. 10. They show a slight uptick to 30.07 mbpd -- near 2005's production levels -- but not OPEC's October 2004 peak of 30.28 mbpd
- "Koppelaar (2006)" should be in the "Crude oil + NGL" section, not in "All liquids"
- "Skrebowski (2003)" is in fact "Skrebowski (2006)"
Note that I'm not sure yet on how to interpret Koppelaar last forecast. In particular, I'm not sure if he's talking about All liquid production or crude oil + NGL. He used 81.76 mbpd for 2005 production so I concluded that he was talking about CO+NGL. However, he's predicting 93-94 mbpd in 2010 (at 4% depletion rate) which is above EIA forecast for all liquids!I will send him an email.
By the way, you might want to look at the peak oil dates on Table 1. Perhaps some of those "0"s should be "1"s?
And will it go to the big 4 ?
"But the real gem -- what one oil consultant called the "Holy Grail" of the industry -- lies in Iraq's vast Western desert. It's one of the last "virgin" fields on the planet, and it has the potential to catapult Iraq to number one in the world in oil reserves."
http://www.alternet.org/waroniraq/43045/
But geologists talk, and the number leaked is 47, not 120 or 220 billion barrels. IOW, less than half the amount claimed.
The reasons for this are twofold. One, as Deffeyes points out, all the OPEC countries inflated their reserves when OPEC started calculating quotas based on a percentage of reserves. They did not discover any more oil, but their reserves somehow jumped. Two, Iraq's best fields have been seriously and permanently damaged by the way they were produced during the decade of sanctions. (For example, pumping oil in to get natural gas out.)
My guess at the time was that it was a leak of the Iraqi stats that were confiscated at the beginning of the war (the notorious seizing of the oil ministry while the museum and everything else was looted).
Interestingly, a couple weeks after this article came out, Dubya decided to shift from leisurely colonization to having elections and getting out (which has not been very successful).
November 30, 2003
Oil Experts See Long-Term Risks to Iraq Reserves
By JEFF GERTH
I think this url expects paying customers, but I was able to find the article quoted in full on various other websites:
http://www.nytimes.com/2003/11/30/international/middleeast/30OIL.html?hp
Oil Experts See Long-Term Risks to Iraq Reserves
WOuld you care to comment on the chart that (I think) you did earlier regarding Chris' mega projects? Specifically, how can 2006 production possibly end up where he predicted it would be? ANd, his guess for 07 looks unattainable from here.
Yes, the projects are coming on line more or less on time, month by month throughout the year, but are just sufficient, so far, to account for the decline from older fields. It looks as if his depletion rate is low... and, if depletion is accelerating, then his projections will be further off as the years go by.
http://static.flickr.com/84/212666602_e6a2b3f83b.jpg
I used the same curve (Net Net) on which a spread factor has been applied in order to model uncertainty in the exact project timing (I think that a Monte-Carlo procedure would probably have been more appropriate). However, at that time I applied Chris projected new supply increments on the all liquid production instead of the CO+NGPL production.
That's a very good question. I guess you're right, if the projects are on time and are meeting expectations but total production is not increasing that should mean that decline rates are higher than 4-5%. I know that Rembrandt is presently working on a new bottom-up analysis and that is preparing a story for TOD. That's a very good question to ask him.
1) His whole decline analysis is based on comparison of production from 2004 to 2005. He took all new production during that time and subtracted it from the net increase 2004-2005 to calculate a base decline rate in the event of no new projects online. This became the base decline rate he used going forward, with slight annual increases to account for more declining fields. He annual production figures then represent new production added to previous year's production minus his calculated decline.
One problem is he didn't account for the increased production during that time which came from prior spare capacity (400,000 - 500,000 bpd) rather than new production. This resulted in a systematic underestimate of decline of this amount, which is of increasing importance going forward.
2) Less quantifiable but probably even more important, he didn't account for the simultaneous onset of significant decline for Ghawar, Burgan, Cantarell, and Daqing. These were only beginning or about to begin decline during the 2004-2005 period, and I believe this produces a significant relative increase in worldwide decline rates in this and later years, departing from the linear path he was following for the earlier period.
In your spreadsheet, you have detailed discovery data by year that I have only ever seen in graphical format, from Harry Longwell's ExxonMobil article in World Energy, and which Colin Campbell adapted for his well known graph.
Where did you get the detailed annual data? (surely you didn't just read it off the graph?) Was it actually tabulated in the Oil and Gas Journal 2003 article, or the May 7, 2002 Exxon link (which doesn't work anymore)?
There is currently an Australian Senate Inquiry into Oil Supply, looking at how plausible the peak oil forecasts are in relation to the optimistic official forecasts. I and others in ASPO Australia have been providing a lot of information to them. A source for your annual discovery numbers would be very helpful to our cause.
By way of thanks for your ongoing work, I'd be happy to make a small donation to TheOilDrum or your own website, if you can point me to a link..
cheers
Phil Hart
ASPO Australia
This data set is a contribution of a member of the PeakOil.com forum (Geko45). I'm not 100% certain but I think he probably estimated the values directly from the Exxon graph.
Many thanks, It's very generous of you. If you want to make a donation the best would be to contact Prof. Goose.
I did a review of chapter 3 of Beyond Oil. Deffeyes stated that at the peak of the US lower 48, The HL plot showed the peak of production was 1970, and the smooth curve (logistic curve) showed a peak 5 years later in 1975. He suggested the same thing might happen with the world peak.
That would indicate December 2005 is the actual production peak (C+C), yet the best fit of the smooth curve could show a peak around 2010. Correct me if I'm wrong but that's what I got out of it. As for other liquids, that's all fluff.
Orimulsion is a mixture of tar and water, intended to be used in power plants as a substitute for fuel oil. The bitumen (tar) is to heavy to be pumped, so it's thinned down with water and pumped into supertankers. This is the really frightening thing. It has to be an environmentalist's nightmare, but, Heaven help us, it looks like that's where we're headed.
If PO was the only problem, we might stand a chance, but pollution and GW will soon likely become an even bigger one.
Former coal executive, chaired the Australian Coal Association 1987-88
This sort of chap usually holds tight to the government teat, big subsidies to big carbon.
But Dunlop has has a conversion:
smh 16Oct06
We are about to experience the convergence of three of the great issues confronting humanity. Climate change, the peaking of oil supply and water shortage are coming together in a manner which will profoundly alter our way of life, our institutions and our ability to prosper on this planet. Each is a major issue, but their convergence has received minimal attention.
...
The pressure for change must come from the community at large, where it is building toward a "tipping point" which will force a fundamental realignment of political and corporate attitudes.
Historically, this has rarely happened without a crisis. Fortunately the trinity are about to trigger that crisis with a prolonged period of "creative destruction" which will radically transform society and economy whether we like it or not.
Dig that "Fortunately" - I suppose he means that the sooner the trigger the better. I dont imagine that Dunlop is eager to see a crisis, but there is an edge of glee in his comments, unusual for such an establishment figure.
gbruno
There have been those who have helped others off the stage, eg Hitler, Pot and Sadaam, but the really heavy lifting has come from China's one child policy, keeping millions from getting on the stage in the first place. How many at tod think this policy should be emulated here?
imo, all charity should be devoted to various family planning programs around the world.
Man, have you been swimming in the kool-aid again?