| And how is Saudi Arabia getting on? (or more evidence of a deteriorating situation...) | The Oil Drum | Nature takes on peak oil (pun somewhat intended) |
Peak Oil Salvation?
Posted by Dave Cohen on January 4, 2007 - 12:55pm
Taking a different approach, I decided to single out those countries that have made significant production increases in recent years — defined as any producer nation that has contributed an additional 0.5% to the current global liquids supply from fossil fuels (crude oil, condensates + natural gas liquids) since the year 2000. The result is shown in Figure 1.
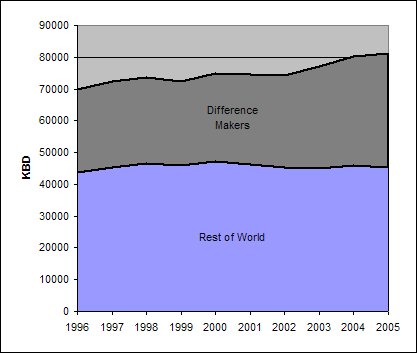
Countries contributing at least a 0.5% increase since 2000 in world production of liquids fromfossil fuels (grey) versus the rest of world (blue). Does not include CTL or GTL. Data from BP — Figure 1
Will these difference makers deliver us from the turbulence & chaos of economic contraction and provide peak oil salvation?
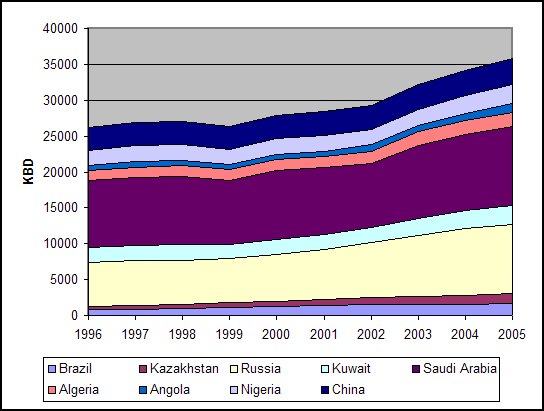
The 9 significant producing countries.
Figure 2 — Click to Enlarge
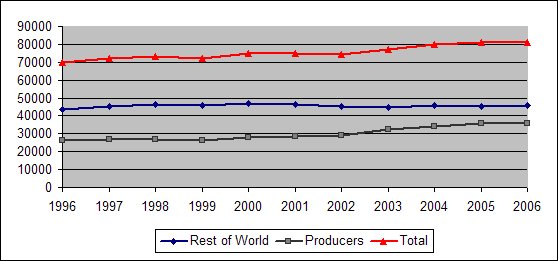
The 10-Year Data Trend — 2006 is an estimate
based on EIA and Oil & Gas Journal data
Figure 3 — Click to Enlarge
A cursory analysis reveals that there have been two plateaus in oil production (as defined here) during the last 10 years, aside from the current one that began in 2005, the last year for which officially compiled data is shown. The first plateau was from 1997 — 1999 (percent change = +0.0018) and the second one was from 2000 — 2002 (percent change = -0.0075). What is striking in Figure 3 is that the world total follows the tally for the "Big 9" producers, whereas the Rest of World is almost perfectly flat since 1997.
What is the significance of this? You got me! Eyeballing the BP data, the criterion used for differentiating the "Big 9" was the first one I tried — it is completely arbitrary. Other countries, such as Libya, the UAE and Azerbaijan, have raised production but did not make the cut. However, I do believe we're on to something. 
The metric used does confirm what we should already know at The Oil Drum. First, the largest contributions come from the deepwater producers (Brazil, Angola, Nigeria), the Middle East/North Africa countries (MENA — Algeria, Kuwait, Saudi Arabia), the Former Soviet Union (FSU — Russia, Kazakhstan) and — no surprise here! — China. Second, the list contains the two usual suspects, Russia & Saudi Arabia. Figure 2 clearly demonstrates the role both countries played in increased global production over the last 10 years and, especially, the more recent rise in the 2002 — 2005 period.
Here are some brief notes on the "Big 9" producers to guide us as we go forward into 2007 & beyond — perhaps to boldly go where mankind has been before.

| Man #1: Who's that then? |
| Man #2: I dunno know. Must be a king. |
| Man #1: Why? |
| Man #2: He hasn't got shit all over him. |
- Brazil — Petrobras continues to pursue an aggressive offshore E&P program in the Campos and Santos Basins. However, older deepwater fields have peaked quickly and Brazil faces a decline rate of around 9% in existing production. According to What Can We Learn From Petrobras? (subscription required), Brazil must add 1.11 mbd by 2011 to simply maintain their August, 2006 production of 1.88 mbd.
- Kazakhstan — Jerome á Paris provides an excellent overview of Kazakhtan in A primer on Caspian Oil. However, until Kashagan comes on-stream , which has been repeatedly delayed — now scheduled for 2010 — Kazakhstan's additional incremental production will have to come from its Tengiz, Kurmangazy and Karachaganak (gas condensate) fields. I expect new contributions to the world oil supply to remain small.
- Saudi Arabia — See HO's latest summary And How is Saudi Arabia getting on?
- Russia — Unfortunately, this is too large a subject to cover here. However, we are now witnessing the slowing of their expansion as this EIA graph makes clear. Recently, Russia announced a 2.1% production increase for January — November of 2006. This amounts to annualized production of 9.505 mbd for the year, a figure that excludes natural gas liquids. For background, see Uncertainties About Russian Reserves and Future Production.
- Algeria — This country is thought to be on track to continue its production expansion. Algeria's oil sector continues to be dominated by state-owned Sonatrach but their liberalization program has attracted a large amount of foreign investment. Their largest fields by far are in the Hassi Messaoud basin (1956). However, discoveries continue there and elsewhere in the desert — for example, the Berkine basin. I expect production growth to slow there, nonetheless. Stay tuned.
- Angola — see my summary in Angola Joins OPEC.
- Kuwait — One of the "bigger" news items of 2005 was that the greater Burgan Complex was exhausted. What this meant was that under ideal conditions, Kuwait could not lift more than 1.7 mbd out of the ground there — the field had plateaued. Therefore, in order to substantially increase production, Kuwait will have to expand production from its older northern fields (Sabiriyah, Raubhatain, Abdali and Ratqa) near the Iraq border. This requires that Project Kuwait must go forward but not everyone is keen on reopening national interests to outsiders in Kuwait — the project has been continually delayed. Kuwait's expansion appears to be at an end.
- Nigeria — continued expansion depends on these guys.

Welcome to Our WorldThey always let the hostages go except when some of them are inadvertently killed as a result of some bungled operation by the Nigerian military.
- China — For obvious reasons, these guys can't extract oil from the ground fast enough. Hence, China pushes domestic upstream development (OGJ, subscription) —
China’s national and international oil companies are actively involved in exploration and development projects on and offshore China.
Here's a nice overview of E&P from their primary onshore operator China National Petroleum Corporation (CNPC). At Daqing, where there has been very large water cut (80 to 90%), they are successfully using polymer flooding EOR (OGJ, subscription) to increase their recovery factors there. China's production will continue to expand for a while — the only question is how much.Commentaries attribute China’s quest for overseas petroleum to its lack of domestic oil and gas resources. But according to production figures from the US Energy Information Administration, China in 1998-2005 produced more oil than any OPEC country, except Iran and Saudi Arabia, more oil than Canada, the UK, or any Latin American or European country....
Ismail Tiliwaldi, chairman of the Xinjiang Uygur region, said in mid-June that he expects it to become China’s largest oil-producing area in the next few years. Currently third in oil production, behind Daqing and Shengli, Xinjiang produced 22 million tons last year. Tiliwaldi said there are plans to increase production to 50 million tons/year and there is potential for 100 million, since Xinjiang has 30% of the country’s oil reserves and 34% of its natural gas....
China’s offshore resources include the fields in the South China Sea (Tables 2 and 3); East China Sea (Xihu Trough and Chunxiao gas field); and Bohai Bay. Exploration and development in the South China and East China Seas have been hampered by territorial disputes. Sovereignty over the Spratly Islands in the South China Sea is disputed by China, Malaysia, the Philippines, Taiwan, Brunei, and Viet Nam. Recently, China, the Philippines, and Viet Nam have reportedly agreed to limited joint exploration. CNOOC, Philippine National Oil Co., and Vietnam Oil and Gas Corp. signed an agreement in March 2005 to jointly explore the oil potential of the islands and atolls in a 3-year seismic survey.
Now, unlike some others around here, I do not like to predict the future. Unfortunately, being worried about peak oil, I am forced to be in the forecasting business. Therefore, consulting my chrystal ball, I will go out on a limb and make three bold predictions:
- The Sun will rise tomorrow.
- My beloved, but doomed, Denver Nuggets (with both Allen Iverson and Carmelo Anthony) will get to the NBA Western Conference finals in the Spring of 2007, where they will lose.
- The net increase in Angola's oil production as measured in barrels per day from this month — January of 2007 — forward until January of 2010, will exceed the net increases of both Russia and Saudi Arabia — each taken separately — in that 3-year period over their 2006 averages as compiled in the BP data when all is said & done.
Dave Cohen
Senior Contributor
The Oil Drum
davec @ linkvoyager.com
Contact
- Content: editors at theoildrum dot com
- Tech support: support at theoildrum dot com
License

This work is licensed under a Creative Commons Attribution-Share Alike 3.0 United States License.
Happy New Year!
Consider this a reminder to positively rate this articles (using the icons under the tags in the story title) at reddit, digg, and del.icio.us if you are so inclined. (email me at the eds box if you have questions about this)
Also, don't forget to submit this to your favorite link farms, such as metafilter, stumbleupon, slashdot, fark, boingboing, furl, or any of the others. This is exactly the kind of post that needs eyes in the MSM and by others in the blogosphere. Let's make sure they see it.
The most recent EIA crude + condensate numbers (average 2005; average 2006 through October 2006, mbpd):
Saudi Arabia: 9.6; 9.2
Russia: 9.0; 9.2
Angola: 1.3; 1.4
From peak to most recently monthly number, Saudi production is down--as the HL model predicted--"voluntarily" by 800,000 bpd.
Russia's post-50% of Qt cumulative production, through 2004, was 95% of what the HL model predicted it would be. Based on the HL model, we should be seeing a production decline in 2007.
My prediction: we will will continue to see Saudi production declines in 2007, and Russsia will join Saudi Arabia in showing lower production. Both countries are already reporting--as I predicted in January, 2006--lower net oil exports.
and what does HL say for Angola?
Angola is in the "Too early to say" group as defined by Roberto Canogar:
About China: Chris Skrebowski and the ASPO is saying that China will probably peak in 2005-2006.
Russia production growth rate has slow down by almost 50% since mid-2004:
SA is really the big unknown and the interpretation of the recent drop in production is controversial:
Another country that may enter the "Big 9" is Iraq if the situation can get stable one day.
The weight of the "Rest of the world" is becoming increasingly heavy:
Hi everybody and happy new year
following my guest post hosted by Khebab, I showed that EIA predictions started dropping in August, 05. It seems interesting thus to compare the current EIA figures for 2006 with those in July 05 STO report :
2006 predictions... July 2005 /Dec 2006
US 9.0 ; 8.4;
Canada 3.2; 3.3;
Mexico 3.8 ; 3.7
North Sea 5.1; 4.7
other OECD 1.5;1.5
Total OECD 22.6; 21.7
OPEC 35.4;33.9
FSU 12.3;12
China 3.7;3.8
Other non OECD 13.1;13.3
Total world 87;84.7
Clearly, the failure to produce as much as was expected one year ago comes mainly from OPEC (most probably KSA, but I don't have the details of STO computations) , North sea, US and FSU. Mexico is still close to the roadmap, but for how long?
Do you know what Hubbert Linearization tells us about China's peak?
China's HL plot based on data since 1949 points to about 72 GB URR, so 2006 production brought it to about 48% Qt. It will pass 50% Qt sometime late this year or early next year. The prediction of 2005-06 was probably only slightly premature. 2006 production (with data through November) is likely to reach 184 million tonnes (3.68 mmbd), up 1.6%, and next year is likely to be only a bit higher. Daqing's decline is now accelerating, from 2.5% to 3.5% a year, even with recent efforts to increase recovery. It is, however, only 25% of Chinese production now, down from 40% in 1990.
Thank you for this.
Well, three things come to mind. First of all the title would be better called "Peak Oil Delayed." Salvation means saved and our goose is still cooked (absent mitigation and preparation) whether the peak would have happened in 2000, today or in 2012.
Second, we ought to be out thank our Russian and Saudi suppliers for really stepping up the last few years. We couldnt have done it (business as usual) without you guys! Keep up the good work (if you still physically can) and nevermind what our politicians and econonomic talking heads say about your regimes and (national) oil companies. You keep suburbia humming!
Third, what about Iraq? Yes, I know its a tattered mess but the oil ain't goin' anywhere. Isn't that country the only one left on earth that can truly boost its production levels (again disregarding the civil war--err, sectarian conflict) to fill the void caused by depletion and our tapped out Russian and Saudi friends?
What did you think America invaded Iraq to spread democracy ?
If anything confirms peak oil its the obvious decision to not only invade Iraq but the fact that our elected leaders regardless of party are willing to stay.
Historians will not realize that at the time the majority of the world did not get it.
Dave my face is pretty blue today - not sure if that is Pictish genes or the fact that I woke last night with a pair of hands clenched round my throat.
I just want to plant a radical idea here and that is that historic production data = demand
When we are past peak, production will = supply
So do you think it is possible that the "plateaus" are demand related?
(this must be about the 100th time I've suggested this and so imagine that I will soon be ejected as a Troll)
Very good question! in particular if you look at Saudi Arabia, is the recent drop demand related (not enough demand + high inventories) or a supply problem?
In order to answer you need side information about reserves, new projects, depletion, etc.. In case of KSA, we have only very partial information.
IMO, the only way to decide between a demand or a supply plateau, is:
1. High prices for a long period
2. Steady oil demand (no economic recession)
3. Lower inventories
4. Drilling frenzy
Regarding KSA projects, I note that the new Khursaniyah development (claimed 500,000 bpd Arab Light) has been brought forward by 6 months from Dec 2007 to June 2007.
On the face of it this seems odd considering the Saudis already supposedly have ample spare capacity and they've been voluntarily cutting back on production. However, the decision regarding this may have been taken at a time when the global demand/supply balance looked somewhat different, and there were concerns regarding supply disruption from Iran, hurricanes etc.
One to watch out for later this year.
Perhaps Khursaniyah provides better economics? - allowing the Saudis to rest tired reservoirs?
Good point, Euan. Mind you, if Simmons is right about Khursaniyah that doesn't say much for the rest of their fields :-)
IMO the litmus test will be falling production correlated with rising price
And I'm not convinced that oil prices are actually that high yet - oil is probably still cheaper than bottled water.
This is where the historical models come in--especially the Lower 48 and Texas. Nothing has reversed the long term declines. And nothing has reversed the long term North Sea decline after it crossed the 50% of Qt (C+C) mark.
The world and Saudi Arabia, in 2006, were at the same stage of depletion at which the Lower 48 (also the North Sea) and Texas started their long term declines, and by most measures (all but total liquids for the world), world and Saudi production are declining as expected.
Hello WT, It also seems that we are entering uncharted territory with respect to increased drilling costs. After the 50% mark for the Lower 48, we were able to continue to drill as much as we wanted to because our drilling costs were supported by imported cheap oil. The market was unable to increase the price of oil in the US to reflect the decline in US production. After we hit worldwide PO (which I believe has already occurred) there will be no cheap outside supply of crude to keep drilling prices down (or the price of crude, either).
So, higher drilling prices after PO will cause many feasible drilling projects to be abandoned, even though we may know the oil is there. This is happening now. The US is reducing its GOM drilling and the rigs are going to the Middle East. We are even sealing GOM wells that we can't afford to restart (after the hurricane damage).
This will steepen the downside slope of PO. We can't determine how much the slope will increase, but it could be substantial, as the limited exploration funding appears to be being eaten up by deep offshore drilling costs. We could find the world giving up on the search for new oil quite quickly, no matter the price.
There is just a slight problem with a "demand" plateau : for 2006 and 2007 EIA forecasts that demand will exceed supply, and that stocks should diminish. For me it is not compatible with a "pure demand destruction" hypothesis.
Nevertheless demand destruction must play a role in the peak date. The cornucopian argument that the higher the prices, the more investment are possible, and so more production will follow, is not totally stupid - but there is a point where high prices destruct so much demand that investments are simply useless, and this point is not very far from the geological limit of "easy oil". So IMHO there is not much difference between demand destruction and supply disruption.
If you look at the IEA forecasts (International Energy Outlook, 2006), they considered three cases: low prices, high prices and the reference case. The production forecast is much more lower for the high price case (see charts in my comment above).
It seems that there are two main feedback mechanisms:
1. High prices => lower demand => lower supply
2. High prices => more investment => more spare capacity or more supply
The second mechanism is probably a long term feedback (> 2-3 years).
of course the price measures only the balance between demand and supply - it doesn't say anything about the reason why each of them is high or low. IEA cases are thus ambiguous!
I just wanted to stress that if the main reason of price climbing is the decline of easy oil production, high prices would indeed help finding new resources, but also destroy demand, and that's the combination of these two factors that will eventually determine the peak value. After all, conventional oil has most probably already peaked, and cheap oil is really over. Now we are just at the point where we can produce a little bit more-but at which cost and who will buy it ?
-duplicate post-
Also, in the longer term, the product mix fundamentally changes in the EIA's high-price case.
In 2030:
Reference case = 90.2% conventional, 9.8% unconventional
High-price case = 79.3% conventional, 20.7% unconventional
Much less is expected of KSA under the high-price case.
Hi Gilles, Hi khebab.
Your assertions that higher prices ultimately lead to greater production is surprising: Has not the rate of discovery been declining since the early 1960's? Colin Campbeel, IIRC, has shown that the rate of discovery, and real petrotroleum prices are uncorrelated. He has also demonstrated the "creaming curve" (essentially an assymtotic limit) in the world discovery rate.
What sort of data makes you think-
"High prices => more investment => more spare capacity or more supply"
is a real relationship?
I have no data but it's a frequent claim in the mainstream media: "we have maybe run out of $20 oil but not of $70 oil". I know also that small fields judged uneconomical a few decades ago are being reopen now.
Except for unusual circumstances large fields would be brought online almost regardless of the price of oil as long as they can make money.
So the high price increasing demand is a bit of a red herring since your talking about fields that are small/marginal brought online. It takes a huge number of these fields to create 1mbpd of production. And of course they need to compete with work overs of larger fields for equipment.
I would say that low prices does suppress work overs of larger fields and production plans for a few large producers such as KSA that have or probably had a large number of undeveloped fields. So as far as overall production goes its really the ability of a few countries that have known underdeveloped reserves to bring them online during high price regimes.
Other development that may be lucrative financially probably does not have a significant effect on either prices our overall production.
A measure of the production from small fields over time would be interesting to verify how much of a effect they have.
Centuries of economic research provide evidence that higher prices will lead to increased profits, assuming inelastic demand. Current market participants earning those higher profits will look to invest their increased profits where they will get the greatest return on their investment. In many cases, this will lead to existing participants using their increased profits to invest in new production in order to try and grab more market share. According to standard theory higher than average profits will also encourage new players to enter the market.
I believe this is exactly what we are currently seeing. There is major investment by existing market participants and new entrants offering substitutes (i.e. Tar Sands, Biodisel, Ethanol, etc.)
Whether or not this actually leads to increased spare capacity or supply is a whole other matter, of course.
Euan Means: historic production data = demand
When we are past peak, production will = supply
This looks like a theory of pricing: What is the difference between your statement and the paradox of value, proposed by Adam Smith: Why is water, which is needed for life, inexpensive while diamonds, which are frivolous, very expensive. http://en.wikipedia.org/wiki/Paradox_of_value Adam Smith could not solve this problem, but later economists used it to come up with the marginal utlity theory of pricing.
Oil is an inelastic good like water -- perhaps not as inelastic as water but close.
Actually, Adam Smith did resolve the paradox of diamonds and water. He did not use the term "marginal utility," because it had not yet been invented.
Little known fact: Adam Smith was a professor of Moral Philosophy and taught logic (among other subjects) for many years. I have yet to find anybody who has found a lapse in logic (a fallacy) in either of Smith's two great works--"Theory of Moral Sentiment" and its sequel, "Wealth of Nations."
Smith had an answer (see the Wikipedia article above), but it's a different one, not just the absence of the term "marginal utility." He ascribed it to the difference in difficulty to acquire, a labor theory of value.
When I sell something to you, I am sure you don't care whether I worked a little or a lot, whether it was difficult or easy, but only whether you want it enough to meet my price. Roughly speaking.
Similarly, society is willing, at present, to pay higher prices for oil, not because it's harder to acquire, but because they want it (inelastic demand) and insufficient alternatives. Oh, well.
Ok -- also I think what's getting some people is that the demand for oil only goes up by 2.2% or a year and the price goes from $30 to $60. "Demand and supply are only different by a few percent, and therefore it is ridiculous the price changes so much"
Well think of it in terms of economic growth -- econ growth of 1.5% (as in the US last quarter) is not "2.0% lower" than 3.5% economic growth -- it's 57% lower (3.5%/(3.5%-1.5%)
Euan, we don't have to look back that far for a demand driven plateau brought on by an aisan flu hangover and clinton's recession:
1999 74.5
Y2k 77.1
2001 77.3
2002 77.0
2003 79.8
Eh! what about Canada? what are we chopped liver?
Probably because Canada has not entered the "Big 9 club" yet has defined by Dave (production growth > 0.5% between 2000 and 2005).
BTW, is the upgraded crude oil from bitumen counted as C+C production for Canada?
In the BP review (EIA also), syncrude is included in the total production. It's difficult to keep track of the numbers for syncrude.
Re: what are we chopped liver?
Canada showed a 0.4% increase between 2000 and 2005. Close, but no cigar. Keep rooting for those tar sands! Still, I should have mentioned them. Sorry.
Canadian oil sands production up only 5.8% in 2006 from 0.91 mbpd in 05 to 1.05 mbpd in 06 http://canada.theoildrum.com/story/2006/10/20/142436/03. Would have thought higher increase in oil sand production. I don't have data for 2006 but 2005 conventional Candian oil production down 3.0% http://www.statcan.ca/Daily/English/060816/d060816e.htm
Canada's tar sands commenced outproduction of conv crude in 2004. Total production:
2005 - 3.06
2006 - 3.21
2007 - 3.41 (est)
We need some way of measuring actual demand. Production is only one half of the equation. Actual imports country by country? Actual usuage country by country? All over time, of course.
We keep talking about "demand production." Certainly it should be measurable.
We need some way of measuring actual demand. Production is only one half of the equation. Actual imports country by country? Actual usuage country by country? All over time, of course.
We keep talking about "demand production." Certainly it should be measurable.
I don't think there is. How do you count the oil consumption via "bunkering" in Nigeria?
Export numbers are probably the closest we can get.
Khebab...from the Saudi Production curve what caused the sharp increase in production in 2004 [or shortly thereafter]? What was brought on-line to do that?
Thank You
IMO, this increase was analogous to the 1962 to 1972 increase in Texas production.
BTW, the number of producing wells in Texas fell from 1962 to 1972, as production increased from 2.5 to 3.5 mbpd, and then the number of producing wells rose from 1972 to 1982, as production fell from 3.5 to 2.5 mbpd.
A more likely analogue would be another member of OPEC. Conveniently there is an OPEC member that we can say is past peak based on actual data rather than mere speculation: Indonesia. Here is a Hubbert plot of Indonesia using data from before it peaked and went into decline in 1991.
Note the 'dogleg up' when production was increased when OPEC covered lost production form Kuwait, similar to that for Saudia Arabia from the last few years
Did its production collapse and return to the Hubbert line previously established?
No, it stayed relatively level for several years before going into decline following a new Hubbert curve.
Could you send me your data source? According to the US embassy, Indonesian production has been dropping since 1993.
Texas, like Saudi Arabia, produced at less than its capacity for long periods of time, and Texas effectively controlled the world price of oil from about 1935 to 1972. Why not use the prior swing producer as a model for the successor swing producer?
In any case, some smaller regions like the UK and Indonesia clearly have noisy HL plots. The readers might find it interesting that people trying to rebut the HL method are forced to scurry around looking for smaller and smaller producing regions, while the large producing regions--like Texas; Lower 48; Total US; Russia; North Sea and Mexico--all fit the model. The world and Saudi Arabia, as predicted by the HL models, are now also showing lower production.
In any case, if you prefer to believe that we can indefinitely increase our consumption against a finite resource base, I encourage you to go ahead and buy several SUV's. I still need to pay for my 2007 European vacation.
"I encourage you to go ahead and buy several SUV's." Funniest thing I've seen all day WT.
Well... almost http://www.break.com/index/effect_of_drugs_and_alcohol_on_spider_webs.html
Re: In any case, if you prefer to believe that we can indefinitely increase our consumption against a finite resource base, I encourage you to go ahead and buy several SUV's
Reading Alan's comment, I don't believe he made any remark whatsoever that would justify this part of your reply.
Dave,
Give me a break.
The guy doesn't like the fact that Saudi Arabia is showing the same production profile as the prior swing producer, so he looks around for a small producing region that has a complex HL plot, trying to prove that Saudi Arabia is not in permanent decline? All of this is while, Saudi Arabia, exactly as I predicted one year ago this month using the prior swing producer as a model, is declining.
Constantly arguing with people who appear to be utterly clueless about critical importance of the near certain decline of the four super giant oil fields--while the world and Saudi Arabia are declining exactly as predicted by the HL models--is getting really old.
I would like to broaden my invitation to all readers. I have changed my mind. Ghawar is going to reach 10 mbpd. Please go buy large SUV's for every member of the family. Party on dudes. I intend to thoroughly enjoy all of my future European vacations.
I'll listen to you when you demonstrate that Saudi Arabia is ... in permanent decline just like Texas in your constantly repeated example, which includes showing me the numbers for Ghawar. But, time will tell, won't it?
I'm trying to win this peak oil argument with CERA, OPEC, XOM and others. I believe the data & other factors (geological, economic, logistical, environmental) speak for themselves. I avoid claims I can't substantiate and I don't need to make them, anyway, to make my case.
And that is the last thing I will say on this subject -- forever.
I know you said you would not comment agian but.
I think your making a serious mistake. By the time we know for a fact that KSA is in decline and indeed the whole world is in decline we will be post peak.
The chances for real proof either before the peak or even in the few years after the peak are slim to none.
Peak Oil like Global warming are best mitigated by acting when you have a reasonable set of evidence that they are taking place. In both cases the evidence has been reasonable for a number of years now probably close to five.
Another example consider a earth crossing asteroid that we discover that has a say 10% chance of hitting earth. If we act early its easy to divert it and ensure it will not hit the earth. The closer it gets before action is taken the greater the required action to divert it. In the case of the asteroid by the time your say 90% sure its going to hit its to late to take any meaningful action.
I think we have lost the battle for global warming already. Its increasingly obvious that Peak Oil will probably suffer the same fate.
I agree. I don't see much chance of coordinated intelligent responses on either global warming or peak oil. The cake is already baked. When the symptoms get bad enough to drive political action it is already too late. The most likely outcome is major environmental degradation and dieoff. When? It's not a single event that can be dated. Global warming and Peak energy will be kicking our collective asses for the next 100 years. I can't predict exactly when the effects will result in enough pain for mass recognition of our fate.
Oaksmoke, forgive me, but I can't tell whether your post is sarcasm or not. I certainly hope it is, because if not you're certainly professing a very pessimistic view of the world!
Fortunately, action is already being taken. The relatively high price of oil is encouraging conservation, increased efficiency, and lots of investment into substitutes. I'm sure there will be bumps along the road as we transition away from oil, but there certainly isn't going to be mass extinction of the species!
Not sarcasm. I am not the first nor the most credible source of dire predictions. I suggest you do some reading at dieoff.org.
Texas, like Saudi Arabia, produced at less than its capacity for long periods of time, and Texas effectively controlled the world price of oil from about 1935 to 1972. Why not use the prior swing producer as a model for the successor swing producer?
Saudi Arabia may be the swing producer with the most reserve capacity but it is not acting alone. It is a member of OPEC, whose members often act in concert to control the price of oil, perhaps you've already heard of OPEC being the expert on peak oil that you are. In fact if you plot the production of the members of OPEC that are aften used as examples to show that peak oil is nearly upon us you will see that many of them follow the same track rising and falling as a group.
Hubbert linearization is most effective the production is being controlled mainly by geology. Saudi Arabia, acting as the bigggest swing producer, has had its production changed because of geopolitics, economics, and wars; mainly in other countries. Geology may be involved but moreso the geology of other countries and new competeing regins are opened up forcing SA to keep its production down to maintain prices.
The section of the HL used in claims that SA is at 60% of URR is from a decade in which OPEC has kept production relatively flat. Its hardly a surprise that it appears to be close to peak, look at the top of a Hubberts curve, at peak it is flat.
If any member of OPEC, other than Indonesia, happens to return to and follow the line established between 1991 and 2002 it will be a coincidence and nothing else.
Hello Alan, Happy New Year::::----))))
I don't know if you've seen my KSA HL that I've posted here a few times - but it has a lot in common with what you just posted - unfortunately my TOD graphics posting kit is a bit screwed at present - so I can't post the chart right now.
Euan :-)
Euan, my challenge to khebab to redraw the line showing KSA urr at 146GB plus a new regime line to 292 went unheeded; but that's where we're headed. HL assumes a country is taking all its easy oil first. KSA has half its fields undeveloped. Each year the HL will start to point at the rightful 292GB. I'd like to see your global all liquids HL if u have one.

http://www.trendlines.ca/energy.htm#misc
Freddy, thanks for posting this - presume you meant extending the 246 to 292 Gb. There may be some merit in what you say. The red line is drawn between 1991 and 2005 which were 2 years that KSA was probably producing at near capacity - from the infrastructure they had in place - and so you are right, even these two points do not see all the reserves, as there will be vast amounts of undeveloped oil - I've been saying this to Khebab and Stuart for around 6 months now.
OK - so if you extend the URR to 292 Gb, then 50% comes in at 146Gb with 116 produced to end 2005, leaving 30 Gb to go to 50%. At recent production rates of 4 Gb pa that leaves 7 years (from end 2005)before KSA peak - placing KSA peak at around 2012 / 13 - spot on Khebabs main loglet peak.
The main reservations I would have here is that the developed reserves may start to decline very rapidly - over 10% per anum - the arguments that WT has made on an occasional basis. Rembrandt has been posting a variety of HL models from John Laharererer and these show a variety of different behaviours. So I guess my main conclusion would be that HL is a useful tool to be combined with other techniques, and that it does need to be applied with extreme caution in KSA owing to long history of poilitical intervention.
The other thing about KSA is that the vast majority of the reservoirs are carbonates - limestone and chalk, and most of those have piss poor reservoir quality - porosity is OK but permeability is generally low (I don't have data to hand). The thing is that the developed resources - North Ghawar, Abqaiq et al, were in massive permeability sweet spots, so what really needs to be done here is to map the reserves volumes and reservoir quality. KSA may well have 60% of reserves left but these may be concentrated in very poor quality rock - what I'm trying to say is that the difference between "low hanging fruit" and all the rest in KSA may be even more extreme than in other countries - using areas like the Lower 48 and the North Sea as analogs is entirely wrong IMO - as these areas are dominated by sandstone reservoirs which behave in a completely different way to limestone from a reservoir engineering perspective.
I don't know exactly, but the following chart from Michael Smith may provide some light:
The increase does not seem to have come Ghawar (believe to be in brown color) but from the field in green color that is probably Qatif or Abu Saafa. There is an old story from HO here.
It's interesting to go back to 2004 press releases:
August 11, 2004
June 2, 2004
These targets and price bands mean nothing under the light of currency exchange. As discussed last month, KSA took a 30% hit being linked to the dollar since 2002 ... and more to come.
To understand you need to know the history of oil production in Saudi Arabia but a longer term chart would help. In early 99 the bottom dropped out of the oil market. Oil was just over $10 a barrel. So OPEC cut back, opened up a bit in 2000 but cut back sharply in 2001 and even more in 2002. Then they opened the chokes wide open. That is the spike you see in 2003, 2004 and 2005. They reached 9,600,000 barrels per day for six months in the middle of 2005, finishing the year with an average of 9,550,000 bp/d, but they never reached the 9,900,000 barrels per day they averaged in 1980.
They averaged 8,404,000 barrels per day in 2000 before cutting back to average 7,634,000 barrels per day in 2002. So really the increase was not all that dramatic, it just looks that way because the chart starts at 7,000,000 barrels per day. To get a true perspective you would need the chart to start at zero.
Ron Patterson
Great article. One area that isn't covered are the increases in Canadian oil sands, which is going forward like a freight train.
Which brings up three points: 1) the Type of oil that is increasing is most likely heavy sour and thereby 2) light sweet decline rates are most likely higher than heavy sour decline rates and therefore 3) refining is probably going to really squeezed to produce gasoline & jet fuel (right now refinery capacity utilization in the US is 98%) and 4)costs for the oil industry overall are going up as heavy oil is more expensive to produce and 5) heavier more sour grade oil producers like KSA and Iran won't want to produce as much as they are can while refineries can't process their crude (while US refineries are also seeing higher inputs of Candianian tar sand crude).
I suspect (but cannot prove) 6) which is US refiners want to drag their feet slightly on refinery expansion since they want to enjoy a few more years of good margins after 20+ years of negative margins (really the US refinery industry has only been profitable since about 2002) -- after all, are oil co's a business or a charity?
is it possible that as the bulk of oil in circulation gets progressively more heavy and sour that the price won't go up dramatically, but only the price of the refined products will, as they are harder to produce, especially if we hit a refinery bottleneck?
You'll get a greater and greater spread between light sweet and heavy sour in price until the refining capacity can catch up.
A must read on Russian oil, by Leslie Dienes, KU: http://www.cdi.org/russia/johnson/8236-12.cfm
I have it in pdf format too.
Excellent article -- reality check for East Siberia -- which is supposed to be a key growth area of Russian oil.
Also interesting from the article: "It is essential to note how mature Russia’s petroleum provinces are west of the Yenisei River. Russia ranks second in the world both in cumulative withdrawal from its deposits and in the number of wells drilled, second only to the US."
I noted Tatneft -- Tatarstan during the Soviet times was the USSR's single largest oil producing region at 20-25% of total production (USSR oil production was separated by fields and producing units I believe under the ultimate authority of Gosplan) -- has given up pretensions of increasing production since about 2003. Tatarstan has been in production for over 60 years but that is typical for Russian oil -- other major fields of Rosneft, Lukoil (which in Soviet times were similiarly organized as Tatneft as independent producing units under Gosplan) have also been in production for 50 years plus.
Actually correction Tatneft's supergiant Romashkinskoye has been in decline since about 1970 but they have been able to maintain production over the last few years through enhanced recovery.
Thanks for the update. Do you know what bigger projects they have coming online over the next 5-10 years?
Be looking at wind BS?
http://www.prosefights.org/wind/wind.htm
regards
Well, I see there is the usual Saudi Arabia reserves fun on this thread. Do you know why everybody likes to talk about KSA reserves? Because they are a "black box" -- it's like the I Ching. Since you know nothing, really, you can read into it whatever you like. Many a tear has been shed here at TOD over Saudi reserves.
In the interest of promoting some new, independent thinking about peak oil, I will make the following observations:
There seems to be a presupposition here that world production depends on Saudi production, that it might have been possible that Saudi Arabia could bail us out of this mess. That's the way Ali Al-Naimi likes it! But, it was never true anyway. As I mentioned above, they produce ~12% of the world's liquids. What about the other 88%? Take Iraq. Now, there's an excellent oil producer that over the last 15 years or so has been turned to shit. That's a very disturbing situation and, IMHO, far worse for the world than whether Saudi Arabia can add X mbd more. And don't forget what's happening in Nigeria. That's a very serious situation.
And our lucky winner is....
But, please! Don't let me ruin the fun! Remember what I said about Iraq above. And Nigeria. And Angola.
Dave,
Don't let the acid of cynicism eat away at you. On a number of occasions recently you've made clear your frustration that most of us here can't see what you can see, but resorting to belittling sarcasm as a tool of argument (as WT is now sadly doing) isn't the way to go.
All your observations regarding the Saudis are valid and well taken, although I'd take issue with the assertion that KSA is "just another producer". While you may have demonstrated that Angola likely has more ability to increase its production than KSA, the fact is that the perception out there amongst policymakers, economists and strategists is that the Saudis have enormous reserves and will likely account for a substantial proportion of future crude production - far in excess of their present 12% share.
I suspect the reason so many posters here are focused on KSA is because they sense that the overturning of this perception would lead to a sea-change in thinking about the resource limits of conventional crude and would fundamentally turn the tide of the debate away from the likes of CERA.
Don't take a lack of commentary on the substance of your posts as a sign that they have not been fully digested or appreciated. We hear what you're saying - really we do.
Dave, I'm just a layman, but if I may quote matt Simmons in "The end of suburbia": "If Ghawar peaked, then SA has peaked, and categorically, the world has peaked".
Exactly that is Matt Simmons' "Twilight in the Desert" overall arguement:
1) oil fields come in kings, queens and jacks and lower
2) Proportion of kings to queens to jacks is predictably distributed
3) Once the king start to decline, additional production from the queens on down can't make up the decline and overall production goes down
You can argue with any of these propositions and perhaps Dave Cohen is arguing with #3