| ODAC Newsletter, Saturday 20 October | The Oil Drum: Europe | Oil Prices around the World: Do Exchange Rates Matter? |
A few more thoughts on Saudi and HL
Posted by Luis de Sousa on October 22, 2007 - 8:50am in The Oil Drum: Europe
There has been some discussion about how to apply the Hubbert Linearization (HL) to Saudi historical production in recent weeks at TOD. Trying not to fall into redundancy, let me have some loose thoughts on these models:
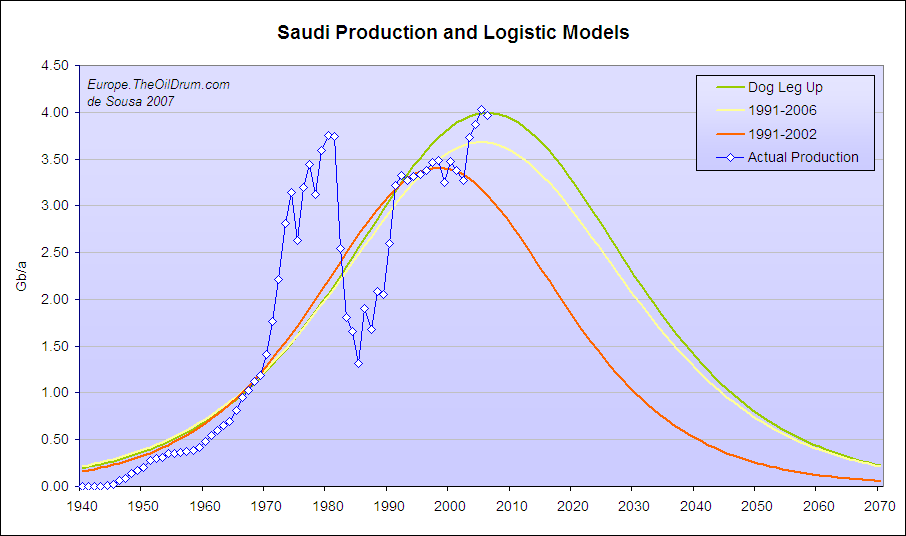
Three alternative Logistic models for Saudi production. Click for large version.
In The Beginning
While I was in Ireland for ASPO-6 it passed exactly two years on the day I registered at TOD. It was on September the 14th 2005, and I did it so I could leave a comment on this post. It was on this post that HL was introduced to TOD and interestingly the discussion about the applicability of the method started right there.
Two years later I can’t say that we moved farther on that discussion, but I’m sure of one thing, most of the folks that commented on that post learned a lot since then (I for instance improved a lot on my Latin).
All over again today
Two weeks ago Euan put out two interesting posts about Saudi that once again stimulated the discussion on the country's remaining reserves. In the midst of the discussion WebHubbleTelescope had this comment:
I would tread very cautiously on this route. First of all, the logistic model on which HL is based is purely a heuristic with no first-principles derivation. The only process that matches logistic behavior is birth-death population dynamics, and we know that oil molecules don't mate and give birth.
[…]
So I see it that we have two routes to take:
1) Go for the trivial analysis as above (therefore undermining HL, which has proven to be a perfect example of a concocted and contrived analysis)
2) Go for a real model of oil discovery and depletion
[…]
Go and check the discussion that emanated from there, it’s worth it.
Why do we use HL?
Hubbert Linearization was a name coined by Stuart back in 2005 and is just another way of identifying a specific step of what prof. Deffeyes called in his books the Hubbert Method. It’s a simple process to fit a Logistic curve to an historical time-series. Web’s reserves towards the method are pertinent, but there are good reasons to use the method:
- Applicable with High School mathematics, easy to use for a first assessment of future production;
- It uses solely three parameters to fit a curve to the data, which makes it immune to seasonal or epoch trends (it is a good token of the “big picture");
- Oil and Population growth have been closely related (has Web stressed, Population Dynamics is the prime field for Logistic predictive modelling);
- The only information needed to apply the method is historical production data, which is usually freely accessible.
Ironically, all of these strengths can also be seen as weaknesses.
Don’t get me wrong, Web is right in calling for the development of more advanced predictive methods, like his Shock Model, but that is to some extent out of reach for mere mortal engineers.
But there are rules to use HL, failing to observe them is a good recipe for disastrous results. Above all good knowledge of discovery is essential:
- How many discovery cycles were there in the past? If there were more than one, HL is not directly applicable and each cycle should be modelled independently with a Logistic curve (e.g. UK);
- Is discovery on its terminal phase? If not, it is probably too soon to apply HL. If so, to what URR is pointing the discovery cycle? HL should produce a similar result for URR;
- Finally it has to be considered that HL is not taking into account future cycles of discovery and ensuing production.
Can we apply HL to Saudi?
Technically yes, because the historical production data is publicly available; on the other hand the Saudi discovery cycle is not completely known and there are doubts about what the URR is.
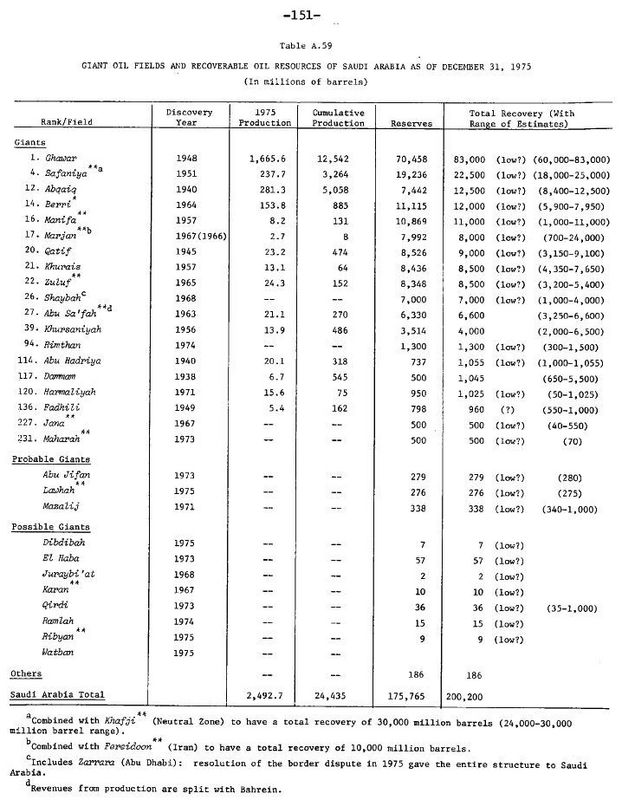
Luckily for us, Khebab has been compiling a database on Saudi discovery, it is yet to be completed and it includes mostly giant fields, but gives us a good idea. Up to know he has data from Colin Campbell's book "Golden Century of Oil 1950-2050"; Rand, 1975; Matthew Simmons’ "Twilight in the Desert" and Fredrik Robelius PhD Thesis. In the following days Khebab will publish a detailed version of this database with more data, so keep an eye on TOD’s main page.
From this database I created two cases with the lowest and highest estimates for each field:
Table 1 - Lower and Higher estimates for Saudi's individual fields according to Colin Campbell's book "Golden Century of Oil 1950-2050", 1991, pages 296 & 341; Rand, 1975; Simmons, "Twilight in the Desert", 2005; Robelius, 2006.
| Field | Discovery Year | Lower Estimate (Gb) | High Estimate (Gb) |
| Dammam | 1938 | 0.325 | 1.05 |
| Abu Hadriyah | 1940 | 1.055 | 1.76 |
| Abqaiq | 1940 | 12.5 | 19 |
| Qatif | 1945 | 3.2 | 9 |
| Ghawar | 1948 | 66 | 150 |
| Fadhili | 1949 | 0.95 | 0.96 |
| Safaniya-Khafji | 1951 | 21 | 55 |
| Khursaniyah | 1956 | 2.3 | 4 |
| Khurais | 1957 | 8.5 | 19 |
| Manifa | 1957 | 11 | 23 |
| Abu Safah | 1963 | 6.15 | 7.81 |
| Berri | 1964 | 7.3 | 25 |
| Zuluf | 1965 | 8.5 | 20 |
| Fereidoon-Marjan | 1966 | 10 | 10 |
| Marjan | 1967 | 8 | 9.26 |
| Janan | 1967 | 0.5 | 0.5 |
| Karan | 1967 | 0.01 | 0.01 |
| Shaybah | 1968 | 5.71 | 19.82 |
| Barqan | 1969 | 0.5 | 0.5 |
| Mazalij | 1971 | 0.338 | 0.63 |
| Harmaliyah | 1972 | 1.025 | 1.81 |
| Abu Jiffan | 1973 | 0.279 | 0.5 |
| Maharah | 1973 | 0.5 | 1.1 |
| Qirdi | 1973 | 0.036 | 0.036 |
| El Haba | 1973 | 0.057 | 0.057 |
| Rimthan | 1974 | 1.3 | 1.3 |
| Lawnah | 1975 | 1.17 | 1.17 |
| Dibdibah | 1975 | 0.007 | 0.007 |
| Hawtah Trend | 1989 | 1.97 | 1.97 |
| Totals | 180.182 | 384.25 | |
Plotting this data directly yields no useful information due to Ghawar that accounts for about 40% of the URR. Instead I plotted a low-passed version with a 5 year moving average:
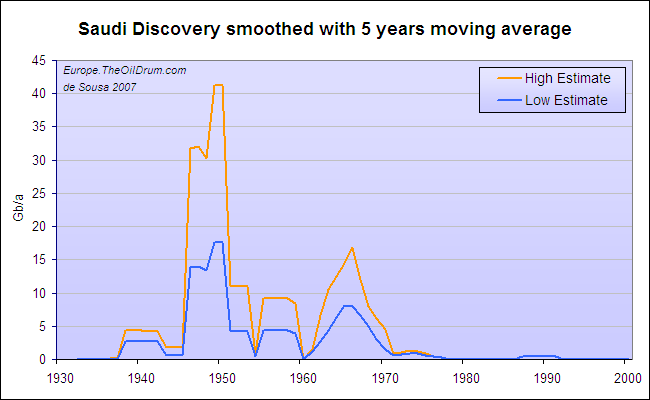
Figure 1 - Low and High estimates for Saudi Discovery smoothed with a 5 years moving average. Click for large version.
On one hand it can be seen that the discovery cycle has already ceased, but on the other hand there’s no divisible logistic. This is where problems start with Saudi Arabia; the giant fields are so giant that the discovery signal is in practice chaotic.
Still we get the URR from each estimate, 180 Gb for the Low Estimate and 380 Gb for High Estimate. Adding to that information there’s the official number of 720 Gb for the OOIP. So we are looking at a recovery rates between 25% and 52% of the OOIP. That’s a large swath of spectrum to cover.
So let’s get our hands dirty and plot the P/Q vs Q chart:
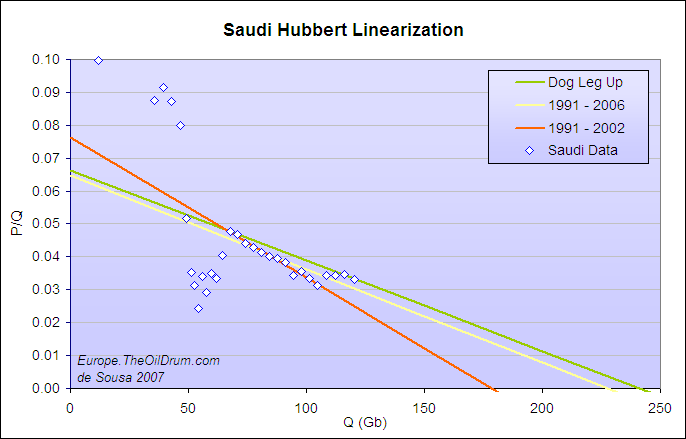
Figure 2 - Three alternative Logistic fits for Saudi production using HL. Click for large version.
The chart portraits 3 alternative fits, that have been the base of much of the discussion around Saudi on TOD lately:
- 1991 – 2002 : the fit that's the basis for ace's forecast – which regards the years from 2003 to 2006 as outliers;
- 1991 – 2006 : the fit by Khebab;
- The Dod Leg Up : the fit by Euan - which takes on the alignment of the data respective to the years 1991, 1992, 2005 and 2006 (more on that later);
The parameters and points of interest of each of these fits are resumed on the following table:
Table 2 - Parameters and results of the three Logistic fits considered.
| 1991 – 2002 | 1991 – 2006 | Dod Leg Up | |
| URR (Gb) | 178 | 227 | 241 |
| Peak year | 1998 | 2005 | 2006 |
| Pmax (Gb/a) | 3.40 | 3.68 | 4.00 |
| b (slope) | 0.076 | 0.065 | 0.066 |
| Recovery | 24.7% | 31.5% | 33.5% |
So, which one do you choose? A hard decision? Look at the familiar Production vs Time chart:
Figure 3 - The three alternative Logistic ploted on the familiar Production versus Time chart. Click for large version.
Still undecided? Try the Cumulative Production vs Time chart:
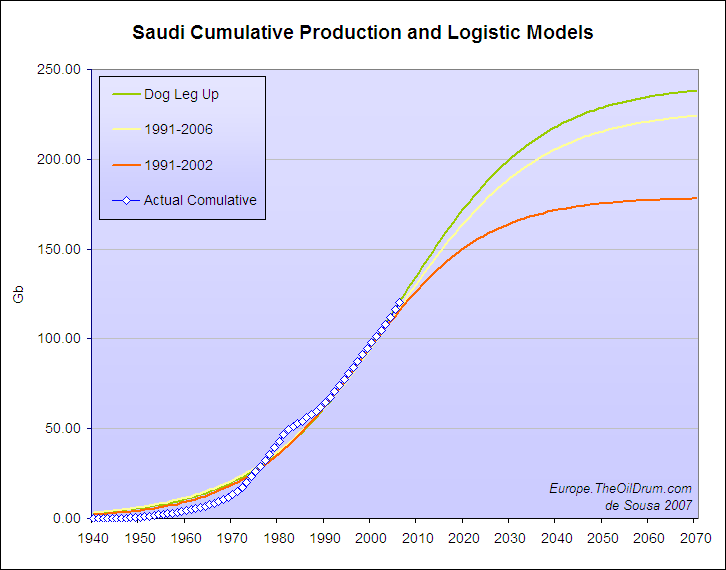
Figure 4 - The three alternative Logistic ploted on the Cumulative Production versus Time chart. Click for large version.
Again, which model do you pick?
Why do I care?
Why am I, here stuck at this finisterra, concerned with this kind of stuff? Because like you, I want to know when will the lights of this oil party start to fade away. Do any of these models help on that? If you’re still undecided between these models you are probably on the right track.
The main problem with the discussions going around at TOD about Saudi and HL is that they have been concentrated on estimating a value for URR. This value is just a secondary result of HL and a number of which foreknowledge is advisable to check the method’s efficacy. The main object of the method is to model future production and enlighten a possible epoch for the peak.
As the last charts show, none of these models seem to be doing a good job on the production profile modelling chapter. When applied to the Saudi case HL is fitting very closely the recent Cumulative profile but doing terribly on the Production profile.
Maybe we should just throw all of these models overboard.
But not so fast, let’s thought about it a bit more.
That Dog Leg Up
This is a funny name Euan coined some time back when he started looking into Saudi’s HL. It characterizes a phenomenon where after a period along a certain logistic fit, production jumps up to another path. The Dog Leg Up fit uses solely four points, but there are good reasons to consider such model.
The Dog Leg Up is the signature on the P/Q vs Q plot of a constrained production profile. Let’s consider a theoretic Logistic cycle and its counterpart restrained at 70% of maximum production:
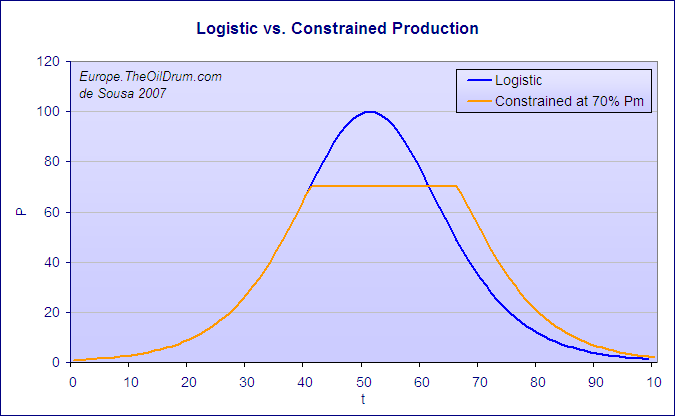
Figure 5 - A Logistic cycle and its counterpart constrained at 70% of maximum. Click for large version.
These two cycles look like this on the HL plot:

Figure 6 - The same Logistic cycle and its constrained counterpart plotted on the P/Q vs Q chart. Click for large version.
Fitting a logistic curve directly on, say half, of the constrained data series would produce a very different curve, and of course a lower URR estimate.
Look again at the Production vs Time chart for Saudi, don’t the periods 1974 – 1981 and 1991 – 2002 look like constant production periods? And what about 1982 – 1990? Moreover, it is well known the role of “swing producer" that Saudi underwent especially after 1981.
If I had to salvage one of the three previous models from the seas of oblivion it would be the Dog Leg Up.
What to expect from Saudi?
The Dog Leg Up model forecasts Saudi production above 3.5 Gb/a for ten years more, but nothing assures us that our dog won’t stretch its leg a bit more. Also, it looks plausible that by constraining production again to the range of 3.2 – 3.5 Gb/a Saudi can keep up with constant production even longer and possibly avoid the terminal decline for two decades or more.
No worries then? At least not for tomorrow. But let me tell you that I’ll keep watching Saudi production regularly and recheck all these models every time another year stacks up to the time series.
Just in case.
Luís de Sousa
The Oil Drum : Europe
Personnel
Editors
Contributors
Peak Oil Primers
Archives
- November 2010 (3)
- October 2010 (6)
- September 2010 (4)
- August 2010 (7)
- July 2010 (6)
- June 2010 (7)
- May 2010 (2)
- April 2010 (8)
- March 2010 (4)
- February 2010 (6)
- January 2010 (3)
- December 2009 (5)
- November 2009 (8)
- October 2009 (12)
- September 2009 (6)
- August 2009 (5)
- July 2009 (11)
- June 2009 (8)
- May 2009 (16)
- April 2009 (10)
- March 2009 (7)
- February 2009 (10)
- January 2009 (15)
- December 2008 (9)
- November 2008 (9)
- October 2008 (9)
- September 2008 (13)
- August 2008 (10)
- July 2008 (14)
- June 2008 (23)
- May 2008 (16)
- April 2008 (12)
- March 2008 (16)
- February 2008 (9)
- January 2008 (13)
- December 2007 (13)
- November 2007 (16)
- October 2007 (22)
- September 2007 (8)
- August 2007 (9)
- July 2007 (16)
- June 2007 (8)
- May 2007 (7)
- April 2007 (7)
- March 2007 (10)
- February 2007 (10)
- January 2007 (12)
- December 2006 (9)
- November 2006 (15)
- October 2006 (4)
- September 2006 (5)
- August 2006 (5)
- July 2006 (9)
- June 2006 (5)
- May 2006 (10)
- April 2006 (9)
- March 2006 (13)
Vital Trivia
License

This work is licensed under a Creative Commons Attribution-Share Alike 3.0 United States License.
Luis, or anyone else who cares to respond, I would like to get your opinion on something I have been trying to get people to pay attention to for some time, but with little success.
A year ago the Center for Strategic and International Studies published a paper on Saudi decline rates.
According to this report Saudi has decreased it decline rate from 8% to 2% by an aggressive drilling program. Other reports have explained how they have done this. In some wells they have plugged the well just above the point where the water mix was too high. But most of the decline was slowed by replacing the vertical wells with MRC (Maximum Reservoir Contact) wells. These wells, once they hit the very top of the reservoir, turn horizontal and branch out like a Christmas tree. This enables them to pull more oil from the very top of the reservoir where there is very little water. This has enabled them to lower their water to oil mix and, at the same time, decrease the decline rate of the field.
But now notice the second sentence I quoted above: These depletion rates are well below industry averages,… Now it is my contention that while the decline rate has indeed been decreased the depletion rate of the well would have to increase. Decline rate refers to above ground factors, or how fast production is dropping. Depletion rate, on the other hand, refers to below ground factors, or how fast the oil left in the reservoir is being depleted.
If they pull oil only from the very top of the reservoir, and if they increase water injection thereby increasing reservoir pressure, they might even get the decline rate to zero, or even increase the production rate. That would give them a negative decline rate. But what would be going on below ground is an entirely different story. The depletion rate would actually be increasing.
It is my contention that by decreasing the decline rate with these super straw methods, they are actually hastening the day when they will have a catastrophic drop of in production. When the water hits those MRC wells it is pretty much all over. I am expecting a catastrophic drop in Saudi production in less than a decade, probably in the next five years.
Their depletion rate is not 2%, far from it. If their natural depletion rate was 8% before then with the aid of these super straws they have increased to about 14% or greater. Now I am not saying that because the original decline rate was 8% that this was also the depletion rate. But that would be a pretty good guess.
Ron Patterson
Ron, thanks for your question. I don’t have enough info to support or contradict your reasoning about the later effects of MRC. But I can confirm you, and as it has been reported extensively on TOD, that the Saudis have drilling heavily in recent times. Offshore the number of rigs operating known, but not in land, still there’s reason to believe that a surge in number of rigs have also taken place.
If you check the post where Euan undergoes a bottom-up analysis on Saudi and compares it to the Dog Leg Up model, you’ll also find that “crash” by 2015.
I’m betting on the Saudis avoiding a significant drop in production when Ghawar reaches its final stages for 3 reasons:
. The Saudis seem to have been very careful managing their fields;
. They haven’t yet started a large scale program of EOR (which should be profitable given the size of their fields);
. There are at least 30 Gb to 35 Gb of reserves in fields yet to be developed.
Luis, thanks for the reply. I cannot locate the page now but on one of the Saudi threads a few months ago there was an article on Ghawar and how they had lowered the water cut and decreased the decline rate. It pointed out that they had overhauled the North Ghawar wells in two ways. They had plugged some wels just above the high water mark, and others they had completely shut the verticle portion off and drilled a short horizontal extension at the top of the reservoir.
If anyone has a link to that paper or thread I would appreciate it if you would post it.
I noticed that my link above leads to the wrong page. This one will work:
http://www.csis.org/media/csis/events/061109_omsg_presentation1.pdf
Ron Patterson
I found it:
http://freeoil.1111mb.com/spe/spe93439.pdf
You will see from this article that the WSO (Water Shut Off) and Horizontal Drilling wells began in 1997. It has been under way for ten years! That is, these super straws have been sucking the oil from the very top of the reservoir for ten years because just a few feet below the water to oil ratio was too high.
Methinks the collapse will be a lot sooner than a lot of people believe.
Ron Patterson
I agree with you since we have no easy way to normalize advances in production which lead to increased depletion rate. This in my opinion is as important as Export Land and as scary.
HL is a overestimate and even the conservative HL plot in the paper is probably still high.
The critical flaw if you will in HL is its blind to the technical advancement that trades increased depletion rates to maintain and increase production rates.
Can we even get a handle on this error ?
I think we can.
1991-2002 gives a URR of 178
The dogleg gives a URR of 241
Subtracting these two gives a known technical distortion
of 63 GB if you agree that the dogleg is predominantly technical advancement.
Now lets make what seems to be a save assumption and assume that the low estimate is also high because of systematic technical advances.
How high ?
A good starting point is that and additional 63GB has been extracted at higher production rates via technical advances that are not as obvious as the dogleg this gives a URR for KSA of
178-63 = 115
So I think 115GB is closer to a reasonable low estimate for the URR of KSA. Now you can consider that they did not develop some large fields and parts of Ghawar for some time so this should be too low by a bit but not all that much.
Considering that we are saying that technical advancements over decades is equal to a 5 year or so burst of technology.
You can see that even if I'm over on the technical portion of the dogleg I'm probably well under on the guess of 63GB
because of additional technical distortion. The positive correction is later discovery/late development of fields.
But even correcting for this for KSA we are still well below the lowest current estimates.
This fits with my gut feeling that technical advances may have resulted in us overestimating URR by as much as 50% even with HL. Also you cannot really trust the reserve estimates since they are also inflated about the same amount because of technical advances in fact they probably have larger errors. So the bottom up approaches even with discovery included have a bigger systematic technical error vs HL. And indeed most of the bottom up approaches come in consistently higher than HL.
So what is this URR that HL is giving. Its a combination of the real URR and progressive technical growth leading to exponential increases in extraction rate at the expense of a higher depletion rate thats not accounted for. So its really two super imposed curves. On the technical side with MRC wells its easy to say we are maxed on technology for primary/secondary recovery so the technical boost ceased over the last 10 years. So we peaked when technology peaked.
The real mid point of URR may have passed a while back in the late 1990/2000.
This systematic error if real is huge.
Next we have a pretty good case for what the worst case scenario is for the future.
1.) Technical advances will go rapidly to zero as far as their ability to increase production rate. This steady increase seems to have inflated production rates by 50%.
Say assume a exponential decline for technical reason.
2.) We may be far more depleted then has been predicted 70% globally seems reasonable. So we have say 10% of this greatly reduced global URR of about 500GB will be produced at a high rate this gives us less than two years before we see accelerated decline rates.
3.) We have Export Land.
Effectively the worst case scenario seems to indicate that we will slowly come of the current peak for about 18 months followed by and accelerated drop down to about 15GB per year
probably a lot faster than expected say 2015-2018. Of this amount export land should drop export rapidly to zero as early as say 2011-2012. They can't go to zero that fast but this puts us easily in to a really strained political situation by 2009.
The good news is this seems to be the worst case possible and even it seems to indicate we probably still have 18 months before we see accelerated decline rates in production.
Hi Memmel,
Interesting comments!
You said that the "real mid point of URR may have passed a while back in the late 1990/2000". Assuming this was in reference for KSA and assuming 1997 as a midpoint of Saudi URR, this would imply that the URR of KSA is about 165 Gb as shown by the lower red line in the chart below. The upper red line assumes that EOR actually increases recovery factor instead of just increasing the production rate temporarily.
Hans Jud thought 160 Gb was a good estimate of KSA URR
http://www.aspo-portugal.net/Articles/SA-Oilprod_field-by-field_V2.pdf
http://i129.photobucket.com/albums/p237/1ace11/4HLAll.jpg
I'm currently assuming URR=185Gb
http://i129.photobucket.com/albums/p237/1ace11/fig10r.gif
click to enlarge, - the source of the underlying chart without the red is from one of Robert Rapier's stories
You also said "We may be far more depleted then has been predicted 70% globally seems reasonable".
The summary of this report by the German based Energy Watch Group by the Guardian
http://www.guardian.co.uk/oil/story/0,,2196435,00.html
says that "the EWG study relies more on actual oil production data which, it says, are more reliable than estimates of reserves still in the ground. The group says official industry estimates put global reserves at about 1,255 gigabarrels - equivalent to 42 years' supply at current consumption rates. But it thinks the figure is only about two thirds of that." Two thirds of 1,255 Gb is 840 Gb. If about 1,100 Gb is produced to date that means almost 60% depleted globally, which is less than your 70%.
The report should be released in full, in just over an hour, from here
http://www.energywatchgroup.org/Reports.24+M5d637b1e38d.0.html
Maybe this report might have a new source/method for estimating Saudi URR!
Thanks Ace !
Yes 1997 for KSA makes sense according to what I'm saying.
And I believe the numbers your presenting from my technical discount concept. They may be a little bit high 10-30GB but
KSA is a bit problematic since a lot of fields where developed late but on the other hand when developed more advanced technology was used since they where developed later. So the numbers your presenting are close to slightly high. My estimate is I feel a good guess at the minimum.
This leaves about 30GB that needs accounted for. I think a lot of these are still ghost barrels.
The key point is no method presented to date as adequately discounted our advances in technology allowing increased extraction rate. Using a known period when reserves did not change much but technology was applied i.e the infamous dogleg indicates that the technology effect may account for 50% of the increase in production rate. The reverse is we are depleting the oil supply 50% faster today then we where say 30 years ago.
HL is actually measuring two entangled effects. Technical advances and actual depletion. The relentless technical advances hide a significant amount of depletion as we have gotten better and better at keeping the oil production high.
HL gets the peak date right but it can be off by as much as 50% on the URR estimate to the high side.
For primary and secondary recovery MRC or Christmas Tree wells aka super straws represent a maximum extraction method we really cannot do much better. The current peak is then actually a maximum in our ability to reasonably apply technology to maintain and increase extraction rates. The world peak i.e 50% of URR is in the past I'd guess we hit 50% of global URR in 2001-2002.
Thanks for the numbers Ace and I really think people should seriously consider this argument. On of its strengths is it answers the people that claim technology will save us.
It already has.
Our worst case Saudi scenario (fastest decline + fastest rate of increase in consumption) was that net exports hit zero in 2024, in 17 years (middle case was 2031).
In regard to worst case URR's based on HL, the lowest estimate I could come up with is about 150 Gb (C+C), which totally discounts the recent dogleg up. Note that including NGL's would increase the estimate. Looking at just C+C, my personal guesstimate is between 150 and 200 Gb.
In any case, if we look at the totality of the HL data set from 1991 to 2007, it certainly looks like 2003, 2004 and 2005 are outliers, which, as I have pointed out ad infinitum is what we saw on the Texas data set.
I should also point out that Khebab and I did not discount anything in the May, 2006 Texas/Lower 48 paper. We used production data from 1991 to 2005, and the Texas model, to warn that Saudi Arabia was on the verge of a production decline.
It all comes back to Saudi as the "swing" producer-- meaning we can expect all data based upon KSA's "swings" in production to also swing back and forth as to URR.
As for me, I see induced swings in production in connection with the 2003 invasion of Iraq; and again in March 2004 and March 2006 to drop prices in the USA in time to influence our elections (is there someone who doesn't believe KSA cares about who controls Congress and the White House?).
I would suggest that a view of KSA production that identifies those periods when we can reliably believe that KSA was maximizing production (like in 1991, 2003, and early 2004 and 2006) based upon external events, could provide the most reliable set of data points. In every other case, the data could be because KSA was "swinging."
I would also suggest that the limited surges in 2003, 2004 and 2006 would likely be not a sustainable maximum, but the absolute maximum-- if KSA could have bumped production more in 1Q 2006 I believe that they would have, to give their BFF GWB more leverage in Congress. Just remember what happened to gas prices between Aug. 15 2006 and Nov. 1, 2006.
Regardless of what the actual number is, though, the USA should be acting, from a policy standpoint, as if the lowest number were the actual number, at least to generate some margin of safety.
And 150 may still be high since its not discounting more gradual changes in technology. The dogleg period is obviously the result of technical changes not some sudden large discovery and it obviously causes HL to produce a higher URR estimate.
Less obvious has been the continuous technical advancement over decades that has exactly the same effect. Inflating the URR reported by HL. This is because the URR determined by HL is actually two variables the rate of technical improvement in extraction capability and the real geologic depletion rate. Technical improvements are a two edged sword since they increase depletion rate but in general they make the final decline far steeper causing a large systematic overestimate of URR until technical advances no longer help.
The technology to extract oil has increased at a astounding rate topping out with the MRC wells in use today for primary and secondary recovery. We are still advancing to some extent in final recovery processes.
Assuming that this technical advance is effectively at its peak over the last few years means that we are no longer getting large production rate gains from technology.
The actual geologic peak was passed some time ago probably around 2000-2002 for global oil production. Increases in production rate since then have been because of aggressive technical extraction. Over the last few years we hit peak technology the peak production rate has nothing to do with the actual URR.
HL is still valid for predicting peak production but its URR estimates are probably invalid. The US happens to work primarily because technological advances in extraction within the US have been relentless. If we had peaked in technology earlier we would have seen that HL estimates for the US where to high.
These dogleg regions are one of the few ways we can get a good handle on the technical effect on extraction rate. And they point to a fairly large technical boost factor on the order of 50% higher extraction rates vs stagnant technology.
This means the real depletion rates are up to 50% faster than prediction by HL or more correctly the URR may be over estimated by up to 50%.
Now the flip side of the coin is that we can now probably maintain a high production rate to about 80-90% of URR but the decline rates are incredibly steep.
The technical peak then production a production profile close to a square wave on the post peak side.
So HL is still valid for determining peak since it is measuring both technical advances and real depletion rates.
Its simply a coincidence that the lower URR estimates also concide with time periods that prices where low or declining and thus technology was not being applied at a feverish pace. So these quite periods are a good time to calculate the real geologic URR.
This means HL used during times of stable low or falling prices is able to get the real URR since technical advances and aggressive drilling are much lower during these times.
KSA is tough because they actually shut in a lot of good production and this messes with the numbers.
If I'm right I find it funny that peak oil production is actually related to technology and has little to do with the geologic peak except its well after we have passed geologic peak. And its no surprise that the two are not offset by all that much since geologic declines are driving the technical advancements but the critical factor is they lead the technical decline in production rate. But its critical to understand whats happened the last few years is we have hit peak technology and can no longer mask the geologic decline.
Technical peak is effectively a ceiling or flat line and its boost effect goes almost directly to zero governed by the deployment rate. Most of the NCO's have rejected advanced methods in the last few years.
Look at the average production rate vs geologic depletion over time and you see we have been highly successful in keeping production rates high at the expense of faster depletion. Almost every method used to account for URR falsely includes this as a higher URR. No one has correctly subtracted the effect.
So in closing it seems we are actually 5 years or more post geologic peak and have lasted this long on a last ditch technical burst. If true then we will soon see some fairly steep global decline rates generally inline with natural depletion rates for fields that have been extracted using advanced technology these can be steep on the order of 15%.
This probably equates to the decline in overall production rate quickly approaching 5-10% globally over the next several years.
Peak Oil production rate has nothing to do with 50% URR except that it happens well after we have passed 50% URR.
"they haven't yet started a large scale program of eor"
well, i think if you dig through the analysis of ghawar, at least, you will conclude that ghawar is indeed gravity stable. i dont know of any eor method that will provide much improvement on gravity drainage (or in this case gravity stable pressure maintenance by water injection).
From an analysis of what is visible on Google Earth, I arrived at the following:
* = data incomplete
These are just rigs: many other sites being prepared for drilling, as well as recently completed wells, are visible. Most of this represents activity on a single day in May 2006. Unfortunately, there are large areas of Shedgum, Hawiyah, and Haradh covered only at low resolution. Also, except for a sliver on the eastern fringe where a few new water injection wells were being drilled, none of the Haradh III drilling is visible as the images there date to 2004.
Further analysis shows that, while there were some workovers, most of the wells going in were in fresh sites, though sometimes right in the middle of an array of existing wells. From what little KSA has published, their goals are 1) to bring in dry production to bring down the overall water cut going into a given GOSP, and 2) to minimize stranded oil pockets. Multilaterals are not drilled to the same level; they will place a well on the fringe of the dry area and drill some of the arms down dip into wet regions and some into dry. They fully expect that some will water out before others--those will be shut off.
Similar efforts are visible in Abqaiq, and I would say it just means using new technology to more fully (and economically) deplete a field. The real problem with Saudi Arabia is that there is no evidence of discoveries sufficient to replace what they've become used to as it depletes more and more. Perhaps they are just delusional about what is out there.
Joules - this is amazing! 18 rigs drilling Arab D oil seems quite a lot to me. Can you remember how long it takes them to drill a well - and translate this to rough wells / year?
9 rigs drilling Khuff gas is a lot - and I've gotten sceptical about them adding NGL to the oil count. No doubt a fair proportion of Ghawar "oil" is now NGL and this serves to mask the state of depletion of the Arab D honest to God oil.
Some months ago you sent me an image of Abqaiq - is it possible to have same with an accurate scale bar attached?
Thanks, Euan
Here you go, Euan:
Click on the image from a large version. The white vertical line is 10 km. The area of the enclosed area is 400 km^2. The green diamonds are rigs and the green dots are "new" wells.
As far as rigs go, here are excerpts from the Saudi Aramco 2006 Annual Report:
I suppose one could derive the rig residence time from this data.
I should mention here again my interpretation of what's happening. No certainty, but it fits the facts and it feels right to me.
In regard to Abqaiq, Ain Dar and Shedgum, what I think is happening is Aramco is progressively redeveloping the fields with MRC, and then shutting them down. We know from previous published data that with the depleted fields production from an MRC well only lasts a short time.
As they close down these fields (and eventually Uthmaniyah) they are starting up new fields elsewhere with the aim of maintaining a flat production profile out to 2018-2020. Somewhere around the 8-9 Mbpd mark. Euan has a graph that shows just this if you make certain assumptions for the reduction in supply for Ghawar. Its too perfect to be by chance.
Why do this? Well shutting in your best producing fields provides you with surge capacity, all the way up to the 12Mbpd that Aramco claims. You can start them up, and suck that sweet free flowing oil fast when you need to. It places SA where they want to be, in control of swing production.
Of course, you can't produce for long. Its not real fulltime capacity. But you just need ~100 days for it to count under the rules and it allows SA to meet their stated aims.
Thanks for adding this garyp, very good observations on MRC.
I'd contend that Euan's forecast of 240 Gb is as probable as Colin Campbell's 280 Gb. In the latter case that plateau could last even longer.
Gary,
Here's why I don't buy your MRC shut-in theory. May of the new MRC wells, in 'Ain Dar and Shedgum at least, are being put in wet areas with laterals extending down-dip--they are designed to get the oil before it gets left behind by the retreating flood front. Given that they probably aren't completely shutting in the whole field, it is still be depleted and the flood front is retreating--thus negating one of their stated aims.
If they want to throttle something back, it would make more sense to do this with Haradh III or even just stop production in problematic areas like Haradh I.
My view is they do indeed stop producing those fields, in order to shut in the last dregs of production as their 3Mbpd surge capacity.
If you take the assumption that they are not totally lying then 12Mpbd has to be possible to a certain extent. Given that we don't think they can achieve it for years at a time, this theory fits the facts. Abqaiq, Ain Dar & Shedgum are the highest quality reservoirs and are most likely to be able to be turned on to +3Mbpd levels quickly. Better to hold them back and maintain that surge producer capability much longer.
Haradh doesn't work since the reservoir quality is much lower, its capacity isn't high enough, and its needed to provide the base load.
In the end the only way to find out is to determine if the northern GOSPs etc are still working to full capacity. If not then either N Ghawar is in very sharp decline, or this 'late surge' hypothosis is in effect.
RE new Saudi gas wells and ELM.
It might make good sense for KSA to use their extensive gas reserves for domestic energy needs thus offsetting a good deal of domestic use of crude oil. This would tend to go counter to the ELM (Export Land Model) in that more crude would be available for export than would be otherwise were it not for massive NG development.
Right idea, but in the short term at least, wrong direction.
Because of shortfalls in domestic natural gas production, I am aware of a report that indicates that Saudi Arabia will have to divert 500,000 bpd of liquids production in in 2007 and 2008 to power plants and desalination plants. Because of this report, I was guessing at a 10% increase in Saudi liquids consumption in 2007. Note that Rembrandt put the first half of 2007 increase in consumption at +9% year over year.
Because of the natural gas situation, Saudi Arabia is looking into importing coal and into building nuclear power plants (and I assume that they are looking into LNG).
Thanks JB, fantastic!
Euan,
check out the pattern of the lateral legs in the paper that Darwinian linked to. Their complexity is astounding, they look like tree roots. It would be impossible to estimate drilling times on patterns like that without an exact map of the patterns and distances of the legs.
These must be being completed open hole without any kind of liner.
Darwinian, these kind of patterns might be improving the efficency of the original production by making sure that the oil comes out of all areas of the reservoir and preventing any area of the reservoir from being pulled too hsrd. There isn't a gas cap on the Arab D reservoir in these wells, so producing them slowly and evenly will hopefully prevent one from forming. The paper stated that no tertiary techniques had been used yet in this field. I wonder how well miscable CO2 would work?
Bob Ebersole
In the discussion at the CSIS meeting in 2004, if I remember correctly the Saudi folk said it took 63 days to drill a well. But this doesn't give the total picture.
'Ain Dar certainly has gas caps which resulted from gas injection in the late 60's and early 70's.
Joules how do I tell when a particular Google Earth image was taken?
Xeroid.
Open up the "Layers" panel in the lower left, scroll to the bottom, and open the Digital Globe folder. You will find folders for each year containing DG images for the area being viewed. Checking the box for an image displays the approximate outline for that image on the current GE view. By matching up the checkerboard pattern on the GE view with the best fit DG image, you can identify which image is being used and the date. You can easily rule out the DG images with cloudcover, but do note that the most recent images are not always used.
Joules,
Thanks, it's easy when you know how!
Xeroid.
From looking at figure 2 it appears that even if the URR is 250, then Saudi will peak at about 125 which is where they are now. So the debate seems to be, did SA peak a couple of years ago or are they peaking now? Not much of a practical difference imo.
Where's the peak? I see flat production.
The EIA showed 2005 C+C Saudi production to be about 9.6 mbpd, about 9.2 mbpd for 2006 and about 8.6 mbpd for 2007 so far this year.
C+C production in Saudi peaked in 1980.
Well, perhaps I misunderstood what you meant in the captioned comment.
The 2005 to 2006 change in Saudi C+C production was -4.2%. Depending on what happens in the fourth quarter, the 2006 to 2007 change in C+C production will probably be between -5.5% and -6.5%.
Your statement:
The Dog Leg Up model forecasts Saudi production above 3.5 Gb/a for ten years more
I believe he was instead referring to Fig 3 which has the Dog Leg Up model peaking at 4.0 Gb/y roughly now and declining to 3.5 Gb/y in ten years.
The differing interpretation may be the difference between production capacity and actual production.
As noted in the Drumbeat thread, I have the capacity to date Julia Roberts.
Jeffrey - you get a mention here on Platts
http://www.platts.com/weblog/oilblog/2007/10/report_from_aspo_dark_cloud...
Stuart and I get a mention too - but that's behind a pay wall.
Also came upon this table showing Saudi production data up in September. This is a huge relief - as many aspects of this conference have been so glooooomy.
http://www.platts.com/Oil/Resources/News%20Features/opec/prod_table.xml
And I just got the Juila Roberts joke:-))
Nice meeting you.
Euan,
It was good to meet you and the other TOD folks. Thanks for the Platts link. You can see why I wanted to end with some kind of positive spin (a plug for Alan Drake's talk on Friday morning).
I think that it is pretty clear that most estimates of URR for Saudi Arabia are basically falling within overlapping probability ranges.
I'm going to try to get a video clip of my debate with Dr. Economides. It was a pretty remarkable discussion regarding Saudi production.
So this is the latest bit you will be repeating endlessly.
He also has the capacity to build a pond-front cabin for his family on the Rat's land, should the need arise, a capacity you lack. Alan from Big Easy has the same invite.
Rat
Luis - at the end of the talk I gave on Wednesday, an elderly gentleman came to talk to me and thrust a paper into my hand pointing to his forecast for Saudi peak year in 2011 - which concurred with what I had just presented. I thanked him and flicked through the paper observing many interesting tables and charts.
It was only later that I realised that this paper was by Richard Duncan and Walter Youngquist - and that the latter, with whom I had just spoken, was one of the first recipients of the ASPO USA MK Hubbert award. Luckily I had the chance to talk at length with Walter later on - when he gave me a copy of the latest Olduvai paper by Richard Duncan.
This paper "Encircling the peak of World Oil Production" was published in 1999, and this has really caught my attention - that these guys 8 years ago forecast a Saudi peak in 2011. Their URR estimate is 273 Gbs.
OK - that's the good news. I feel as though I maybe have here a new and reliable source. Their peak year for world production is 2007!
I still need to read the paper in detail - but hope to do a short post on this to bring it into the TOD / internet domain.
Now for your post - an interesting summary. The main point I'd make is that it is not just the discovery cycle that is important in Saudi - but the choices they have made in the development cycle too - e.g. fields like Khurais being developed more than 50 years after discovery. Its great work getting all this field data into the public domain. I'd note that the split between the high and low estimate is 270Gbs.
When I started writing this post I had a completely different idea, but when I factered in the Dog Leg Up signature of a constrained profile and Khebab’s database I came to completely different conclusions. Colin Campbell’s estimate seems more and more likely to me now than any other produced today by HL.
Khebab’s database is still incomplete but even with the lowest of estimates URR stays put at 180 Gb. By toggling just the ultimate of Ghawar (say, considering NGL production and EOR in later field life) you’re easily at 220 Gb. When Khebab publishes the updated version of his database this will all became very clear.
You’re absolutely right Euan, the Saudi politics of Oil Production is the antithesis of the Thatcher Politics. They seemed to have always preferred to extend constant levels of production into the future than capitalizing immediately. I understand that this looks awkward for some people here in the West, but that’s the way it is.
Maybe because they live in a desert and without energy to exchange for food or use to desalinate sea water they are all dead? They need their oil to last forever!
In their situation what would you do? ... conserve your resources or exchange them now for a piece of paper that promises that somebody's grandchildren will pay for the oil in 30 years or so?
Would you trust your grandchildren to pay at sometime in the future for your consumption today, let alone somebody else's? Have you asked the grandchildren what they think about a plan like that?
I think it is wisest to assume that the Saudis are sensible and will act in their own best interests.
Xeroid.
This is garbage. If there is one thing we know it is humans' inability to predict 2 days into the future.
Yet once again, the oil drum produces a perfect curve that slopes perfectly down from right now. This very second.
Not taking into account that every prediction you guys have produced so far has been wrong.
Staniford, ace, westexas. All wrong.
Now we have Luis de Sousa. Great. Which is it this time? Top down or Bottom up?
I swear you guys are starting to actually get funny. I do a back of the envelope calculation every June for world oil production. It never takes me more than 5 minutes. I'm always spot on. There's only 6 countries I can't score. But my guess always beats yours. Why is that?
Why can't you guys figure it out?
Fresh from ASPO, right? Drinking all the way home.
Thanks for the Troll graphic, Wharf Rat. I'm sure the real thing isn't as cute as your picture,though.
Bob Ebersole
As Colin Campbell is fond of saying,"All data are wrong, the question is simply by how much."
And "All your base are belong to us"
As is usual, this echelon takes it up the rear.
Not your usual impartial analytic self. Playing sides?
The analysis lies in the parsing of the pun. Many TOD'ers are partial to puns.
I think the best estimation of URR can simply comes from adding up all the discovered barrels of oil, because all oil that has to be produced need first to get discovered. Once we have total discovery we can have a rough calculation of peak somewhere between 50% and 60% because in my knowledge every country that ever peaked did so in that range.
About what can technology done in shifting peak further, I think as a rule of thumb one can say that natural peak in at 50% with technology shifting it forward upto 60%. May be some exotic technology able to push it towards 70% in future.
Ofcourse, the downside of technology is that when peak comes the decline rate is much sharp. In a poetic sense one can say that if you let the titanic sink naturally you may expect to get hold of some wooden furniture in the titanic to hang on before the rescue comes, therefore remain alive. But if you try to close that whole in titanic by consuming the wooden furniture of titanic using technology when all the furniture consumed the ship would finally sink and then you would not have anything to hang on.
WisdomFromPakistan,
Thank you for coming online and contributing to The Oil Drum. Two-thirds of the people on earth live in Asia, yet we have very few people contributing from Asia. The peak in fossil energy production concerns us all, and so does climate change. Any real solution will have to be global.
In the United States (my citizenship) we don't get much information about Pakistan, or any other country on the Asian continent. I think that's the reason Americans often appear to be arrogant, little is printed that reflects the true attitudes and aspirations of the other peoples on the planet, and we are so caught up in ourselves that we can't even see the problem. Its extremely dangerous for the whole world, we need to listen to each other and work for our common goals.So, thanks for posting!Bob Ebersole
The problem is that the recovery estimates made from a discovery include technical advances inflating URR.
What your talking about is OIP ( Oil In Place ) and this number has a huge uncertainty especially at initial discovery.
OIP/URR is refined as a field is developed but both measures are bad about including technical effects and suffer from inflated estimates.
I think the only correct estimate is OIP calculated from seismic/imaging data but I don't know how well these calculations work. In the last decade we have made some huge advancements in this area so we may well have good estimates of OIP for fields discovered recently. This would need to be coupled full life cycle extraction info.
So I think we can actually get a really good answer today about OIP but this really does not do a lot of good since URR estimates are technical and +/- 5-10% makes a big difference is the post peak production profile.
At the end of the day modern extraction methods result in a field going quickly to peak production staying at a plateau followed by a steep decline. I'm simply saying that this profile is enough to shift the global production profile off a Gaussian. The exponential increase in technical ability hides this shift until we abruptly hit max tech with MRC wells. The key point is technical advances have effectively hit a brick wall and in fact most NCO are rejecting the latest technology so the technology effect is probably effectively zero now.
This might get lost in yesterdays drumbeat so I'll post it here. The UKs Guardian newspaper is covering an article by a German Energy group which states peak was in 2006:
http://business.guardian.co.uk/story/0,,2196436,00.html
Quite a claim to be making a major story in a UK broadsheet
Drip ... drip ... drip ... MSM gives a bit more every day.
So, when do we expect the public to panic and go and top up their tanks?
Or the stock market to panic?
Xeroid.
Hello all. Re Guardian article:
Reports just published at the energywatchgroup homepage:
From :http://www.energywatchgroup.org/
Organisation ( in German)
http://www.energywatchgroup.org/Organisation.22.0.html
Full report here: http://www.energywatchgroup.org/fileadmin/global/pdf/EWG_Oilreport_10-20...
And executive summary here: http://www.energywatchgroup.org/fileadmin/global/pdf/EWG_Oil_Exec_Summar...
Kind regards/And1
The Guardian article
Steep decline in oil production brings risk of war and unrest, says new study
http://www.guardian.co.uk/oil/story/0,,2196435,00.html
mentions "Output peaked in 2006 and will fall 7% a year". However, the summary refers to "several percent" decline:
Conclusion
The major result from this analysis is that world oil production has peaked in 2006. Production will start to decline at a rate of several percent per year. By 2020, and even more by 2030, global oil supply will be dramatically lower. This will create a supply gap which can hardly be closed by growing contributions from other fossil, nuclear or alternative energy sources in this time frame.
The world is at the beginning of a structural change of its economic system. This change will be triggered by declining fossil fuel supplies and will influence almost all aspects of our daily life.
Climate change will also force humankind to change energy consumption patterns by reducing significantly the burning of fossil fuels. Global warming is a very serious problem. However, the focus of this paper is on the aspects of resource depletion as these are much less transparent to the public.
The now beginning transition period probably has its own rules which are valid only during this phase. Things might happen which we never experienced before and which we may never experience again once this transition period has eded.
Our way of dealing with energy issues probably will have to change fundamentally.
The International Energy Agency, anyway until recently, denies that such a fundamental change of our energy supply is likely to happen in the near or medium term future. The message by the IEA, namely that business as usual will also be possible in future, sends a false signal to politicians, industry and consumers – not to forget the media.
http://www.energywatchgroup.org/fileadmin/global/pdf/EWG_Oil_Exec_Summar...
Main points:
Reserves: 854 Gb (instead of 1255 Gb from IHS)
2006 81 mb/d
2020 58 mb/d (Bakhtiari's WOCAP model was 55 mb/d)
2030 39 mb/d
The study is from Dr.Zittel of LBST (strategy and technology consultants for sustainable energy
and transport systems)
http://www.lbst.de/index__e.html?http://www.lbst.de/welcome__e.html
He had already published this article
The Countdown for the Peak of Oil Production has Begun – but what are the Views of the Most Important International Energy Agencies
in 2004 here: http://www.energybulletin.net/2544.html
Matt asked me to add this illustration from the Energy Watch Group report:
"Output peaked in 2006 and will fall 7% a year"
The graphic shows only a 3% a year decline.
Thanks oilmanbob for those kind words.
True that two third of world population live in asia. More true that 40% live in just two countries india and china. The region is extremely dense 300 people/sq km whereas in usa its just 35 people/sq km. In pakistan its 0.4 acres arable land per person, in india 0.35, in china even less. This part of world is low in oil and gas resources except some in pakistan. For sustainability atleast 1 acre arable land is needed per person post peak, thats with indian level diet (mostly vegetable). Even today, when we enjoy benefits of green revolution we are net food importers, God help us once we run out of farm chemicals.
Obviously, peak oil & gas while being an economic concern for americans is far far more serious for us here. A 1970 style back-to-land movement can work and be successful in usa given its high per person arable land ratio but we have no such option. Another issue is that we (indian and chinese together) are eight times that of american population, so we not have option of mass immigration to greener fields either. There are not enough empty green fields around us anyways.
Far east is small and not a good food producer. Middle east is desert and even more over populated than us. FSU is far too cold though it do have some spare land, same is the case with afghanistan. Mongolia and large siberian part of russia are places you would never wish to even fly over in an airplane.
In july 2007 a newspaper quote officials from SSGC the public company that own all gas reserves, production and infrastructure in pakistan that we have only 3 years of gas left. In western port of gwadar there are already plans undergoing to purchase gas from iran but america is against this as it supply money to iranians.
India is critically short in gas, obvious with the fact that gas business owners are very rich people there, due to high gas prices.
As a final note, we not have army big enough to loot other people's oil and gas as a last resort. We (india, pakistan and china) have nukes though to kill each other when resource scarcity hit us to further reduce long term fertility of our small lands.
Hello memmel
A question and few suggestions.
Is Oil in Place a synonym of URR?
When an oil reservoir is discovered I think there is estimation of total oil that is there and another estimation of how much of it can we extract under geological, technical and economical constraints. That I think is the URR, Ultimately Recoverable Reserve. It should be different than the oil that is in ground in that reservoir which should be called Oil in Place.
So, it would be like OIP is 1 billion barrels wheras URR is 250 million barrels, the ratio would be 25%.
As time pass and technology improves that percentage I guess keep on increasing, say to 30%. That is what I think is the phenomena of reserve-growth. Please correct me if I am wrong.
Ok, so on basis of initial OIP estimation and most recent URR to OIP ratio we can still have a rough estimation of total URR.
That increase in URR due to improvements in technology I think should be considered separately than extraction rates. Its because improvements in extraction rates not increase URR, it just push the peak further and the cliff steeper.
Ok, all that is a very very lay man's approach :).
No, OOIP, or Original Oil In Place, is total oil. URR, Ultimate Recoverable Reserves is the percentage of OOIP that can be recovered, usually around 30 to 40%. I think the recoverable percentage is higher for a sandstone reservoir than for a carbonate reservoir.
Ron Patterson
Your question has been corrected what you want to know is OOIP
Original oil in place. URR is ultimately recoverable reserves.
URR includes a technical factor. Until recently OOIP estimates are questionable. With the advanced seismic technology developed over the last decade I think OOIP measurements are probably very good but in general they are not public instead URR is reported. Also its not clear if our older reserves have been fully re-evaluated using the latest technology.
And yes the assertion is that technical advances have resulted in general in a increase in the extraction rate not a increase in URR as is often reported. This leads to a significant distortion from a Gaussian. Resulting in surprisingly steep decline rates post peak.
Next the peak itself is actually more a technical peak with MRC approaches representing the final technical advance that can cause significant increases in extraction rate.
And I still think this URR is high or probably more correct the expectation of how much of the remaining 30% that will be recovered at a high extraction rate is erroneous.
Stripper well extraction should be discounted even though overtime it can be a significant amount of oil. The extraction rate is a small percentage 1%-5% of the original field production rate. I've read that about 2mbpd of oil production in the US is from stripper wells.
I don't think this is relevant for world peak.
I recently found this analysis in an article written by M. K. Hubbert in the mid 70's:
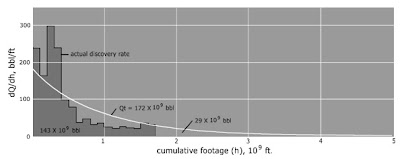
I thought it was interesting because IIRC I haven't seen this type of analysis done for world URR. Is the data for cumulative footage drilled and discoveries per foot of drilling available? If so, has anyone already done this kind of analysis? It would be very interesting to see where the resulting estimate of world URR would end up.
It's not necessarily a more accurate method than the logistic curves, it's still basically an exercise in curve fitting, but it could be an important tool for validating estimates derived by other means.
Cheers,
Jerry
This is a great find, IMO. I think it is a good companion piece to the maximum technically feasible exploratory drill depth per year:

In the past, I have made the assumption of finding oil is constant with depth, but that the dispersion of the probes monotonically increases with depth. Saying the histogram is constant means that I have to give a finite bounds to the depth, which is not that difficult to justify. As a bottom-line, this means that the cross-section of technological advancing probe depth with a depth profile of reservoirs of oil has a sweet spot, or peak, that occurs at a fixed historical point in time.
http://mobjectivist.blogspot.com/2007/06/finding-needles-in-haystack.html
So the "cumulative depth" shown in Jerry's post does not exactly tell us how deep the oil is found, only that of probes that go deeper and deeper but that more and more often come up empty.
I think I could do an equivalent chart like that shown by Jerry's Hubbert find; it won't exactly come out as an exponential, but it would certainly be instructive.
Thanks WHT, I was hoping you would pick up on this. I've been greatly impressed by your work, especially on the cubic discovery model, and I look forward to seeing what you can do with this new analysis. Woot!
Cheers,
Jerry
No, thank you.
The shape of that curve you found by Hubbert has the characteristic of a cumulative dispersive which removes the time dependent growth term. For the solution, we get:
dD/dh = c * (1-exp(-k/h)*(1+k/h))where h is 1 dimension.
I did a quickie overlay with a scaled dispersive profile, which shows the same general shape.

The k term has significance in terms of an effective URR as I described in the previous link but I will have to explain more fully later (its getting kind of late). I eyeballed the scaling as k=0.7e9 and c=250, so I get 175 instead of the 172 you get, which is close.
Outstanding! That's a remarkably good fit. The 172 is Hubbert's estimate, all I did was copy the graph from his article published ca. 1976. It would be interesting to see how this fits with US drilling/discovery to date, roughly another 30 years data.
Cheers,
Jerry
The dispersive model has a heavier tail than the exponential so it is a bit more optimistic in the out-years. I agree, it would be interesting to get more recent data, and of course to see the corresponding global data.
Jerry, do you have the original ref or hyperlink to the Hubbert chart?
Based on this article:
http://graphoilogy.blogspot.com/2006/03/m-king-hubberts-lower-48-predict...
Which gives a Qt for the lower 48 of 196 Gb using data to 1970, essentially the same data range in the Hubbert article, it would seem this new analysis is actually well on the conservative side. Although, Hubbert refers to the "conterminous" US, and I'm not at all sure how that differs from "lower 48".
The original article was published in an energy textbook from 1976, a book which I just happened to stumble on recently while idly browsing the engineering stacks at my local Uni. (don't ask).
I hurriedly made a few photocopies which is what I used to scan, retype and post the excerpt above. I'm on my way back to the library today to make better copies, and I'm already in the process of retyping the entire article, so you can expect to have a full pdf version in your hands by weeks end.
The article is long and detailed, with several new insights into Hubbert's thinking that I haven't seen discussed in the peak-oil community. I would like to write an article for TOD with extensive excerpts, but I would need help with updating the graphs with more recent data.
Cheers,
Jerry
Note that the post-1970 cumulative Lower 48 production was 99% of what the Hl model predicted, using only production data through 1970 to generate the model. The following article discusses both the Lower 48 and Russian case histories:
http://graphoilogy.blogspot.com/2007/06/in-defense-of-hubbert-linearizat...
Monday, June 18, 2007
In Defense of the Hubbert Linearization Method
By: Jeffrey J. Brown
Use OCR if you have access to a scanner. I have used that effectively several times for this kind of transcription.
That's a good idea. I'll give it a shot, but there's so many tables, graphs and equations the returns might be minimal. I don't really mind doing the work, and besides it will give me a chance to learn the finer points of OpenOffice.org.
On an unrelated thread, I was browsing Deffeye's books at the library and I noticed he brought up your argument that the logistics of population dynamics applied to oil production is an odd couple at best. His reply was:
That's when I was struck with a bizarre notion. What if you pretended that the oil didn't exist in the ground until the well was drilled? Don't treat the oil as a field waiting to be discovered, but treat each well as an entity that may or may not be 'born' i.e. begin producing oil. You might even be able to weight different geologic strata, or already producing fields for 'fertility'. Would that give you the birth and death dynamic as a basis for the logistic curves?
Just a thought.
Cheers,
Jerry
I've been saying exactly this for a long time.
Maybe since Deffeye makes the same observation it will hopefully carry more weight.
If you agree with this concept then you can see my extreme concern about technical advances doglegs and URR and post peak decline rates.
Whadya know (he says to himself), I found the same Hubbert chart in an old article I OCR'd a few years ago. From a fishing magazine no less!
Take a look at this link, near the end:
http://mobjectivist.blogspot.com/2007/10/blogorithm.html
-----------------------------------
As for the birth-death analogy, nothing ever dies, otherwise if it did it would have to be removed from the cumulative. But we don't want to remove anything from the cumulative, as this gives us the URR value. So we are left with a "birth model" by itself. So how do the dynamics ever equilibrate?
In fact, the cumulative equilibrates, which is not the way we typically think of population dynamics. It would be as if rabbits lived forever, but they would stop reproducing only as they reached some fixed large number. Its non-linear, hard-rail constrained gobbleygook IMO. The hard-rail constraint is caused by the birth rate slowly going to zero. Why does it go to zero in this ramped down way? Because we can solve that particular equation, that's why.
Nice find! I vaguely remember running across a reference to that fishing article some time ago, but I had forgotten you posted it in it's entirety. Did you need permission from the publisher? Would you be willing to host the Hubbert article on Mobjectivist?
---------------------------
My understanding, albeit limited, is that the population hits an environmental constraint. A critical resource is used up, the carrying capacity is degraded, and the population crashes to a level that can be supported by what's left.
That would mean the OIP would be the resource 'supporting' the population of wells, and as it depletes the wells would die-off. But that brings us right back to needing the URR to calculate carrying capacity... and around and around we go. How bizarre that a population dynamic would be such a good fit to something that isn't a population. Go figure.
Cheers,
Jerry
I might as well repost them here.


Fig. 5 Average discoveries of crude oil per foot for each 100 million feet of exploratory drilling in the U.S. 48 states and adjacent continental shelves. Adapted by Howard L. Baumann of Fishing Facts Magazine from Hubbert 1971 report to U.S. Senate Committee. "U.S. Energy Resources, A Review As Of 1972." Part I, A Background Paper prepared at the request of Henry M. Jackson, Chairman: Committee on Interior and Insular Affairs, United States Senate, June 1974.
Fig.6 Estimation of ultimate total crude oil production for the U.S. 48 states and adjacent continental shelves; by comparing actual discovery rates of crude oil per foot of exploratory drilling against the cumulative total footage of exploratory drilling. A comparison is also shown with the U.S. Geol. Survey (Zapp Hypothesis) estimate.
-------------
The other weird thing is that the birth rate is proportional to the cumulative pseudo-population, which is counter-intuitive to the way we think about biological populations in general, where entities die off and the birth rate is only proportional to the current population.
The Hubbert article is available. 20 pages covering 7000 words, 19 graphs, 8 equations and 5 tables. If anyone would like to read it send an e-mail to jerrymcmatqwestdotnet with the words hubbert article in the subject line and I'll send you a link to the pdf.
Cheers,
Jerry
Interesting approach. So given this approach I would be saying that despite the decreasing quality of the fields we have been able to not only keep production rates high but increase them using advances in technology.
The decrease in oil columns and increasing depth with increasing production rates points to a significant effect from advances in technology.
So the metric to highlight technical advance would be average oil column vs production rate. As the oil columns have thinned worldwide in both older fields and new fields we have not only kept production up but increased it significantly.
A MRC well can probably get a high production rate out of a oil column a few meters high.
Edited to add the depth of the find its two parameters the length of the oil column in the fields and the depth of the finds. The fields should get thinner and deeper with time.
Jerry, nice stuff indeed. I for one haven’t seen this kind of analysis done before; Hubbert was indeed a great researcher.
I’ve never searched for this kind of data for the world, but I doubt it exists in a reasonable accurate form. See how few dots there are in the chart posted by Web.
There’s another useful technique for estimating URR that never had much attention on TOD: the creaming curve. Jean Laherrère for instance often uses this technique – he gets a good picture of the URR with the creaming curve and only then fits a logistic curve to production.
Thanks Luis, I'm a huge fan of Laherrère. I especially like his cumulative discovery and production graphs which, if I understand correctly, seem to answer the question "what about reserve growth?" by treating it as just another form of discovery. This new Hubbert article, which I'm in the process of re-typing, has a detailed discussion of just that kind of analysis, so stay tuned for more good stuff.
Cheers,
Jerry
The three years in question in the dog leg up ('03,'04, and '05) were aberrant years in what should be steady state production data points for an HL fit to determine URR. 2003 was a Gulf war year. Aramco has always ramped production to non-steady state levels to meet demand surges (the 70's) and Gulf wars ('91 and '03). 2004 and 2005 had the "super straw" fishbone drilling, an aberration from the smoother, more geophysically pure extraction history that a Hubbert curve describes. If the dog leg up in these three years were simply an opening of the throttle from the 70% restrained production scenario of figures 5 and 6 above, then we shouldn't be seeing the accelerating wilt in production from '05 to now with oil prices where they are.
One way to put it is that HL works best if both the technology used for extraction is constant and the drilling campaign is constant. In a lot of ways this is intuitive since HL is using production data to estimate URR. Technical artifacts generally result in a inflated URR estimate.
The dogleg effect is a way to isolate technical changes from real URR increases. The problem is this indicates that technical changes are a big factor.
So we should really focus on HL data taken from a period when technology was very stable. An I think you probably want at least 10-15 years of data to feel comfortable.
Or you can consider that the URR estimate from HL include a large ghost barrel component that measuring technical advances and accelerated drilling programs or to put it simply faster/better extraction methods.
The huge concern is that its fairly obvious we are not going to get much better at extraction than the latest super straw wells so we hit the wall in effect for technical advances.
This means the technical component of the URR estimate will go quickly to zero leaving only the natural decline rates associated with these fields under advanced extraction methods.
These decline rates are in general very steep 10-17% this results in the overall global decline rate probably approaching close to 7% or higher fairly quickly.
And finally what we are seeing now is a peak in technical ability not geologic 50% URR which is well in the past.
So we should really focus on HL data taken from a period when technology was very stable.
Well said. Unstable technology distorts HL, just like restraints on production from politics and war.
Further, technology depends on price. When price rises, it is economical to bring additional (more expensive) technology to bear. When prices crash or swing wildly, more expensive technology is unused or scaled back. That suggests that HL is substantially distorted by large price changes and high volatility.
Not quite it handles all of these issues its just that the URR presented by HL is not "real" URR but includes a implicit assumption that technology will continue to advance as it has in the past. For the time spans we are looking at price etc are really not relevant IMHO. The only time the technology signal stands out is during the dogleg period otherwise its pretty smooth. Technical progress has been very steady regardless of the price of oil. Its only when a region or field peaks that a burst of technology is used to avert decline resulting in doglegs. So I disagree with you.
HL is not that bad, better than the other approaches IMHO. But if your using the predicted URR to make assumptions about the decline rate post peak I think you better be very careful.
In my opinion the US stands out as a outlier since technology improvement continued to grow steadily as it passed peak and well into its post peak decline. And the investment in extraction in the US has been enormous.
In general since I'm asserting we are effectively hitting a wall with technology regardless of price regions that are in decline now will not have this technical boost.
The point is HL is probably almost certainly high even when you use the regions outside of the dogleg. And it may be high by quite a bit. In my opinion the general low end estimate of about 1000Gb remaining is probably high by about 30-50% and we really have 500GB to 700 remaining.
This means we hit 50% of real URR back in the late 80's early 90's this was masked by low oil prices. Similar to the katrina affect posted for world peak. In fact prices crashed when we hit the maximum geological available amount. This was when the most oil ever was available at the cheapest cost.
We effectively missed the party. Increasing production since then has been because of technical advances.
This says that we are 50-70% better at extracting oil today from a field then we where in say 1980.
So if a field would have produced 1mpd in 1980 we would produce it at 2-3mpd today. So we are extracting oil 2-3 times faster than we did in 1980. This boost has keep production rates increasing even as we are well past geologic peak.
HL ... includes a implicit assumption that technology will continue to advance as it has in the past
Technology and INVESTMENT in that technology. And both are dependent on price!
The latest and greatest 4D-seismic exploration and tertiary extraction technology is useless if it's too expensive because the oil price craters, like it did in 1998. Starting in 1998, oil companies (NOC and Majors) scaled back their new investment in response to the historic low prices. In 1998, stripper wells in the US were being shut in and cement-plugged because it was no longer economical to do maintenance on them at $10/bbl. That production is lost, even though it would be VERY profitable at $80/bbl. Maybe when oil hits $150, it will become profitable to drill out the cement and go after those wells again. How does HL account for that?
Why are you so opposed to recognizing economic factors like price or refinery demand as fundamental determinants of production? Forget the birth models. Oil executives are rational businesspeople - they aren't a bunch of f@qking rabbits.
KSA did not bring 1 MB/day of production due to MRC wells online in the first half of 2004.
I question if we really have data uncontaminated enough by non-geologic factors for this sort of analysis to make sense. Clearly during significant periods KSA has held back production, preferring to retain excess capacity to smooth out price peaks -and perhaps as a threat to use against development of alternatives to oil (or nonconventional sources). Also if I were the Saudi Oil minister I would be running world economic, as well as reservoir simulations to determine a pumping strategy which maximizes the long term economic benefit to the kingdom. If they are holding back production it may be for any/all of the following reasons:
(1) Keep the near-term price up.
(2) Conserve some production for future years when it can be sold at considerably higher price.
(3) Conserve for the future, when the Kingdom has the industrial infrastructure to convert the oil into higher valkue-added production (chemicals etc.).
If the price of oil is expected to increase faster than the rate at which invested capital is expected to grow, then the incentive for (2) could be very strong, at least for an economist with a longtime horizon. They are of course also concerned with the prospects of the world economy, as their investment portfolio is sufficiently vast that how it performs is of similar importance to their (future) oil revenues.
Also we are not dealing with a single monolithic field. Isn't much of the Saudis "swing" oil, heavy oil which demands a considerably lower price due to the difficulty of refinement. Do heavy oil fields have a longer time constant? I would think that the time span for oil depletion increases with viscosity.
Then perhaps we should use the prior swing producer, Texas, as a model for the successor swing producer, Saudi Arabia.
...or not, because that is the only thing they have in common.
I guess that is why we were "wrong" about a near term decline in Saudi crude oil production.
One could argue that the rise and fall of the big fields in Texas, just like in Saudi Arabia, was principally responsible for the final production peak.
Hmm...
It seems that HL for KSA failed to predict:
So, I guess it is due for a win.
Well, since I have made only one prediction for Saudi Arabia, I guess I am batting 1,000 on Saudi predictions.
If we look at the total Texas HL plot, and if we use the 1991 to 2005 Saudi data for a HL prediction, I don't think that anyone would argue that the Saudi HL plot would show that Saudi Arabia in 2005 was at about the same stage of depletion at which Texas peaked.
Now, many people would argue and have argued over whether the percentage of depletion is correct, but the Saudi data plot itself is fairly straightforward.
In any case, going forward we will see if Saudi Arabia ever exceeds 9.6 mbpd (C+C) for a given calendar year.
Texas if anything suffers worse "technical contamination" in fact most of the technical advances where created in and attempt to increase extraction rates.
In fact the URR estimates for Texas and its dogleg is the key reason I started thinking about how advances in extraction capability effect HL.
The key is that HL for texas includes the effect of a continuous advance and application of extraction technology.
Its mixed in with the geologic depletion issue.
They are "entangled".
But the problem is we are now effectively maxed on technology and we are rapidly losing the technical boost effect. In previous decades it has contributed a lot to increasing extraction rates. My opinion is it may have increased extraction rates by as much as 50% for a lot of fields vs say 1950-1970 simple extraction technology.
The HL approach in a sense averages in a expectation of increasing technical advances.
No one has corrected for the obvious increase in our ability to extract oil at higher production rates at the expense of a higher decline rate post peak. I'm asserting we have used up our ability to continue relentless technical advances simply because the latest technology MRC wells are effectively at the maximum extraction rate.
We have robbed Peter for decades to pay Paul.
Now Peter wants his money back.
part, a large part, of what you refer to as technical advances amounts to a transition from "rule of capture" production methods to a more orderly development such as in offshore fields.
and this is not in reality a technological innovation, but more of a political innovation.
Probably its hard to even figure out what this contribution is much less the subparts.
The key is that even as fields have gotten harder to exploit we have managed to greatly increase our production rates.
Understand that the bulk of the worlds major oil fields where discovered and developed before 1970. Technology has played a critical role in new developments since 1970 and boosting production in older fields. We have more than doubled our the rate of oil production with effectively no huge new discoveries.
In a lot of ways our ability to extract oil at a high rate has followed a sort of More's Law doubling every decade.
We have the same technical effect in the oil industry and exists in the semi-conductor industry.
The problem is we will run out of oil and not silicon.
Thanks Luis, for a post that gets people thinking. However, I believe we have to disabuse ourselves of the notion of being merely mortal engineers. For this narrow, arcane topic of oil depletion, the truth has got to be within reach, and we shouldn't sell ourselves short. Remember that the oil companies and their funded research have no desire to prove a limited supply; so it is left to independent researchers and perhaps a few daring academics to pursue the math and statistics.
One of the big temptations of statistical analysis is looking at too small a data sample set. Clearly the S.A. data is governed by (as you say) a chaotic discovery profile -- the peaks are indeed swamped by the mammoth finds. The only way we can smooth the data out really is by adding more data in the form of a global data set.
I predict that the camps that will emerge from such a perspective will align themselves in terms of either Black Swan advocates or bounded thinkers. So for example, the Black Swan optimist would think that the chaotic excursions that have occurred in S.A. would also occur worldwide, while the bounded pessimist would argue that the probabilities of massive finds would become progressively small.
We are all in fact mortal engineers, but I hope we can at least elevate ourselves past the statistics cluelessness of those that think there is something magical about a gameshow such as "Deal or No Deal".
“Mere mortal engineers” was a self-characterizing term. That’s what I am, my math formation is flawed in some aspects and I sometimes struggle to follow your comments and your blog.
But still I feel the truth is within reach, even without better tools than HL. Part of getting out of the narrow thinking goes through acknowledging what HL is worth for and that it doesn’t always work. It hurts to see some of our TOD friends using it blindly like a herd of Sheep.
Anyway, it was your comments that compelled me to look into this recurrent issue again. The Hubbert Curve is just a manifestation of the Verhulst model in the special case were the carrying capacity is zero (the underlying resource is non-renewable). In the first phase the number of births is higher than the number of deaths and both evolve to equality. By the time half of the resource is consumed the number of death goes over the number of births and stays there, until population is zero.
Luis, I like the way you put it in terms of a word description of the Verhulst. It seems that we can then write this in terms of an underlying difference equation, the fundamental basis for deriving a result. Unfortunately, I have never been able to get it past the birth-only model formulation, which I know leads to an infinite carrying capacity.
In a sense, in one case it leads to a nonsense math result, but if we include death in the other case, it seems that the interpretation is faulty.
What if you focus on total extraction rates, not production? That is, URR as % of OIP?
The URR:OIP ratio is also one that has a maximum upper bound, of 100%. Peak occurs when technology-driven extraction rate improvements in old fields PLUS new developments no longer keep up with depletion.
So maybe we need to get past production, which is affected by so many above-ground variables. Look instead at efficiency.
I think your talking about several different metrics.
Extraction efficiency URR/OOIP this is a percentage
and it can only be verified when a field is shut down.
I question both URR and OOIP used in the industry today both with OOIP slightly more reliable. What your missing is that a lot of the oil is extracted in a long tail region post peak 30% or so of the total oil is extracted over a long time at a low flow rates using tertiary recovery methods i.e stripper wells.
What I think we really want to know is how fast can we extract a field today before it hits peak production and begins to decline so its not just peak but the point of initial decline since the max production can be a plateau.
This is the initial extraction/development efficients.
Its the rate of production vs OOIP.
I think since URR cannot be verified and it should be a result. That the efficiency metric is this RP/OOIP ratio.
Whats happened is the OOIP has been effectively flat since about the 1980 but RP has increased steadily. Changes in this ratio upwards are technology driven.
Luis,
Nice job! A comment on your HL Diagram. The line for Khebab's HL pointed at 200 GB for a URR in his original article and he used data from 1984 to 2006 (the blue points on his diagram), Q=50 GB in 1984.
Dennis