| Hurricane Ike, Shut-In Production and Energy Infrastructure (Updated 9/9 10:00 EDT) | The Oil Drum | DrumBeat: September 10, 2008 |
The Start of a New Semester: Some Changes in My Energy Lecture Slides
Posted by Heading Out on September 9, 2008 - 10:15am
Although the days are still relatively hot and the sun high in the sky, this summer is coming to an end. The order has gone in for the wood that will help us heat the house this winter, and the students have arrived for a new semester. Which means, a little late as usual, it is time to dust off the lecture notes (which now-a-days come as Powerpoint presentations), and start the annual update.
One of the classes that I teach deals with power, both generation and use, and so I start the semester with a review of where I see that we currently stand as an overview before getting into more mundane details, such as the inner workings of a generator. The spacing of a year between using these particular slides also gives a little perspective on how things have changed, and updating individual slides emphasizes where the most significant changes have been, in my opinion. So let me show you the slides I am adding or changing, and explain, relatively briefly, why.
The first change has been to alter the slide that used to show the general situation, from the ASPO curve on oil supply that I have used in the past, to that from the Megaprojects analysis, using the August 2008 projection. However, instead of the featured curve from that article, I replaced it with the one that comes near the bottom end of the comments.
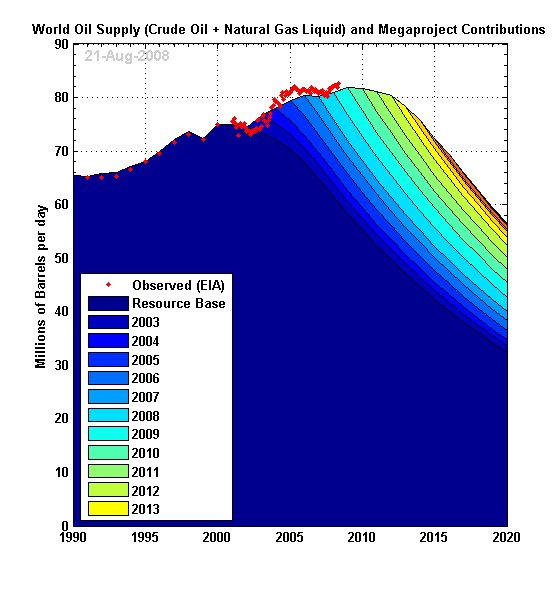
In contrast with the earlier curve, Khebab plotted this with a decline rate of 5.2% rather than the 4.5% decline used in the derivation of the main plot, and given the reports of higher decline rates I am no longer comfortable using the lower number. My main reason for the change was to highlight the changing impact of an increase in decline rate, and so I contrasted this with the original predication that came at the top of Khebab's post.
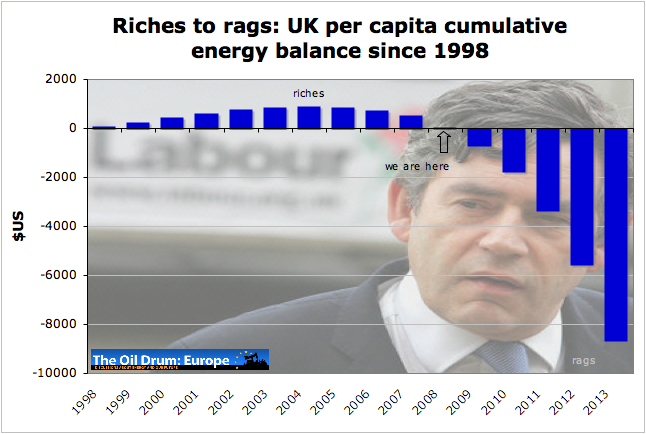
In order to justify my emphasis on the change I had then (in what turned out to be a back-to-the-blackboard moment) to explain the reasons for depletion, and the change in the rate brought about by the increased use of horizontal wells. To show the reality of the change and its impacts I used the example of Cantarell, but just changed the wording on the slide to note that though the field peaked at over 2 mbd in 2004, it is now (again from comments ) below 1 mbd (the July figure was 973,668 barrels/day). The decline curves for the North Sea also emphasise the higher rates, and I added to them this year the plot that Euan made of the coming decline in British fuel supplies.
To explain why there was going to be no salvation from the Middle East I combined another visit to the board (to explain water floods) and then added the aerial plots of wells that JoulesBurn has posted, as a supplement to the section through Abqaiq, as an illustration of my comment that I cannot see production from that area being sustained more than four years from now. The plots show that the most recent wells are concentrated along the crests of the anticlines.
 |
 |
Turning to natural gas, the most promising development of the year has been the increases in production due to the development of the Barnett, Utica, Haynesville and Marcellus shales. It has just been hailed by the NYT as possibly marking the start of a era in energy production. However, after a couple of slides showing their location and the advanced technology being used to get the gas out, I reverted to the pessimism of an earlier post where the very short life of those wells was discussed. (I will save a comment about the Pickens Plan and the projected use of natural gas supply that it calls for until next year.)
There was a short discussion of Barnett shale production, led by DownSouth, last week which led me to the Texas Railroad Commission reports and the transience of some of the well lives is illustrated by production numbers from different fields of the Barnett Shale. I chose the numbers from the Golden Corral field as illustrative for the class.
Pre-2003 . . . . 0
2003 . . . . . . . .13,010 mcf
2004 . . . . . . . . .1,708 mcf
2005 . . . . . . . . .0
2006 . . . . . . . . .129
2007 . . . . . . . . 8,869
2008 . . . . . . . . . .867
With U.S. gas production declining it was then worth adding a couple of pictures from Jerome , first showing the gas pipelines running from Russia into Europe.

And then, following the ongoing situation in Georgia, to show the pipeline map, to which Jerome has also referred.
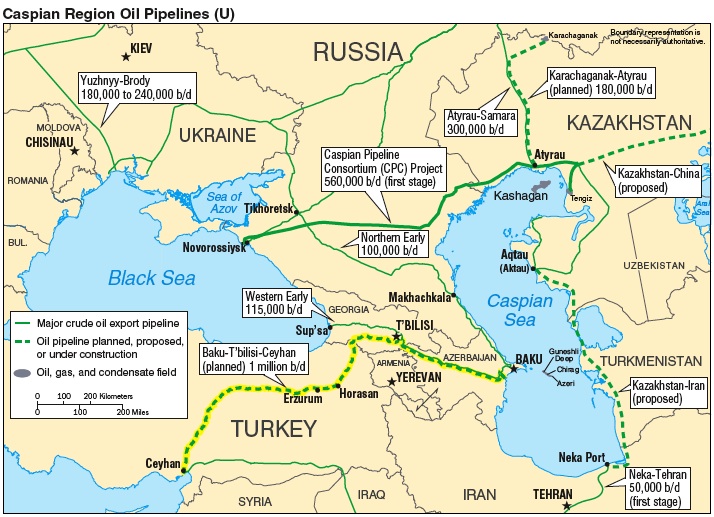
Putting these two together, allowed me to wax pessimistic about the supplies of fuel from the Central Asian states, such as Turkmenistan and the overall problems of supply for the West as China acquires gas from a pipeline into the region. It also allowed a couple of remarks about the predatory nature of Gazprom and the recent problem that BP has encountered in working in Russia, as emphasis to the likely future of fuel supplies from that part of the world.
The lecture went on to talk about the problems of supply in the face of the growing domestic use by producers (the Export Land Model) and some concerns about the political power shifts that are now underway.
It concluded with some thoughts on possible solutions including some slides on the Oil Sands of Alberta, the heavy oil deposits in the United States and elsewhere, and the potential impacts of other fuels. Although the hydrogen caravan passed through town last week, I saved a comment on that technology to the following lecture in the section related to batteries (which also included pumped storage). The class ended, after repeating comments and slides that have appeared here before on both corn and cellulosic ethanol, with a short discussion on the use of fire underground for either in-situ combustion of coal, or for the THAI process in Alberta. Personal experiences in the difficulties in monitoring and controlling the flame front in such circumstances ended the class on the same pessimistic note as that on which it began.
And yet I had to request a larger classroom, since the additional students overfilled the original (albeit small) room. So perhaps there may be some ray of hope for the future, with the increasing number of students coming into the business - but alas it will take too long to train them and to find the necessary solutions for this to get us out of the problem years that we are now entering. And apropos a comment last year, where 4 students had worked in operations over the summer where they were asked to participate in load shedding, this year there was only one.
Contact
- Content: editors at theoildrum dot com
- Tech support: support at theoildrum dot com
License

This work is licensed under a Creative Commons Attribution-Share Alike 3.0 United States License.
The world oil supply graph is a problem, because the blue-green colors look so similar, you can't really tell which bar is 2007, 2008, 2009 & 2010. Can you adjust this at all?
It is a problem. A couple of pointers. If you work back from the clear yellow, it's easier; and the 2010 green ends (left-to-right) on the 2010 line,
Peter.
What texts are you using? I've been toying with trying to teach a course on energy if I end up permanently in a geography department. It's such a basic subject and so overlooked. Thanks.
The class actually deals more with how power is used and lost, and how this can be improved, but from the point of a mining operation, so it tends to be somewhat specific, and thus I rely more on papers and my own notes, than a single text.
my mistake double post
While Eastern Europe indeed does not have too many (cheap) options apart from Russian gas, casting the whole European gas supply purely as an inevitable "pipelines-from-the-east" future does not really paint the full picture - massive LNG terminal investments are being made in W-Europe, coupled with the development of new fields in North Africa (coupled with new pipeline and LNG infrastructure) and the transformation of depleted North Sea fields into strategic buffers do give Europe a few more options (although not cheap) than the current fatalistic we're-all-doomed-Russia-has-got-us-by-the-balls mood suggests.
Also, a lot of the projections of growing natgas demand hinge around the assumption of a big addition of gas-fired power generation capacity. But if a supply crunch (Russia-induced or otherwise) does hit and prices surge, these units will not consume anywhere near the projected amount and will be scaled back to peakshaving while cheaper (coal, hydro, nukes, wind) capacity will produce the baseload bulk of power demand. New fossil-fuel power plants are increasingly built as multi-fuel units (gas/coal/oil switchable), making demand more and more flexible (or unreliable, if your job is to project future demand). Gas demand for heating has also steadily declined per home over the last two decades as high-efficiency boilers, city heating and improved house insulation start to deliver the goods. Unless winters will get colder or many new homes are added to the grid, I don't really see the projected demand growth materialise.
The problem with trying to project into the future is that we are not just trying to estimate what is possible technically, but also what will happen politically. My next post will probably deal with this is a little more detail. However any change in the supply situation will take time, as the necessary facilities have to be built (with market justification for the investment) and that takes time to happen. My concerns are admittedly more short-term in that regard.
We need a new poll. Traded as low as 102.06.
Once the first digits hit 102.XX then new poll.
Within 20 cents of telling Ace that he was wrong about oil never getting below $102/barrels ever again.
Probably any decent news on Ike or elsewhere or more strengthening of the US dollar and we go below $100.
I thought that Ace had one of the more reasonable crude oil price curves for oil, increasing by perhaps $20/bbl per year as supply dropped further and further behind demand.
What his crude oil price curve did not capture, and what noone can fortell, is what the undulating plateau will look like. I would say that we have definitely entered the undulating plateau period.
I also recall that Skrebowski reported that crude oil would be in the $60 to $80/bbl range. My model showed $90/bbl, but I am sure that like my model, Skrebowski's model did not factor in a crash in the housing market which caused investors to put their money into commodities, including oil, and a slide in the dollar's value.
What is likely to happen is that investors are investing away from commodities now, but that they will likely reinvest when oil becomes a "hot item" again, thus driving up oil prices once again.
So I would think that the crude oil price curves like those of Skrebowski and Ace represent an average price for crude oil moving forward, but that its price will undulate below and above that average price.
Retsel
Went back and checked
http://www.theoildrum.com/node/4397#comment-392132
It is average monthly price will not go below $102 ever again.
So that will all of September or all of October to set the monthly price below $102 before Ace gets a reminder to eat crow.
Looks like Ace has OPEC on his side
http://www.bloomberg.com/apps/news?pid=20601085&sid=aph4v20TXX6E&refer=e...
Oil Rises After OPEC President Calls for End to Overproduction
Vaclav Smil has a series of energy texts of different levels and focus.
Environment, Power and Society by H. T. Odum has as a sub title, The Hierarchy of Energy is an analysis that covers the materials discussed on this web site, but seems to be undiscovered by the majority of the contributors.
I'd love to be taking your course.
One nitpick: It also allowed a couple of remarks about the predatory nature of Gazprom ...
While not wrong, any more than it was to speak of Saddam as bloodthirsty, etc, it is one-sided, and one-sided in a highly charged and dangerous climate, possibly leading to war, just as were the Saddam charges if taken in isolation. I won't recount the history of US and Western actions against Russia since the fall of the SU, nor the actions and posture of the US when it was the energy superpower during WW2 vis-a-vis competing imperial (Axis) powers.
I'm not advocating all or any of this be covered. I'm simply objecting to the gratuitous potshot without proper context.
I will try and clarify why I think the way I do in my next post, but I have written about this in the past where among other things I noted
Looks as though I was a little optimistic.
HO
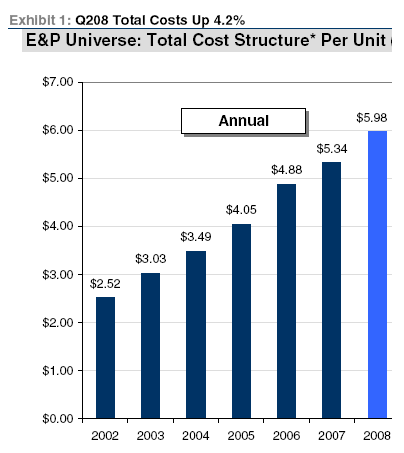
Did you talk about net energy or receding horizons at all? E.g. that as depletion trumps technology that costs accelerate faster than commodity prices?
I will write a post on this if i have time but a new report out by Credit Suisse today showed that the AVERAGE cost (including finding, drilling, pulling out, G&A, DD&A) was $6 per mcf with a MARGINAL cost of over $8 per mcf....funny that NG is only $7.4. No wonder nat gas stocks are getting crushed.
The headlines are that we have a natural gas glut and there is 'opportunity' to build and export LNG to asia and increase switching from coal to cheap NG. But this is a one time deal - the 8% growth won't happen sequentially, or it COULD happen at considerably higher costs.
Barring hedge fund collapses and fund movements we are near the all time low for future NG prices, IMHO...There will be some shut in production if gas drops below $6 but more importantly many firms will choose not to rent rigs etc at that level. (also, I think rigs will start to migrate to cheapest NG locations, like Haynesville)
So sad that the market just cares about this year, or even this quarter. But....how could it be otherwise???
Nate, how would you factor in temporary scarcity premiums for rigs, supplies, etc, caused by normal delays in ramping up production?
Grin! One of the things we do is come up with those ideas to take technology and develop less energy expensive ways of doing things. It is mentioned (ad nauseam the students might say) throughout the lectures.
The third lecture dealt with power bills and mainly I tie back to that, using 12 kWh-hr as a base for the mining cost for a ton of coal (but then going on to point out why it is not site accurate). Part of the effort is to generate thoughts "outside-the-box". I have mentioned the odd one or two here in the past.
and not that this is the place for it, but look what our government JUST announced:
we have SO much natural gas that we should ramp up exports!!! (forget about the diapers and plastic bottles and heat that we might need in 2015 or beyond...we'll have some new 'technology' by then for sure!!)
"the market just cares about this year, or even this quarter. But....how could it be otherwise???"
I have often wondered to what degree contemporary 'markets' are actually 'free' in the way they are presented in economics courses. I tend to suspect that the momentum of massive hedge funds and more mysterious large fund investing has trumped any sense of a 'free market' and would be better described as a 'players market' where the big 'players' moves have more impact on the day-to-day price than the broadly-termed 'fundamentals'? I don't believe it is a case of too much money chasing too few investments. Rather, anticipating the momentum of prices is apparently more lucrative than long positions and has become the 'engine' of the volatility. But that is a digression pertaining to earlier statements in previous articles...
To reply directly to the question, "how could it be otherwise?"--It IS otherwise--more speculative than ever and not a 'free' market but a 'players' market; and yet these vast transactions could, in many scenarios, for better or for worse, come under government regulation. I fully expect regulation may occur in worst-case situations, e.g., price floors or ceilings... So yes, it could be very different, particularly as OPEC loses its production-supply-limit function just as the Railroad Commission of Texas once did.
This is a new era. Do not expect old methods, models, or paradigms to be applicable.
sorry -'how could it be otherwise' is a trademark closing question that jay hanson used on his listserv for many years - inside joke to some here.
Of course the details can be otherwise, and human agents will adjust and follow the rules - but the current focus on immediate profits is why we aren't marshalling reserves for future use but pulling them out as fast as possible, sometimes even at a loss!! (if we left them in we'd have a bigger loss)
Not all companies publish their projects more than six years in advance, not all projects were completed within six years of their initial scheduled completion either (Kashagan).
Hebron was discovered off the coast of Newfoundland in 1981. It is likely to hold between 500 million and a billion barrels of moderately heavy oil in relatively shallow water. It was approved for development in 2008 almost 30 years after it was discovered. It is technically difficult as there were icebergs in the area. Other developments in the area are successful producers. It is now on the drawing board. Last year it did not appear on any projects list. The small Bakken type projects may not appear on the megaprojects list and the proven reserves of the region have increased rapidly as more rigs were added to the oil field. The USGS recently stated the proven reserves and not the 3P-plus (4P) reserves that others have stated for the thousands of square miles of Bakken formation.
While peak oil is coming, it is difficult to find the exact date.
According to the CEO of Petrobras (Brazil), the Tupi discovery may be a "tiny part" of the Santos Basin total oil/liquids reserves. Tupi was estimated to hold 5-8 billion barrels of oil. This field has the mystical qualities of a Ghawar, not an elephant, but a whale of an oil deposit.
Is not the TUPI field the one under 2000 meters of water covered with a plastic like salt dome? If so, does the technology already exist to drill through a salt dome at that depth? Is the oil light sweet, heavy sour or somewhere in between? Any ideas on EROI of such a field? My students are now asking me these questions about new finds. At least a few folks will be aware post peak.
Regarding the Bakken formation: A couple months ago TOD discussed this oil bearing formation and some links described the latest technology of current production (can't find links but I remember www.ndoil.org was one). Two things stand out as to why the Bakken is not salvation of the US (not megaproject): first, wells all require several horizontal legs as oil bearing rock is very thin seam and it requires fracturing several times to get much flow. This produces high cost per well. Second, the decline rate is great, as I remember data showing typical well would produce 400 bbl per day initially then decline to half in a year and maybe to a third in two years with typical well producing less than 200 bbl per day after one year.
As with many oil producing regions in the US this area will have development restricted by available rigs and manpower. Don't expect the Bakken to ever produce much more than 500,000 bbl per day at its peak (maybe ten or more years away).
I was involved over a period of years (1985-1992) with some of the iceberg tracking work off Newfoundland.
A major problem is that the area is often covered by dense fog making it impossible to visually track icebergs. Part of the solution was setting up regular long distance jet flights using SLAR (side-looking airborne radar) to find the bergs day or night. Since 1995, bergs have been tracked by RadarSat.
There was also a lot of work mapping ocean currents which could affect the course of icebergs. And a number of tests using ocean-going tugboats to determine the maximum size of berg that could be deflected. Finally the Hibernia oil platform was built with a massive base that could withstand a direct hit from the majority of bergs.
By the time that Hibernia oil production started in 1997, bergs could be tracked 24/7 and there was a very detailed protocol on how to handle any detected threat.
There is a lot of backgound work that never make the news but is vitally importantant to new developments in frontier areas.
do you have a link to all the slides?
Detail comment to your last map:
The Baku-Ceyhan pipeline is already running.
(http://en.wikipedia.org/wiki/Baku-Tbilisi-Ceyhan_pipeline )
Or what did you think why everybody is so nervous about the Ossetia conflict?