Yet Another Forecast for Saudi Oil Production
Posted by JoulesBurn on August 12, 2008 - 9:39am
Predicting the future of Saudi Arabian oil production is a rather daunting endeavor, given the limited amount of information available upon which to base a prediction. Presented here is an appraisal for Saudi production through 2015 based on an informed analysis of past production data and a simple extrapolation into the future. It is found that the oil production trend from the early 1990s through the present is driven more by the addition of new producing areas than by "peak and decline" in the Hubbertian sense. This trend will likely continue for the next few years leading to a new "peak", although more rapid decline in mature areas of Ghawar will eventually overwhelm both mitigation efforts therein and added production elsewhere.
“Data always beats theories. 'Look at data three times and then come to a conclusion,' versus 'coming to a conclusion and searching for some data.' The former will win every time.”
—Matthew Simmons, ASPO-USA conference, Boston, MA, October 26, 2006
Rethinking the Peak
Has oil crude production in Saudi Arabia peaked? Some claim that it did as of 2006, although the slate of new production -- including the redevelopment of Khurais and Manifa -- would suggest that 2006 levels will be exceeded in the next few years. The problem here is not with the concept of peak oil, since all individual producing areas will certainly exhibit this behavior, but rather with the idea that the nature of the peak and decline of an arbitrary entity is immutable to changes in the definition of said entity. Such changes can include large new discoveries which eventually increases the amount of oil available, new technologies which do the same, or political decisions about which fields to produce and when. The latter two of these certainly apply to present day Saudi Arabia.
Is it really critical when Saudi production peaks? Yes, given that this certainly means that, with no spare capacity, Saudi Arabia can no longer serve as the swing producer. The rapid price increase during 2008, while not proof of a Saudi peak, is nevertheless indicative of the impact on the world economy from a limited supply buffer.
Forecast This
Several forecasts for Saudi oil production have been offered on this forum, including these:
- A Nosedive Toward The Desert, by Stuart Staniford
- Saudi Arabia - production forecasts and reserves estimates, by Euan Mearns
- Saudi Arabia: An Attempt to Link Oil Discoveries, Proven Reserves and Production Data, by Khebab
- World Oil Forecasts, including Saudi Arabia, Kuwait and the UAE – Update Feb 2008 , by Ace
- Forecasts on Saudi Arabia liquids production, by Jean Jean Laherrère
Similar to the above analyses, I will use recent trends in prior production as an indicator of what is to come. The time period of interest is from the early 1990s (when KSA restarted many mothballed fields, including south Ghawar) to the present. What is different is that I will explicitly account for the contribution of newer production (from a myriad number of megaprojects) to the total during this period in developing a forecast for the next few years. In addition, I will not be concerned with a determination of remaining reserves, and will not be using the Hubbert Linearization (or HL) technique. The use of the HL technique for estimating future oil production in general, and for Saudi Arabia in particular, has a rather storied history on TOD. Instead of reliving these moments, I will just direct those interested to a compendium:
http://www.theoildrum.com/tag/hubbert_linearization
Accounting For Newer ProductionIf the present plans of Saudi Aramco are realized, about 5 million barrels per day of new production, equivalent to another Ghawar, will have been brought online in about a 20 year period as detailed below:
| Project | Flow (103BPD) | Year |
|---|---|---|
| Haradh I | 300 | 1996 |
| Shaybah | 500 | 1999 |
| Haradh II | 300 | 2003 |
| Qatif | 500 | 2004 |
| Abu Safah | 300 | 2004 |
| Haradh III | 300 | 2006 |
| AFK | 500 | 2008 |
| Nuayyim | 100 | 2008 |
| Shaybah II | 250 | 2009 |
| Khurais | 1200 | 2009 |
| Manifa | 800 | 2012 |
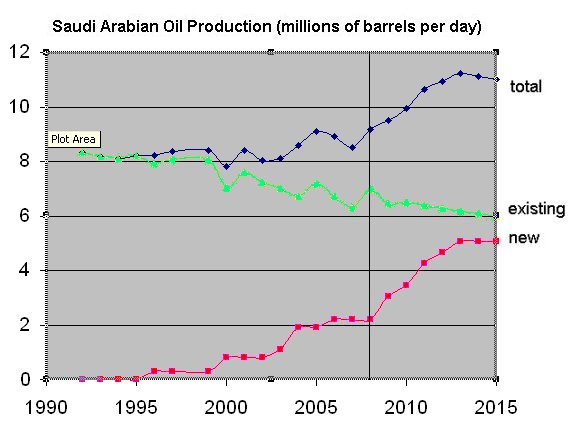
Importantly, production from these fields is managed such that it can be maintained at the target levels well into the future. This is accomplished by adding new wells, of course, but the net result is that any decline estimate which treats new production the same as pre-existing production will overstate the decline. But since the new production amounts (and start-up date) are known, we can isolate the existing production in past years by subtracting the new production from the total. This is shown in the figure below.
The data to the left of the black vertical line (the present) are known quantities. The new production (red) is subtracted from the total (blue) to obtain the contribution from existing production (green). The data to the right represents forecasts for what Saudi Aramco will add in terms of new production (red) and how much the existing production will decline in the next few years based on a linear extrapolation of that for prior years (green). The total production in future years is then calculated as the sum of these. Is a continuation of this seemingly linear trend probable? Most likely not, for reasons discussed below, but the point here is that nothing in the data itself suggests anything different than a continuation of this trend. It is interesting that the constant decrease (somewhat over 1% per year) is in line with the net decline admitted by Saudi Aramco (natural decline mitigated by additional wells added). Also, the effect of constrained production (either existing or "new") will be wrapped up in this as well, so it's best not to draw too much of a conclusion without additional information.
Whither the Peak?
Once isolated from the newer production contribution, the pronounced trend for existing fields since the early 1990s is a slow decline which gets masked by the new additions. One could claim a peak in 2006, but this lasts only until enough new production is added quickly enough to overwhelm the decline. Of course, after Manifa, the options for substantial additions become rather sparse. And without knowing what fields will be produced and when, predictions beyond 2015 are rather problematic. There is a lot of oil in smaller fields, but the logistics of developing the necessary infrastructure (including water handling) to simultaneously deliver from many fields the oil equivalent of another Shaybah or Khurais will be a much bigger project than either of those.
What if Ghawar Crashes?
If the trend for older fields differs from the above prediction, what is possible? To the extent that any of this production is being throttled back, then letting it all flow would certainly add to the total. But a stronger possibility is a steeper decline of existing fields based upon evidence, from satellite analysis of well drilling, of what it has taken in recent years to maintain production in Ghawar and Abqaiq. A comparison of the distribution of newer and older wells in north Ghawar is shown below:
 |  |
In the left image, red and blue placemarks indicate locations of oil and water wells respectively. In the right image, green circles denote recent well locations and diamonds indicate drilling rigs.
The number of newer wells and the expected productivity of the wells (especially given that these are most likely all horizontal wells) suggests rather serious decline mitigation. Furthermore, the concentration in the center of the field suggests that the days of adding more wells to keep the decline under control are limited indeed. If a steeper decline of Ghawar occurs in the next couple of years, it will possibly be masked by Khurais and then Manifa -- although the higher levels of production promised by Saudi Arabia will not materialize.
Summary
An analysis of recent crude oil production data for Saudi Arabia, in conjunction with data on recent projects which have added additional supply, indicates that the most recent production peak in 2006 will be surpassed with the additions of the Khurais and Manifa producing areas. Beyond these, however, more rapid decline of Ghawar and other older fields will overwhelm any potential additions from their remaining as yet undeveloped fields.
Author's note: Westexas pointed out some errors in the most recent Saudi production data, and the data has been updated to reflect this correction. This does not significantly affect the forecast presented here, however.
Ed note: Khebab just posted this in the comments, I thought it should probably be moved up in the body of the post...it's a graphic of all of the myriad forecasts on one plot:

Click To Enlarge.
and the numbers:
| Forecast | 2006 | 2007 | 2008 | 2010 | 2015 | Peak Date | Peak Value |
|---|---|---|---|---|---|---|---|
| Crude oil + NGL | |||||||
| Observed (EIA) | 10.58 | 10.16 | 10.66 | NA | NA | 2005-04 | 11.06 |
| IEA (WEO, 2006) | 10.83 | 11.03 | 11.22 | 11.60 | 13.30 | 2030 | 17.30 |
| IEA (WEO, 2005) | 10.85 | 11.09 | 11.35 | 11.90 | 13.62 | 2030 | 18.20 |
| EIA Low Prices (IEO, 2006) | 12.45 | 13.11 | 13.70 | 14.40 | 15.01 | 2030-01 | 18.60 |
| EIA Reference Case (IEO, 2006) | 12.57 | 13.27 | 13.86 | 14.46 | 14.79 | 2030-01 | 17.10 |
| EIA High Prices (IEO, 2006) | 11.82 | 12.19 | 12.49 | 12.65 | 11.06 | 2010-01 | 12.70 |
| Smith (2006) | 11.39 | 11.78 | 12.73 | 14.08 | 14.38 | 2018-01 | 14.50 |
| Mearns (2007) | 10.72 | 10.95 | 11.37 | 11.52 | 9.51 | 2011-01 | 11.68 |
| IEA (2007) | 10.73 | 10.80 | 11.17 | 12.17 | NA | 2012 | 12.57 |
| HSM (2008) | NA | NA | 10.93 | 11.12 | 11.30 | 2015 | 11.30 |
| Brown&Khebab high case (2008) | 11.11 | 11.13 | 11.14 | 11.08 | 10.56 | 2008 | 11.14 |
| Crude Oil + Lease Condensate | |||||||
| Observed (EIA) | 9.15 | 8.72 | 9.22 | NA | NA | 1980-11 | 10.41 |
| Logistic | 8.66 | 8.59 | 8.51 | 8.29 | 7.51 | 2003 | 8.75 |
| Bakhtiari (2003) | 9.08 | 8.98 | 8.90 | 8.76 | 8.20 | 2003 | 9.50 |
| Campbell (2005) | 9.00 | 9.00 | 9.00 | 9.00 | 9.00 | 2006 | 9.00 |
| Ace (2007) | 9.02 | 8.73 | 8.44 | 7.77 | 5.96 | 2006-01 | 9.15 |
| Kopelaar high (2008) | NA | NA | 9.38 | 9.76 | NA | 2009-12 | 10.00 |
| Kopelaar low (2008) | NA | NA | 9.49 | 10.28 | NA | 2009-12 | 10.40 |
| JoulesBurn (2008) | NA | NA | 9.19 | 9.94 | 11.02 | 2013 | 11.23 |
| Consumption | |||||||
| Cont. Barrels/Capita | 1.75 | 1.79 | 1.83 | 1.92 | 2.14 | 2050 | 3.43 |
Contact
- Content: editors at theoildrum dot com
- Tech support: support at theoildrum dot com
License

This work is licensed under a Creative Commons Attribution-Share Alike 3.0 United States License.
Don't forget the refining capacity to handle all that sulfur and vanadium:
Graph courtesy the World Petroleum Congress, from a doc Gail linked to.
I've wondered if some of the new production out of the ME is effectively stranded to an extent - customers they may have who can handle the stuff, but once supplied they have to wait a bit before selling more of their heavy sour product. With new refining in place the market will perhaps be a bit more liquid again.
Could you explain how your new (red) line corresponds to the megaprojects data above. Surely there should either be big step 2009, or some reasoning as to why its smooth. If it is smoothed over a period of years, why does it appear Manifa isn't?
I guess Khursaniyah is part of the AFK heading, but I don't see that on 2008's new figures, and its supposed to have already started production.
I didn't assume that all of the new production from a megaproject would should up in the target year, so the increases are smoothed out. Moreover, Khursaniyah was reportedly going to start this month, but there is no indication that it has as of yet.
But:
a) in that case I don't see where the 800kbpd of Manifa in 2012 went, since there is only one small blip, then flat, and Khurais should be still increasing.
b) you have a kick upward in production this year, being attributed to existing fields. You also have news stories saying Khursaniyah is in full production. Swap the 'old' for 'new' in light of that and your future production on old fields extrapolation gets pulled down significantly across the future predictions.
Also the megaproject page has Khurais down against early 2010. Even if believe the Saudi date of mid 2009, your own satellite work suggests more of a 'big bang' startup does it not?
I agree with the aim, but I'd be included to assume the behaviour of the 'old fields' should be a punctuated, smooth decline - with certain fields maybe being shut down. If you are not getting that, I'd question if the data for the other curves passes the sniff test - particularly in light of stores as a buffer that's not included.
Specifically, I have 850k for 2009 (AFK, Shaybah, and Nuayyim), 400k for 2010 and 800k for 2011 (Khurais), and 400k for each of 2012 and 2013. One could speculate endlessly about how these projects will eventually be ramped up, and this is just one guess.
Not for the faint of heart:
Click To Enlarge.
and the numbers:
Khebab, thanks for this compilation.
Here's the forecast I produced last year which I believe is using similar methodology to that used by J. Burn this year - i.e. the forecast is built upon the historic production stack, some assumption is made about decline (I'll return to that later) with new projects built upon that to produce the forecast. I think JB's forecast looks pretty similar to mine though I note he is modeling crude oil and mine is for crude + condensate + NGL (C+C+NGL).
Forecast numbers are production capacity. Actual production may be lower depending upon demand. Click all charts to enlarge
This forecast is built upon the significant body of work done modeling reserves and decline in Ghawar last year by Stuart Staniford and myself aided and abetted by a gang of TODers. At the end of it all Stuart and I reached very similar conclusions.
This is the revised base case Ghawar forecast upon which the Saudi forecast is built:
http://www.theoildrum.com/node/2507
The weaknesses with this Saudi forecast that I would identify myslef are as follows:
• The 500,000 kbd estimates for discovered undeveloped and yet to find are pure guess work.
• I have applied 5% decline to the heritage assets and this may be far too high. As JB points out here there are still large undrilled areas on certain supergiants that can be drilled to compensate for decline. This may be particularly true in the northern sour heavy fields of Safaniyah, Marjan and Zaluf.
• No allowance is made for secondary recovery from the now wet areas of Ghawar. With the right investment these may produce vast amounts of oil with high water cut forward to 2100.
Each of these points are likely to add to the forecast shown and this will likely help bridge the gap between the reserves held in this forecast and those reported by the likes of Colin Campbell.
I like this 30 billion barrel forecast. Excellent work by Euan.
By Saleri's own numbers remaining reserves in Ain Dar/Shedgum at this point are about 10 Billion barrels. I think North Uthmaniyah is lower... any reasonable volumetric estimate of the "Mohawk" says it.
Note that there is a 3 MMBOPD loss to 2015 in this compared to 1 MMBPD in the forecast given.
But I would say Khebabs curves about have it covered.... LOL.
FF
Err Euan, Haradh III only came onstream in 2006, bringing total Haradh production up to 900k. IIRC anything that's actually coming out of Hawiyah NGL is similarly tied to recent GOSP construction?
Hawiyah NGL is coming from non-associated wells. They have added quite a few in the Hawiyah/S. Uthmaniyah areas in the last few years, with the output eventually feeding the NGL plant completed just east of the existing Hawiyah gas plant.
Gary - see your point about Haradh - must have had a bad bottle that evening. I don't understand the remainder of your comment.
I think Hawiyah NGL production was similarly affected by lower numbers in the past due to completion dates on facilities being recent. That's from memory, I can't lay hands on the link, but it should be out there.
Obviously we've been over the difficulty in getting good production numbers from these fields in the past; let alone future figures. Still, I'd bet that Shedgum will go before Uthmaniyah and old fields will be progressively shut in to yield surge capacity as newer fields come on line - putting a cap on production and confusing that graph mightily.
Following your comment, I've updated the chart in JoulesBurn story.
Thanks Sam,
So what is HSM and where did the Brown and Khebab forecast come from and has Jeffrey seen it?
Euan
You can click on the links within the table in order to get a detailed explanation. In a nutshell:
- The HSM is a variant of the Shock model proposed by WHT, the Saudi Arabia forecast is based on a discovery dataset from IHS:
- The Brown & Khebab is based on a bootstrapped HL technique with a fairly large uncertainty, I took only the upper forecast (URR @ 250 Gb):
I think that the HSM is one of the best approaches for SA, in particular given the fact it is almost impossible to get good reserve growth numbers off of discovery data from such an inscrutably circumspect national oil company.
Nicely written and reasoned summary. Thank you Joules and some nice replies by Khebab and Euan. The Matt Simmons quote leading off the article sets the tone of the article but then posting the data from various sources gives a scattergram of data points leading me to conclude "what data!?". It's everywhere. Until we get verified data from KSA, articles like these are useful talking points but trying to use the current data for policy decisions is fraught with risk. My one significant question is what techniques are being used in the new additions? Are they drilling wells and waiting for the oil to run directly into pipelines or are they starting new production hot and heavy with enhanced techniques right from the get go a la North Sea? If so can be expect sharp fall offs in production going forward? The graph showing new refineries coming chiefly from overseas and not in the North American hemisphere suggests several conclusions:(1)we will not need new refineries built domestically(2) we will be buying refined products going forward instead of crude so this will probably increase price for distillates, gasoline and petroleum based feedstocks at a greater rate than crude(3) if you are using domestic refineries as I have for investment vehicles, fuhget it, sell them, suck up your losses and look elsewhere for ways to lose money. Generally, not a pretty picture.
Having just read Twilight in The Desert I do wonder about such forecasts for KSA. If Simmons is right then sure speculation is just that - speculation with little firm ground to base it on?
Also, I'm curious about this - "No allowance is made for secondary recovery from the now wet areas of Ghawar. With the right investment these may produce vast amounts of oil with high water cut forward to 2100". How so? My (perhaps amateur) understanding of this was that once the percentage of water cut reached a certain level that was it - no more oil could be usefully extracted?
With Ghawar (or Abqaiq), the more correct term would be "tertiary recovery", since secondary would be water injection started 40 years ago or so. To change the game, so to speak, they could alter the mobility of the residual oil (CO2, surfactants). This would require a massive amount of alterant, given the size of the field. Or, they could invest increasing amount of capital in more water handling facilities and keep on producing at increasing water cuts. The prospects for either of these approaches is questionable.
Thanks Joules and Khebab!
My assumption for total economic URR crude/condensate for Saudi Arabia (including half of Neutral Zone) remains a pessimistic 185 Gb based upon the creaming curve, recovery factors and monthly/annual HL plots.
http://europe.theoildrum.com/node/4299/387218
Saudi Arabia's forecast crude and condensate production rate to 2020 is updated below for the recent EIA data release. It is worth noting that the EIA says that Saudi Arabia's production for May 2008 was 9.40 mbd while the OPEC July 2008 OMR says a much less 9.18 mbd. Which number is closer to the true production?
http://www.eia.doe.gov/emeu/ipsr/t11c.xls
http://www.opec.org/home/Monthly%20Oil%20Market%20Reports/2008/mr072008.htm
An important feature of the chart below is the recent increase in the depletion rate of remaining reserves. WebHubbleTelescope uses a similar statistic which he calls extraction rates in proportion to the current reserve value.
http://canada.theoildrum.com/node/3958/373313
From Jan 2005 to Dec 2007, the average depletion rate of remaining reserves was 4.4%/year as shown by the dashed green line. The depletion rate has now risen to 5.0%/yr or in other words, Saudi Arabia is extracting their oil at a higher rate. There is a chance, probably after the US presidential election in November, that Saudi Arabia will reduce their depletion rate back to about 4.5%/yr. If this is done then the production rate would have to fall by a one off 10% or about 0.9 mbd, in addition to normal decline. Furthermore, this would also imply that Saudi Arabia's average crude/condensate production rate for 2009 would be about 8.0 mbd, rather than the 8.9 mbd shown below.
Saudi Arabia Crude & Condensate Production to 2020 - click to enlarge
The next chart has also been updated but hasn't changed significantly from the last update.
Saudi Arabia Crude & Condensate Production to 2080 - click to enlarge
World crude/condensate production to 2012 has been updated for the recent EIA data release and also for the Aug 12 EIA STEO.
http://www.eia.doe.gov/emeu/steo/pub/contents.html
The chart indicates that crude/condensate production has stayed at about a high 74.5 mbd from May to July. The drop for August is due mainly to the Russia Georgia conflict interrupting oil supplies from Azerbaijan through the Georgian part of the oil pipeline and summer maintenance.
Weak demand and recent high production rates of crude/condensate have contributed to the recent fall in the oil price. However, as crude/condensate production rates are forecast to decline, this will place further upward pressure on oil prices.
http://www.theoildrum.com/node/4397/392132
World Crude & Condensate Production to 2012 - click to enlarge
I definitely find that the average depletion rate of remaining reserves is akin to smoke monitor -- very sensitive to perturbations in output if you start with a good stable model.
Are we ignoring, then, the comments from al Husseini and the recent seeming confirmation from BusinessWeek, or are we considering those not to be useful as they are not data sets? Even if not data sets, do they not help frame the discussion, particularly since the claimed info from both comes from insiders? Are our models more reliable than info from those who worked/work there (assuming reliability)?
Cheers
ccpo,
Here are two production capacity charts from Husseini's presentation at the Oil & Money October 2007 conference. Husseini is an insider but until the IEA confirms Husseini's forecast, few governments/companies will accept his forecasts. I view Husseini's forecasts as a best case scenario.
http://www.energyintel.com/om/program.asp?year=2007
The first forecasts crude oil production from the Middle East which shows Saudi Arabian crude exceeding 10 mbd in 2011.
Middle East Crude Production Capacity to 2030 - click to enlarge
This chart shows world crude oil and NGL production, which excludes BTL, CTL, GTL, ethanol and refinery processing gains. It shows a longer plateau than my forecast.
World Crude & NGL Production Capacity to 2030 - click to enlarge
(Note as NGLs stay constant at about 8 mbd, Husseini, being an ex-Aramco executive, probably uses Aramco's definition of NGLs which includes propane, butane, condensate and natural gasoline but excludes ethane.)
Thanks for the reply, ace. (By the way, on re-reading my own post, it could have been taken as sarcastic or otherwise "pointed," which it wasn't, so I hope you didn't take it that way.)
Looking at what you have above, it seems in line with realistic expectations to me, at least with regard to SA. It looks like about 2mb/d over their 2007 production. That fits well the combined numbers of Husseini and the BusinessWeek article. It may be a little optimistic, but not by much. The world total also may be a little optimistic, but we are expecting a peak in new production over the next year or three according to the Megaprojects, no?
Anyway, I was mostly curious whether anyone else is actively figuring those two resources into their calculations. Between the decline of Russian production and those reports on SA, I think the deal is sealed. A million or two difference in production over a couple years won't mean much in the long term.
Or maybe I'm just lazy and looking for the Occam's Razor approach to Peak Oil.
;)
Cheers
Hey hey JoulesBurn,
The green line for existing production looks linear, but I have been conditioned to believe that depletion follows a bell shaped curve. Is the green line perfectly straight because you are extrapolating from an existing trend? That is, given what we know about depletion should the green line be straight? And lastly, what would future production look like if the existing production is plotted with the nice symmetric bell curves we all know and love?
Thanks in advance,
Tim
Part of the reason for doing yet another forecast is to diverge from the idea that past Saudi production data is just a mysterious monolithic stream upon which we can only imagine a bell-shaped decline conveniently happening very soon after the present. In essence, there are two trends: legacy production (undergoing a steady decline), and added production (stable after addition). Now, there are many reasons why the legacy decline might steepen, but it is not evident in the data.
It's important to note that the trend for existing production (yellow line) is itself a combination of many trends:
Coming up with some sort of a priori model which takes all of this into account is a bit of a challenge. The prior trend looks linear, so I'll go with that for a rough guess, but it will be increasingly hard to maintain that trend given that Ghawar looks more and more like a junkie with no place left to stick a needle.
Excellent summery Joules. And, as usual, we're back to the one big physical uncertainty: changes in the decline rate at Ghawar. In addition to recent horizontal drilling I've heard anecdotes that the KSA spent around $9 billion in the late 90's on a significant increase in horizontals in the field. Can you confirm this? Even more important, can you offer a guess as to what percentage of Ghawar production is coming from horizontals? Most here already know that horizontal oil wells typically exhibit a very low decline rate until the water level reaches the well bore when it then drops very dramatically. If a significant portion is from horizontal production predicting future Ghawar decline is akin to walking thru a mine field. Everything seems fine until you take that last step and you world turns upside down.
Beyond the physical deliverability of KSA oil I’m wonder when production management objectives will be based upon sound business principles as opposed to maximizing immediate cash flow. I watched the KSA eventually flood the market with $10 oil in the mid 80’s in an effort to recover market share they had lost. As a result of the demand destruction (a 15% decrease in global oil consumption) caused by the previous price spike the KSA kept cutting production to maintain pricing for the rest of OPEC. Eventually they were forced to compete on a price basis with the other exporters. But this isn’t 1986. Almost all the oil exporters now admit they are at or past their own PO. As the other countries continue maximum lifting the KSA will have the option to use their added deliverability to take market share away from the other exporters. But if the KSA is satisfied with their cash flow (remember: OPEC earned almost as much income in the first half of ‘08 as they did during the entire year of ‘07) they may be content to reduce their lifting significantly below the capabilities. I would also expect the KSA to temper their price expectations by monitoring the world economies closely. They remember better than any how their revenue stream suffered with the 80’s demand destruction. We probably need to wait another 12 months before we see the true impact of the price increases during the past year. Given the inflation time lag and the wild cards like China I’m not sure anyone can make a supportable projection on global oil demand in 12 months.
And, thus, we’re back to watching the race between Ghawar decline and demand destruction growth, IMHO.
Most of the increased deployment of horizontals in the late 90s was in Shaybah:
As to how much is currently flowing from horizontal wells, if one assumes that all of the more recently placed wells are fully open -- and given that as per KSA 80% are horizontal -- a large and increasing fraction is from these types of wells.
Good info Joules...thanks. But all the more worrisome. I've seen many horizontal wells go from great producers to losing 90% of their net rate in as little as 6 months. A good rule of thumb has been to cut production rate by at least 50% when the water hits. But half the time operators don't because they think the laws of physics apply to others and not them.
Millard...you are the optimist, aren't you? I hope you're right. I can make a good living at $50 oil and the economy would certainly just buzz right along too. I've got 7 more years to retirement and would enjoy seeing the volatility disappear till then. But I seriously doubt it will. My big concern is how much worse it will get.
Rockman: Check out what happened after the last oil spike (1979-80). Hey, you might be as old as myself, and actually remember the last go 'round. Check out the literature prevalent at the time. It was gloom-and-doom, much of it compelling reading.
Instead we ended up with a glut.
I am worried by the amount of oil controlled by thug states, who are not investing, and developing, like free societies.
On the other hand, conservation measures are very powerful. The GM Volt and other EVs promise to radically curtail demand. Jeez, France, with its nuked-up electrical grid, and EVs, would hardly use oil at all. Who will buy oil when EVs rule the world?
Yes Millard...I am a card carrying member of OFI (Old Farts International). I remember those times well. In 1985 I was getting up at 1AM and delivering produce to restaurants. Others with Master's degree in geology were't so fortunate. So you can imagine that I never take the good times for granted. But it's not 1986 and we still haven't seen anything close to the demand destruction we saw back then. Oil is exactly where my 6 month running average said it would be 6 months ago...right around $110. I'm not really that smart...just that blind pig thing. I'm certain we're at POP (Peak Oil Plateau). The best I think we can hope for over the next 10 years or so is that Saudi accepts the role of good shepard for the world economy. Bleed us but don't kill us.
I am worried by the amount of oil controlled by thug states, who are not investing, and developing, like free societies.
-----------------------------------------------------------------------
Say like Mexico? or Indonesia which we supported for so many years during the Suharto dictatorship until her oil ran out? We are interest in oil for oil and money sake -- it's just hard to hear any more of the craps about development of free and open societies. Oh, I even almost forgot about Iraq ...
Oil prices are collapsing now, so the the era of demand destruction may have to wait. Obviously, the U.S. alone could take 6-10 mbd off the market in the next 10 years, if gasoline went above $5 a gallon. And I think you would see a flatlining of China demand for foreign crude in another 5-10 years, if oil stayed high (they switch to other sources, including jatropha, CTL, and higher mpg cars).
Problem is, oil prices collapsing as we speak. The bottom of this rout could be $90, but once it goes that far, it might be $60, as speculators continue to liquidate positions. The commodities funds are going to suffer multi-billio-dollar withdrawal days, and they will collapse and liquidate. Ouch.
Conservation efforts will slow...and maybe we get another run-up in five years, or maybe 15 years.
I thought we had seen Peak Demand...but oil may see $30 a barrel again, so I am no sure of that anymore.
Since you are the expert, exactly what is the demand for $30 crude oil? My guesstimate would be well in excess of 100 mbpd.
Actually, I ended my post by saying I am "not sure." I may be the only non-clairvoyant posting on TOD, either among readers or hosts.
Demand for oil in the short-term tends to be inelastic, then becomes elastic over time. A quick drop in the price does not boost demand by much. It takes years. Thats how we end up with gluts.
A quick boost in price, vice-versa.
Geologists and doomers tend to think of demand as inelastic.
Hey..watch that Millard. I'll come back with a snappy retort as soon as I figure out whether me and other geologists should be insulted by your remark. Inelastic? Is that anything like non-compressable?
As a woodworker, I am an authority on inelasticity. It comes from cutting boards short.
I know what you mean. Better to nullify elasticity in finish carpentry by sneaking up on it like a good indian, i.e. make ever smaller cuts until it fits perfectly.
"Geologists and doomers tend to think of demand as inelastic.."
where oh where do you get that idea ?
do wooodworkers and cornucopians tend to think supply is inexhaustible ?
No, you aren't even remotely close to being the only one. If you read carefully you'll see a lot of people who are very unsure what's happening. Using a rhetorical tactic like this to bolster your position makes people less likely to consider what you're saying.
Yes. This is not talked about enough. The amount of unfulfilled global demand for oil is gargantuan. I started investing in coal years ago, based on exactly such a thesis. I shudder to think how high we would have gone in the oil price already, were Asia not have been able to reach so hard for coal. (One could make a counter-argument to this: that coal was a marginal source of undervalued BTU's that allowed for industrial expansion that in turn also ramped and triggered new demand for oil). Regardless, we have already seen what happened in the US when gasoline fell back below 4.00. "Demand destruction" data created as gasoline went above 4.00 was very quickly reversed when gasoline fell below 4.00. I am joking that the new phrase should be "Demand Suppression."
My view is that the marginal bbl has now risen to 90.00 USD. I use Russian Export duties, YOY inflation in oil services, other spiraling costs for unconventional oil production, and commentary from internationals like Statoil and Petrobras to get to this level. Give the world 90 days of oil between 90.00 and 100.00 and I believe we'll see two sets of data: 1. Hoarding by users. 2. downticks in production by producers pumping the highest cost oil.
G
if oil hits $30 again, it will be because that's all people can afford.
It might be worth pointing out that the US gasoline demand is running at just about 9.1 million bpd, down about 1.6% from 2007...out of ~20 million bpd total consumption.
You aren't going to see anywhere near that kind of demand destruction in gasoline (6-10 MMBPD, I don't think you meant thousands as that gets lost in the noise) from $5/gallon. Maybe with $10-25/gallon you could see several million bpd drop off from overall consumption (say back toward some monthly numbers we saw in 1982-1983 where consumption was around 15 million bpd).
To drop that level of consumption that you suggest would put us back to levels seen in the mid-late 1960's when the population was (just) under 200 million people in the US.
The early 80s decline was in all sectors, too. I seem to recall reading that in the US this was the last of the oil burning electrical generation being shifted over to other sources, excepting the odd plant in Hawaii/Alaska. Are we seeing similar broad declines now, or is it purely happening in the transportation sector? If so, the parallels with the early 80s may not be there...of course, I'm with those who seriously doubt we're going to see a massive glut of oil anytime soon.
The Volt, what a joke. Bets on whether GM lays off the engineers before going bankrupt? Already needing Iaccoca style bailouts after one measly price rally. Toyota at least have a game plan, but the fact that they're spending $1.3 billion on a new plant to build 150k Prii/year, instead of tens of millions revamping an existing one, suggests that they won't be cranking out millions of PHEVs anytime soon.
We are 20-something mbd now, with a terrible fleet of huge, wasteful cars. 70 percent of oil consumption in U.S. is transportation. It will take 15-20 years for EVs to replace ICE, and then only if prices stay up.
But, assuming prices stay up, the switch to EVs should wipe out about one-half of oil U.S. consumption, along with other conservation measures.
The US switch to EVs (and mass transit, scooters, moving closer to work etc)will take about 10 mbd off world demand markets. Global demand now is about flat. Europe will be using less and less too.
I see a future of cleaner U.S. cities, and quieter streets. Not so bad.
While the US has discretionary demand that it can easily destroy--and indeed, we have been destroying it--we have a significantly lower level of discretionary demand than we had in previous oil shocks. While the advent of the SUV catches everyone's analytical attention as the signature of a petro-guzzling country gone wild, it behooves to remember that the rise of the SUV is actually more of an outlier in a 30 year trend, where petrol expenses have been in a downtrend as a percentage of disposable income. Furthermore, the rate of change (ROC) of gasoline prices this decade has been rapid enough, that US demand started pulling back years ago. OECD demand growth has been punk for years now. We need to remember that 55.00 dollar oil in Q3 of 2004 was a real shocker to people. That was nearly 4 years ago. Americans have been paring back discretionary gasoline demand on both a multi-decade basis, and over the past 4 years.
This is why the situation is rather tough. We have a long 3.5 year tail behind us of zero production growth. So there's no wall of supply coming along behind this demand softening, as there would be in past times. Second, OECD demand has been paring back for years. Third, new petrol users in emerging markets are what I call fractional users. By this I mean, there's a ton of new users of oil but each one uses a modest amount.
Not a good situation for us. BTW, I hope all those who follow oil either watched, or will watch, the opening ceremonies in Beijing. That performance pretty much told you all you need to know about how this situation is evolving, and the power and meaning of large numbers.
G
A "I may be the only non-clairvoyant posting on TOD, either among readers or hosts."
B "I see a future of cleaner U.S. cities, and quieter streets. Not so bad."
Shoud I believe A or B?
"collapsing" ...??? Just a few months ago oil at $115 was a near fantasy mostly predicted for years ahead. $115pb is NOT a collapse. Al this illustrates is how quickly we become habituated to new realities. We can't see the wood for the trees.
If you really believe oil will hit $30pb you need a reality check ...
~1.4 MBPD of NGLs are produced in KSA.
KSA internal consumption of all liquids is ~2.1 MBPD.
Please can somebody tell me:
What % of these NGL would be expected to be exported?
What % of gasoline can NGL be as a maximum?
Can you blend a lot of NGL into gasoline in hot countries like KSA, or would the NGLs be used for cooking and non-transport purposes?
I ask because I am doing a major review of net exports and I am mostly interested in C+C since that is the stuff that will peak and is vital for our transport.
Thanks for any help.
NGL mainly goes to petro chem feed stock. But if you don't have a supply of NGL then you need to crack some higher liquids, so everything is interconnected.
We should have a post on this next week.
Thanks Euan, you are confirming what I thought! NGPL are not, in general, used directly as transport fuel, hence my insistance on looking in some detail at C+C.
So for KSA in 2007, if we believe the EIA figures (which I don't completely!):
production of C+C was 8.72 mbpd
domestic consumption of 'all liquids' was 2.12 mbpd
'net exports' of C+C minus domestic all liquids was ~6.6 mbpd
So, how much of KSA 'net exports' is anything other than C+C.
This question is most important for KSA because they produce so much NGL ~1.4 mbpd ... but do they export it? ... it could be as much as 20% of their declared 'net exports' or as little as zero if their petrochemical industry uses it all? ... does anybody know where I can find the answer or a rule-of-thumb approximation?
Xeroid,
Your point raised is important as Saudi Arabia's exports of NGLs won't be changing much in the future because Saudi Arabia needs these NGLs for its own consumption, leaving less for the rest of the world.
The EIA states that for 2007, Saudi Arabia's NGL production was 1.44 mbd. The EIA includes ethane in its NGL definition.
http://www.eia.doe.gov/emeu/ipsr/t13.xls
There is some info on NGLs in Saudi Aramco's 2007 Facts and Figures (F&F).
http://www.saudiaramco.com/irj/go/km/docs/SaudiAramcoPublic/FactsAndFigu...
Page 9 F&F says that "Sales gas and ethane are consumed by the Kingdom’s utilities
and industry. Propane, butane and natural gasoline (also known as natural gas liquids, or NGL) not used by domestic industry are exported to world markets." Two points from this quote is that Saudi Arabia, unlike EIA, excludes ethane from its definition of NGL and that all ethane is used by Saudi Arabia.
Page 33 F&F states that Saudi Aramco NGL exports for 2007 was 287 mb or 0.79 mbd.
What about Khursaniyah NGL and Hawiyah NGL contributions to exports?
Page 10 F&F says that "the Hawiyah NGL Recovery Plant is designed to process nearly 4 billion scfd of sales gas to yield 310,000 barrels of natural gas liquids as feedstock for the Kingdom’s petrochemicals industry." It appears the rest of the world doesn't get any Hawiyah NGLs.
Page 10 of 2006 F&F says that Khursaniyah is to produced 290,000 bpd ethane & NGL.
http://www.saudiaramco.com/irj/go/km/docs/SaudiAramcoPublic/FactsAndFigu...
How much of the 290,000 bpd is NGL (Saudi Aramco's definition)?
According to Sadad Al Husseini's presentation in late 2007, only 80,000 bpd.
http://www.energyintel.com/om/program.asp?year=2007
To sum up, the EIA says that Saudi Arabia's 2007 NGL production was 1.44 mbd (incl ethane). Khursaniyah/Hawiyah should add another 0.6 mbd to give future NGL production of 2.04 mbd. 2007 NGL exports was 0.79 mbd but only an additional 0.08 mbd will be available for future export from Khursaniyah/Hawiyah for a total possible future NGL export of 0.87 mbd.
Ace, thanks for that - I can make some adjustments to my C+C 'net exports' data.
It seems to me that the historical data are deliberately constructed so easy comparisons can't be made even though people must know the actual underlying separate elements, I wonder who benefits from the obscurity?
Deputy Prime Minister Barham Salih told Reuters in April he had seen estimates from "reputable companies" that put Iraq's oil reserves at some 350 billion barrels, a massive figure which would put the country ahead of Saudi Arabia.
http://www.reuters.com/article/GCA-Oil/idUSN0725356520080807
In the Middle East, wild exagerations are part of their culture, a form of machismo. The huge estimate in this article is in line with previous bold statements made, that have never been substantiated.
In line with their historic expertise with negotiating and bartering, which consists of lots of boasting.
Okay, stupid question for you:
Wouldn't putting a new well next to the existing well decrease the output of the old well?
___|_______|_______
.......|.................|...........
.......|.................|...........
.......|.................|...........
.......|.................|...........
.......|.................|...........
~~~~~~.......~~~~~~
~~~~~~~..~~~~~~~~~~~~
~~~~~~~~~~~~~~~~~~~~~~~
~~~~~.......~~~~~~~
Alright, I'm done with the ASCII art (might get messed up anyway). Are they not... connected at some point? I understand these are pressure driven, so even should they be not connected, somehow the fluids in the ground may be pushing against each other - that sounds reasonable. This would mean that, to a degree, new wells increases depletion of what we're getting as well as reaching new oil.
If so, wouldn't that require some revision of the production forecast of existing wells as new ones are added? Is this already done?
Thank you for addressing this completely uniformed question.
It depends on where the new wells are going. In the case of new production from the so-called megaprojects, they are going into areas where there is currently no production. Thus, these additions do not intrinsically affect existing wells in other areas.
For new wells in northern Ghawar, new wells are drilled into remaining undrilled sections or untapped reservoir levels, replacing wells in watered-out areas currently producing at high water cut. This would yield higher oil production with lower water requirements (both in and out) until this new well gets water.
I remember first getting my head around the idea years ago that once Ghawar peaked, then KSA had peaked, and therefore the world had peaked. Now, however, with KSA and Russia trading places in recent times for No. 1 and No. 2 producer, I conclude that we have peaked when either KSA or Russia peaks.
A protracted global recession would give either KSA or Russia time to rest their fields, and then in the next demand upswing, I suppose they could gun production higher for a 3-9 month period, and hit new highs on the monthlies. However, as I believe the current macro consensus for a notable global slowdown is likely overstated, at this time, I don't think we'll get the severe recession soon enough.
No, the big recession that will come imo will be on the back of a gargantuan super-spike in oil, that will have both price-altering and psychological altering effects on economies, at the same time. Right now, real interest rates are still negative, here in the US. And are tipping towards negative elsewhere in the world. While everyone is fixated on the credit crisis (many of us started worrying to death about it years ago) there is significant risk that what happens next is that years of aggregate global monetary stimulus kicks in right at the moment when people are worrying most about deflation, again. As in, right now. I don't think we have created the conditions yet, therefore, that would trigger a recession big enough globally to buy us time. In, fact, I think the risk is the opposite. I suspect Asia, for example, is about to accelerate again.
If one agrees that 2004 was a re-pricing year, when Oil broached the previously unimaginable level of 40.00, and the "crashed" from 55.00 to 40.00 later that same year ("the bull market in oil was over, done, toast, etc") and then one further agrees that 2008 is also a re-pricing year, then I think we've got a mammoth, new price level ahead of us in the next 12 months.
Does anyone else think Putin is now quite aware that oil left in the ground will likely appreciate faster, than the currency one could receive for it would appreciate, invested in a different asset? I do. Sure, Russia needs to continue to monetize resources to build out their infrastructure. But Russia has more than just Oil and Gas to sell.
It's getting to the point where the global production statistics from Exporters are depressing enough, but alone, no longer tell the story after one adjusts for both (actual) Exports and either intentional hoarding (keeping more in the ground) or function hoarding (domestic strife).
Dare I say it? KSA looks more and more like a major piece in the puzzle. But, no longer the seminal piece of the puzzle.
G
Joules - the 1% apparent decline on existing / heritage assets is an interesting number. Though I suspect this may take a couple of step changes down when dry oil areas in N Ghawar dry up - before continuing on the 1% trend?
Joules,
Does this claimed Khursaniyah delay change your forecast?
Khursaniyah now delayed to mid 2009
Don't know the credibility of this story but it says that:
source
Walker's World: $200 oil is coming, Aug 11, 2008
http://www.metimes.com/Security/2008/08/11/walkers_world_200_oil_is_comi...
Interesting, if true. I had already pushed it back to 2009 to be conservative.
joules,
as you state, severe decline isnt apparent from the available data.
for ghawar, at least, we are back to applying a recovery factor to volumetric calculations.
for ghawar, using 50 Gb remaining oil implies a minimum average annual decline of about 3.6%.
for the 30Gb remaining case the minimum average annual decline would be about 6%.
these values correspond to a recovery factor of about 65% and 50%, respectively of ooip. some are estimating a much lower recovery factor and by implication, a steeper decline.
Elwood,
I know we have to start with a relatively simple model for Ghawar but I think you also understand the nature of water drive reservoirs. It does vary but most water drive reservoirs show a dramatic change in decline rates when a significant water cut develops. I’ve seen many fields develop decline rates around 1% once water cut has reached 70% or so. And they’ll continue commercial production down to a 99% WC. This last production phase can last decades and account for as much as 20% to 30% of the URR. Now, as joiles points out, add that to the high percentage of horizontal wells contributing to Ghawar production and the very rapid negative stepwise change in net oil production they can generate. With those two factors I’m not sure we aren’t at the point where predicting future net oil flow from Ghawar is beyond our ability to estimate with any certainty. Of course, if we had the data base the KSA has, we’ve got enough smart folks at TOD to come up with a very accurate prediction. As much effort as so many folks have put into the process here (and as important as it is) I’m not sure we haven’t reached a real data roadblock.
The limiting factor for extended production at ever higher water cut is water facilities. Some of the additional capacity of water piped from the sea as part of the Khurais project is slated for Ghawar, but I haven't heard of any new GOSP developments. Let's see if they materialize.
A big factor for sure Joules. I intentionally left out the major expansion of GOSP's from the scenario. I've seen operators give up on high water cut production because crude prices at the time didn't justify expanding the GOSP system in place. I would hope the KSA could anticipate the expnasion requirements. But even with all the data in hand it's still an educated guessing game. Having to seperate an extra 20 or 30 million bwpd from a declining oil rate might not be managable in the short term. I've worked with small GOSP but it's difficult to imagine the process on the scale that could be required. Without spending a fortune on chemicals the "settling time" for such huge daily volumes would likely require 100's of million of acre-feet of storage. There are a few mechanical seperation systms that could speed up the process but, again, the scalability of such an effort boggles my mind.
Because of the wide mobile oil saturation in the Arab D of almost 0.60... Buckley Leverett Tangent Construction to any constructed fractional flow curve will result in a very high saturation behind the flood front, limiting post breakthrough oil recovery here. This is the result of the low connate water due to the 1,300' of closure and the favorable mobility ratio (oil appears more mobile than water.. I think the oil viscosity is 0.8). In fact water coning probably doesn't occur.
When it breaks-through it is most nearly gone.
The deconstruction of the "wet-dry" area percentage curve with oil production and field water cut presented in SPE 93439 for North Ain Dar reveals a scary underlying WOR vs cumoil trend if you know what you're looking at.
They wrote a paper entitled "Water Management in North Ain Dar" which if you reverse engineered the data--- showed that their water management strategy was to open the chokes and drill more wells (increase withdrawals) in the dry crestal area.
FF
In fact one may say that there pride in managing at a constant water 40% water cut in both North Ain Dar and North Uthmaniyah doesn't suggest a production crash--- it guarantees it.
FF
Great info FF. I'm so use to dealing with low mobility oil that it's difficult to switch gears when thinking about such near perfect sweep. There's a field I've been trying to get my hands on for over ten years. Drilled on 40 acre spacing you can drill an infield well 60 years after it went on line and still find almost the same o/w level and original oil saturation. It's taken 60 years to reach 50% recovery. Viscosity is between 4 and 5 cp....and that ain't Ghawar by anymeans. Back in the 90's an operator put down an infield horizontal and made 200+ bopd between 4 stripper wells with a 90%+ water cut. The well failed mechanically and no one has tried it again in that field.
Rock-
They have built the textbook circumferential artificial acquifer on wide spacing with a less than unit mobility ratio.... and they are almost at a 50% water cut.... you have obviously worked on total water drive reservoirs.... how well can this end??
That sounds like a sweet deal but how can you achieve a 50% volumetric recovery with no water oil contact advance??
FF
They are rather unique reservoirs FF. The water does move up and very quickly...within a year or less in many cases. But it only moves up proximal to the well bores. Literally, the oil over most of the life of each well doesn't flow so much as it is entrained in the water production. Think of it as the ultimate water coning scenario. These are very high porosity and perm formations. In the early days operators choked wells back to aid recovery. All that did was lower net oil rates to near uneconomic levels. Additionally, these sands are completely unconsolidated. Pull a well much over 100 bfpd and you plug the tubing. Even with out pulling the formation in the sand is very abrasive. ESP’s bare get a 60% run time. Most try to stay with gas lift. Most of these fields had a significant up tick way back when gravel packing became all the rage…field rates went up 10 to 20 times. And the oil is only around 23 gravity so it’s not really very bad stuff….just very low mobility. Most of the fields produced 80% of their recovery at 75% w/c or higher. I know it’s hard to imagine but the unmoved water level between producers has been proven by dozens of wells drilled in many fields in the trend. Operators knew about the phenomenon since the early 60’s. Other then putting in ever increasing water disposal no one has come up with a better production technique. Even my horizontal redevelopment idea doesn’t solve the basic problem. My design would allow 3000 bfpd rates which would be up from the 300+ bfpd rate the vertical wells are doing.
buckley leverett gives a high saturation behind the flood front, but as you know buckley leverrett is a model based on heterogenous rock and one thing ghawar is not is heterogeneous.
i dont see any reason to assume that the saudi's havent figured out, or wont figure out, how to produce large volumes of water.
im too tired and it's too late to look now, but i thought the viscosity of the oil at reservoir conditions was in the range of 0.5 cp.
Elwood-
Buckley Leverett is to displacement as Ohm's Law is to electricity or F=ma is to motion. Ignore it at your own peril.
I was simply responding to the after breakthrough comments and how the Arab D is the ideal piston like displacement reservoir in every manner possible.
And when the dry oil area is completely gone (240' left to climb the crest)this baby will drop like a rock.
FF
ff, thank you for your response.
"Buckley Leverett is to displacement as Ohm's Law is to electricity or F=ma is to motion. Ignore it at your own peril."
i dont think buckley leverett can be ignored any more than f=ma. but at the same time the 'a' part is what drives gravity drainage.
not really directed at you, ff. but imo petroleum engineers have (all but) ignored gravity, at least of late(that would be the past 50 yrs or so).
Elwood-
Agree about the gravity part.
The Saudi's themselves say by and large that Ghawar can be treated as a simple bottoms up water drive with the large interwell spacing (smaller everyday according to Joules) and favorable mobility ratio.
I don't think there has every been a situation where a country's oil production rested on such a tenuous balance. Four and a half million barrels a day under an extreme water drive..... 70% depleted now by their own admission... it is scary as hell.
FF
rockman,
yes i understand all that and that is why i estimated a minimum average annual decline. stepwise, hyperbolic or otherwise these are the minimum exponential annual decline rates that would give the remaining reserves starting at 5 million barrels/day, a simple model to be sure.
a million barrels/day supply lost in the next six or so yrs from a single field currently producing almost 7% of the world total.
elwood,
I wasn't debating your work on Ghawar...sounds like you have a good handle on it. I just thought you were curious about those south Texas reservoirs. They've frustrated geologists and engineers for decades. There are literally billions of bbls of stranded oil at 5000' and no one yet has proven a viable technique for getting to them other then to keep sucking themout at 1% oil cut.
This statement could use some supporting data. I am assuming there are well documented examples showing that other large fields have a high concentration of wells in the center when output is passing peak?
Greetings from Germany!
First, the existing production declines at 25% in 25 years, this rate seems to be very low. As you never said, which decline you expect no helpful discussion about your post is possible.
This is also true for the "new" production, which might decline itself, and even faster with each new project.
I simply don't understand why you did so. Your post is mostly arguing and showing pictures, but for me numbers are missing.
MFG
Guten Tag!(or abend by now...)
The reason that I don't expect the newer assets to decline appreciably in the next 7 years is that they probably won't -- based on how they are being produced. They are being produced at low levels relative to the reserves, and new wells are drilled to maintain production at the target level. This strategy eventually runs dry (same as in Ghawar), but it doesn't make sense to predict a decline when wells are constantly being put in to keep production steady. The Haradhs I and II and the Shaybah projects are examples from the past, and there is no good reason to believe that Khurais is going to ramp up to 1.2 M and then immediately decline.
Faster decline of older assets (N. Ghawar, etc.) than I have predicted is more likely.
I say you and Euan split the difference and we basically bump up against 10 MMBOPD for the next 7 years.
FF
I'm with you FF. I could easily be wrong but I like to think the KSA will moderate DD in the global economy to keep prices (at what ever level works) stable. And if they can maintain that production level w/o expanding production capabilities (at least in your 7 year time frame) at the cost of many 10’s of billions of $'s they'll be happy just to let that money sit in Treasury notes until they need it. And if DD gets ahead of them a little I still think there's a fair chance that they'll cut rates instead of prices. And extend reserve life in the process. As I've said before: it's not 1986 and the rest of OPEC isn't really in a position to compete on a price basis with the KSA as they were back then. No telling what social unrest might push Mexico to do but it wouldn't make sense for them to sell their quickly declining production at bargain basement prices to keep market share from the KSA et al.
It's just as obvious to them as it is to us that the oil exporters could cut production rates 50% for the rest of the year and easily net a greater cash flow for 2008 then they did in 2007. I'm not even sure the fear of pushing the oil consumers even faster towards alternatives is that big a concern to the KSA et al. In the end it's a numbers game and they know their potential decline rates better than we do. If they see serious reductions in production capability greater than most of us suspect they may actually feel it’s politically advantageous to nudge us away from oil as fast as possible. If the US economy is hit with a very quick and significant oil shortage we might start suspecting weapons of mass destruction hiding in the KSA. I can’t imagine that thought doesn’t float around the KSA from time to time. And regardless of one’s moral view of swapping blood for oil I’m suspect that thought isn’t floating to far below the surface from all the sterile number crunching here at TOD. A very unpleasant thought but rather unavoidable for many.
Here's a question for you guys... When Saudi Arabia nationalized their oil, the (conservative) estimate of reserves was a little over 100 billion barrels, right? Which is pretty close to what they've produced so far. Their current numbers estimate more than double that (but, everyone pretty much agrees that they're lying about that), despite no new fields being discovered. So, the question is, if we can't trust the new numbers, just how accurate were the IOC's reserve predictions pre-nationalization?
Shouldn't we be able to estimate Saudi Arabia's reserves fairly accurately by taking some other producing area (outside of the Middle East) that was discovered and exploited at around the same time as Ghawar & Abqaiq (with similar geologic characteristics, of course, no sense comparing Texas to Saudi Arabia when Texas can get twice the amount of oil from those types of rocks), and comparing the IOC's estimates for those areas (at the same time as they were last estimated for Saudi Arabia's reserves) compared to how they played out in the long-run vs. the IOC's last estimate?
For instance, if we look back at an area similar to the Middle East in geology/exploitation/exploration (where, I don't know), and look at what the IOC's were estimating reserves at the time and compare that to how much oil that area ultimately produced. We should end up with a percentage that the 1970's numbers underestimated the truly exploitable reserves by. If we pick a place that's as similar to Saudi Arabia as possible in all possible ways, the percentage we find should be the same in both places, give or take a bit. It'll be the percentage that new technology has increased production in the intervening years. Add that percentage to the last reliable Saudi reserve estimates prior to nationalization, and we should have a much more accurate guess for Saudi Arabia's true reserve potential...
Does anyone know an analogous oil-producing area and how accurate the major oil companies were with their reserve estimates 40 years ago?...