World Oil Forecasts Including Saudi Arabia - Update Aug 2007
Posted by ace on August 22, 2007 - 10:00am
PLEASE NOTE: click on the link below for the most recent oil forecast update
http://www.theoildrum.com/node/3623 which includes forecasts for Kuwait and the UAE.
Executive Summary
- World total liquids production (Fig 1) remains on a peak plateau since 2006 and is forecast to fall off this peak plateau in 2009. According to the IEA, the current peak production of 86.13 mbd occurred on July 2006 and only one year later, June 2007 total liquids production fell to an unexpectedly low 84.28 mbd. As long as demand continues increasing then prices will also continue increasing.
- Forecast world crude oil and lease condensate (C&C) production retains its 2005 peak (Fig 2). The forecast to 2100 shows declining C&C production, using a bottom up forecast to 2012 (Fig 3). The forecast to 2012 shows a 1%/yr decline rate to 2009, followed by a 4%/yr decline rate to 2012.
- World oil discovery rates peaked in 1965 (Fig 4) and production has exceeded discovery for every year since the mid 1980s. Discoverable reserves in giant fields also peaked during the mid 1960s (Fig 5). The time lag between world peak discovery in 1965 and world peak production in 2005 of 40 years is similar to the time lag of 42 years for the USA Lower 48 (Fig 6).
- World C&C year on year production changes to April 2007 and May 2007 (Figs 7,8) show significant declines for Mexico, North Sea and Saudi Arabia and significant increases for Russia, Azerbaijan and Angola. As Russia is likely to be on a production plateau and Saudi Arabia has probably passed peak production, the world C&C production will continue to decline slowly.
- Key producer Saudi Arabia retains its 2005 C&C peak (Fig 10), which is the same as the peak year for world C&C (Fig 2). Saudi Arabia C&C production has now dropped to 8.6 mbd which is 1 mbd less than its peak in 2005. It is now almost a certainty that Saudi Arabia passed peak C&C production of 9.6 mbd in 2005 (Figs 9,10).
- World natural gas plant liquids is forecast to increase due to new OPEC projects (Fig 11). World ethanol and XTL production is forecast to double by 2012 (Fig 12). World processing gains are forecast to decline slowly to 2012 (Fig 13).
1. World Total Liquids Supply & Demand
Although crude oil & lease condensate (C&C) production is forecast to continue declining, the total liquids supply remains on a plateau until 2009 (Fig 1), due to offsetting production increases from natural gas plant liquids (NGPLs), ethanol and XTL (BTL - biomass to liquids, CTL - coal to liquids and GTL - gas to liquids).
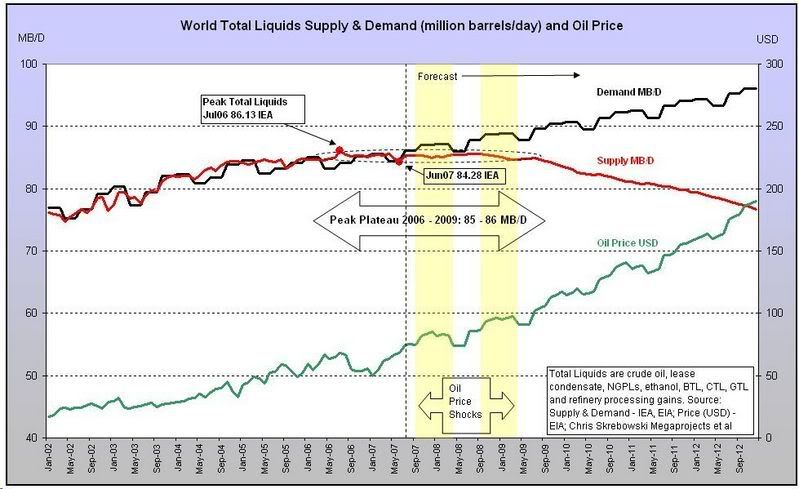
Fig 1 - Total Liquids Supply & Demand to 2012 (bottom up forecast) - click to enlarge
According to the 11 October 2006 IEA Oil Market Report Table 3, the current peak production of 86.13 mbd occurred on July 2006. On June 2007, total liquids production fell to an unexpected 84.28 mbd, from the 13 July 2007 IEA Oil Market Report Table 3, which represents a drop of 1.85 mbd, or just over 2%, in only one year.
This 1.85 mbd drop is due to falls in both OPEC and non OPEC total liquids. Unfortunately, OPEC natural gas liquids showed only a small production increase. OPEC-12 crude oil production fell by 1.60 mbd from July 2006 to June 2007. Although Angola crude oil increased by 0.14 mbd, the following significant decreases occurred: Saudi Arabia, 0.76 mbd; Iran, 0.30 mbd; Iraq, 0.12 mbd; Kuwait, 0.12 mbd; Nigeria, 0.18 mbd; and Venezuela, 0.10 mbd. Non OPEC significant total liquids increases were 0.46 mbd from the former USSR (Russia, Azerbaijan, Kazakhstan and others) and 0.25 mbd of biofuels from outside of Brazil and USA. Non OPEC significant total liquids decreases were from Mexico, 0.12 mbd; Canada, 0.19 mbd; and Norway, a big decrease of 0.71 mbd.
Is future total liquids production likely to exceed the current peak of 86.13 mbd on July 2006? It might be possible but it appears unlikely. Maintenance in the North Sea would be mainly responsible for the big drop in Norway’s production. After the maintenance is finished, North Sea production should increase in the next few months but then North Sea production should resume its decline. Mexico's production is in decline now. Former USSR production might increase by a small amount. Canada's production should increase slowly but the oil sands are experiencing production constraints and despite claimed reserves of up to 315 Gb (billion barrels), the oil sands will probably produce, at best, a maximum of only 2.5 mbd (million barrels/day). Biofuels production should also continue increasing. Non OPEC total liquids production might increase slowly, assuming that no unexpected disruptions occur.
In order for world total liquids production to exceed the current peak, OPEC total liquids production must also increase. OPEC meets next in September to potentially discuss production levels. However, OPEC will increase production if its members agree to increase production and if the many old OPEC oil fields are physically capable of increasing production. However, OPEC member Iran does not expect that production rates will be on the agenda. OPEC may have some capability to increase production but their remaining oil reserves could have a higher monetary value by holding production at current levels and selling remaining oil at higher prices later.
The challenges of increasing world production are highlighted by the former Saudi Aramco exploration and production head, Sadad Al-Husseini, who made this recent statement regarding the new sentiment of oil producers:
There has been a paradigm shift in the energy world whereby oil producers are no longer inclined to rapidly exhaust their resource for the sake of accelerating the misuse of a precious and finite commodity. This sentiment prevails inside and outside of OPEC countries but has yet to be appreciated among the major energy consuming countries of the world.
Al-Husseini also made this statement in 2005 about the physical ability of the world to increase production:
‘‘You look at the globe and ask, ‘Where are the big increments?’ and there’s hardly anything but Saudi Arabia,’’ he said. ‘‘The kingdom and Ghawar field are not the problem. That misses the whole point. The problem is that you go from 79 million barrels a day in 2002 to 82.5 in 2003 to 84.5 in 2004. You’re leaping by two million to three million a year, and if you have to cover declines, that’s another four to five million.’’ In other words, if demand and depletion patterns continue, every year the world will need to open enough fields or wells to pump an additional six to eight million barrels a day — at least two million new barrels a day to meet the rising demand and at least four million to compensate for the declining production of existing fields. ‘‘That’s like a whole new Saudi Arabia every couple of years,’’ Husseini said. ‘‘It can’t be done indefinitely. It’s not sustainable.’’
It is possible, but unlikely that world total liquids production will exceed the current peak of 86.13 mbd because this would require simultaneous and significant production increases from both OPEC and non-OPEC countries.
As world total liquids production is forecast to decrease to 2012 (Fig 1), two important consequences are likely to occur. First, as demand is forecast to increase, prices are forecast to rise, using short and long run price elasticities, which will force demand downwards to equal supply. Second, the decreased available supply may invoke the IEA Response System for Oil Supply Emergencies. Unexpected supply reductions could trigger oil rationing among the 26 countries which are signatories to this IEA Response System, but unfortunately China, Russia, India and Brazil, which are not signatories, are highly unlikely to agree to the IEA’s rationing method. The resulting tensions, from oil supply shortages, among the signatory and non-signatory countries could lead not only to continued competitive oil bidding, but also to continued conflicts and violence in order to secure vital oil supplies.
![]()
2. World Crude Oil & Lease Condensate Production
The largest component of world total liquids production is world C&C production. The first part, 2007 to 2012, of the forecast to 2100 (Fig 2), is created using a bottom up forecast based on over 300 continuously updated regions/projects from 2007 to 2012 (Fig 3). After 2012, two scenarios are shown. The first, the unlikely forecast scenario, shown by the green line, uses BP Annual Statistics Review 2006 proven reserves data which include grossly overstated OPEC reserves data. The second, the most likely forecast scenario, shown by the dark red line, is based partly on the BP reserves data, but large downward revisions are made to OPEC reserves and small upward revisions are made to the reserves of many countries to derive a more accurate estimate of proven and probable reserves. Yet to find C&C reserves are added to this estimate of proven and probable reserves to give world total ultimate recoverable reserves (URR) of 1.82 Tb (trillion barrels) including remaining URR of 0.78 Tb as at end 2006.
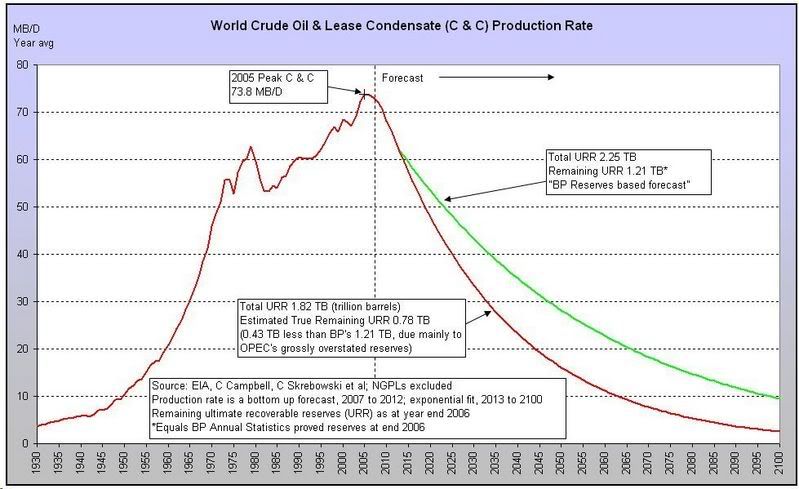
Fig 2 - World Crude Oil & Lease Condensate Production to 2100 - click to enlarge
World C&C production continues to retain its May 2005 peak and is forecast to decline by 1%/yr until 2009. The decline rate steepens to 4%/yr until 2012. The main reason for the end of the total liquids plateau in 2009 (Fig 1) is that the C&C production decline rate changes from 1%/yr to 4%/yr in 2009.
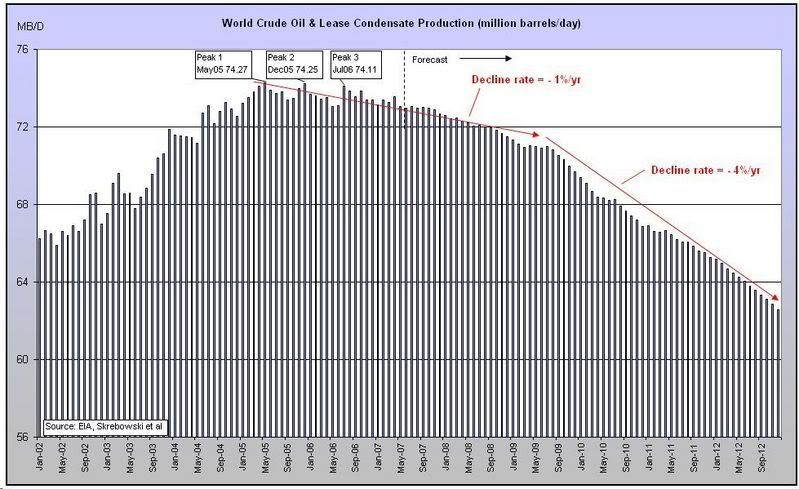
Fig 3 - World Crude Oil & Lease Condensate Production to 2012 (bottom up forecast) - click to enlarge
![]()
3. Peak Production and Peak Discovery Time Lags
Although the forecast production decline rate in Fig 2 appears high, it is a natural time lagged response to the peak year for discoveries as shown in this section. Fig 4 shows the peak discovery year in 1965, followed by a steady decline in the discovery rate. For every year since the mid 1980s, annual production has been greater than annual discoveries. This is not sustainable and it is inevitable that world annual production will start to decline. This timing of peak production and rate of decline is forecast by Fig 2.
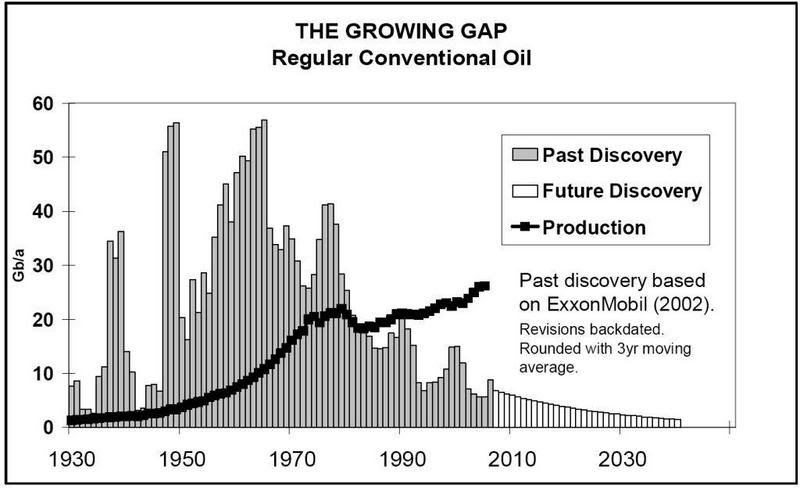
Fig 4 - World Discoveries (source ASPO Ireland Newsletter No. 80, August 2007) - click to enlarge
The figure below focuses on giant oil field discoveries and shows a similar shape to the figure above. The number of giant oil fields discovered peaked in the 1960-69 decade and both the number of giant fields and their respective recoverable reserves have declined steadily. The shape of the discovery decline curve below from 1960 to 2006 is similar to the production decline curve (Fig 2) from 2005 to 2100.
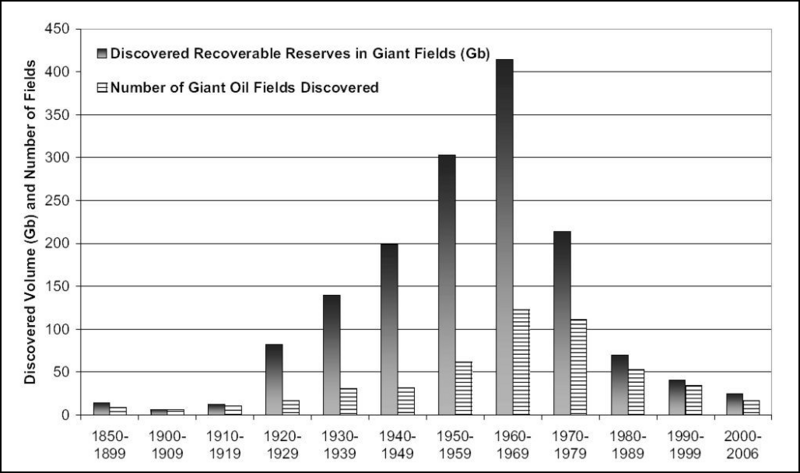
Fig 5 - World Discoveries, Giant Oil Fields (source Giant Oil Fields – The Highway to Oil, Fredrik Robelius, March 2007) - click to enlarge
A very good example of the time lag between peak discovery and peak production is the USA (Fig 6). Peak discovery was 1930 and peak production occurred 42 years later in 1972. Fig 4 shows peak discovery for the world occurred in 1965. Fig 3 predicts that peak production occurred in 2005, which is 40 years later than peak discovery, a similar time lag to the USA.
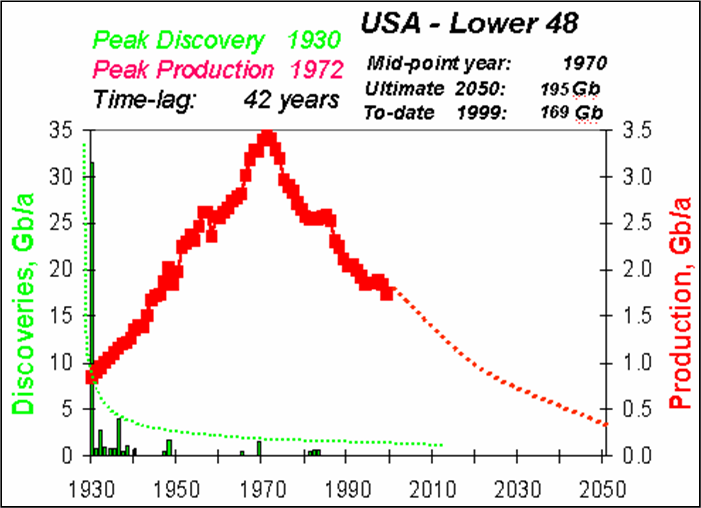
Fig 6 – USA Lower 48 Peak Discovery and Peak Production (source Peak Oil: an Outlook on Crude Oil Depletion, Colin J.Campbell, February 2002) - click to enlarge
![]()
4. World Crude Oil & Lease Condensate Production Changes
Year on year production changes, represented by the green bars in Figures 7 and 8 below, show the biggest declines for Mexico, North Sea and Saudi Arabia and the biggest increases for Russia, Azerbaijan and Angola. Angola has many projects which should increase its production capacity but actual production rates may be limited to OPEC quota targets of about 2 mbd which are likely to be “assigned this year or early 2008” according to the OPEC Secretary General. Russia’s mature field production will probably limit Russia’s future production growth.
Month on month changes from Mar 2007 to Apr 2007 (Fig 7), represented by the light blue bars, indicate that the reduction of militant action in Nigeria helped increase its production. Over the same time period, Russia showed a small decrease in production, assumed to be caused by seasonal maintenance, while Iraq, USA, Australia, China and the North Sea showed small increases.
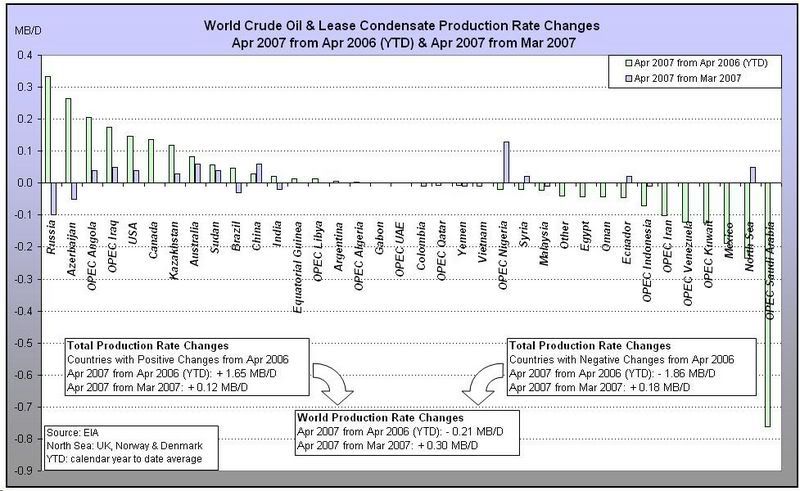
Fig 7 - World Crude Oil & Lease Condensate Production Changes to April 2007 - click to enlarge
Month on month changes from Apr 2007 to May 2007 (Fig 8) show an unfortunate fall in Nigeria’s production due presumably to increased militant action. Production also fell for Canada, Kazakhstan and the North Sea, assumed to be due to seasonal maintenance. The production drop for Mexico is due mainly to continued geological decline as PEMEX announced that “oil reserves may run out in seven years”. Also from Apr 2007 to May 2007, Canada decreased C&C production by almost 0.10 mbd, despite the optimism about oil sands. Russia showed a small increase in production of only 0.02 mbd. Could this mean that Russia’s C&C production is on a plateau? The large total drop of 0.51 mbd in world C&C production from Apr 2007 to May 2007 should reverse in the coming months as maintenance activities are completed. Hopefully some easing of militant attacks will allow Nigeria’s production to also increase.
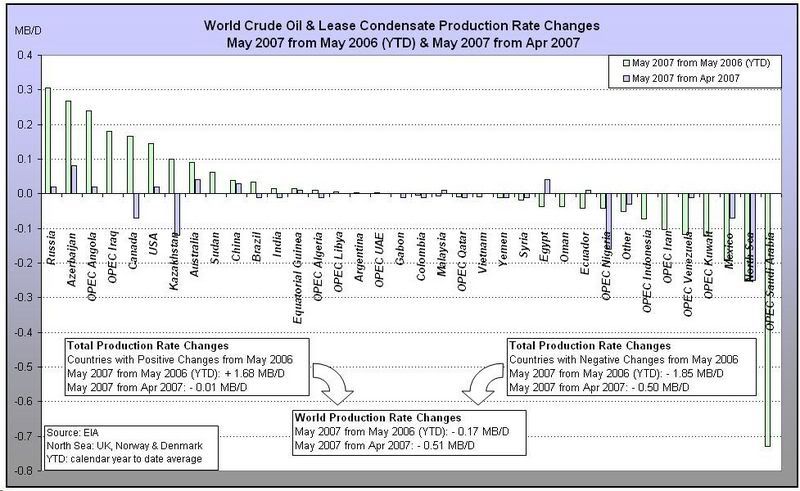
Fig 8 - World Crude Oil & Lease Condensate Production Changes to May 2007 - click to enlarge
World C&C production is dropping, on a year on year basis, by about 0.20 mbd (Figs 7 & 8). This is not a high decline rate but given that Russia is probably unable and unwilling to increase production and that Saudi Arabia, the North Sea and Mexico are unlikely to reverse their decline rates, the world C&C production rate will continue to decline (Fig 3).
![]()
5. Saudi Arabia Crude Oil & Lease Condensate Production
Saudi Arabia remains a key producer in the world and continually reminds the world of its enormous reserves and surplus production capacity. This paragraph on capacity in IEA's 12 June 2007 Oil Market Report, page 15, explains Saudi Arabia’s current surplus capacity situation within an OPEC context.
Notional spare capacity stands at 4.0 mb/d, while our measure of effective spare capacity (excluding Indonesia, Iraq, Nigeria and Venezuela) stands at 2.85 mb/d. Although these volumes are physically producible, even this lower figure likely overstates what OPEC could actually shift onto the market given current prices and shortages in refinery upgrading capacity. Heavy, sour Saudi Arabian and Kuwaiti crude accounts for 88% of the effective spare capacity figure. In the absence of substantial discounts, these volumes might struggle to find buyers while sizeable amounts of refinery upgrading capacity remain offline for scheduled and unscheduled maintenance. Readily marketable spare crude capacity may therefore be much lower, and a more accurate reflection of current market tightness.
In other words, this IEA paragraph says that the world has only 0.35 mb/d spare capacity of readily marketable light sweet crude because the spare capacities of 2.20 mb/d from Saudi Arabia and 0.30 mb/d from Kuwait are hard to sell heavy sour crudes. In August 2007, energy analyst Bill Herbert reaffirmed IEA’s views when he said that “even if OPEC decides to open the spigot a bit more, it’s hardly a guarantee prices would stay in check. Most of OPEC’s spare capacity is in heavy sour crude oil, which must be processed in types of refineries that already are running at full capacity. There’s very little ability on the part of the supply system to respond to more demand”. Furthermore, the EIA Short Term Energy Outlook, 7 August 2007 stated that “The low level of surplus OPEC oil production capacity, which is primarily in heavy crude oil, remains a key reason for the continued tight market conditions…Further, the apparent unwillingness by OPEC to use available surplus capacity in the face of rising crude oil prices reduces any downward price impact that additional surplus capacity might have.” Given these statements by the IEA, Herbert and the EIA, the following forecast assumes no effective spare capacity of easily marketable Saudi Arabia crude.
It is also assumed that Saudi Arabia will produce their fields while maintaining the annual depletion rate, which is annual production as a percentage of ultimate recoverable remaining reserves, at less than about 5.3%/yr. This should ensure that reservoir damage does not occur due to overproduction from their fields. The figure of 5.3%/yr was selected because the annual depletion rate of remaining reserves reached a peak of 5.3%/yr in the third quarter of 2006 (Fig 9), based upon estimated ultimate recoverable reserves (URR) of 175 Gb for Saudi Arabia. This figure of 5.3%/yr could be too optimistic. Tariq Shafiq, a petroleum engineer who was Vice President and Executive Director of the Iraq National Oil Company (INOC), said that a depletion rate of 4-5% is well within good reservoir management for large fields. In addition, Colin Campbell stated on page 7 of his ASPO Ireland Newsletter No. 80, August 2007 that “a Depletion Rate of 4.2%...sounds quite reasonable for a mature country like Kuwait, compared for example with 6.5% in the United Kingdom or 4.5% in the US-48”. If a lower forecast annual depletion rate is assumed then Saudi Arabia’s production rate would drop faster than is forecast (Fig 9).
The estimated URR of 175 Gb is equal to 155 Gb of non heavy crude plus 20 Gb of heavy crude. Although the heavy sour crude fields of Safaniya and Manifa may ultimately produce much more than 20 Gb, only 20 Gb is assigned because this low quality crude is difficult to market and difficult to process by refineries. The non heavy crude URR of 155 Gb includes 85 Gb for Ghawar (light), 15 Gb for Abqaiq (extra light), 8 Gb for Berri (extra light) and the remaining URR is assigned to Aramco’s other non heavy crude fields including Marjan, Qatif, Khurais, Zuluf, Shaybah, Abu Safah and Khursaniyah. The estimated URR is based mainly on the information sources about Saudi Arabia, located at the end of this article.
The possibility of a lower Saudi Arabia total URR exists. Based on this mathematical technique, this recent research “suggests that the Saudi Qt (or total URR) is only 150 Gb, which in turn suggests that Saudi Arabia is now over 70% depleted, with about 40 Gb in remaining recoverable reserves.” A 2006 research paper, using the same method, estimated a total URR of 160 Gb, as shown in this plot. Another source of oil reserves, prior to nationalization of Saudi Aramco in 1980, is a report titled “Critical Factors Affecting Saudi Arabia’s Oil Decisions”, published by the US General Accounting Office in 1978. As referenced on page 72 of Twilight in the Desert, this report stated that the remaining proven reserves as at the end of 1976 was 110 Gb with 70 Gb in the four super giants of Ghawar, Safaniya, Abqaiq and Berri. Cumulative production from these four giant fields was 26 Gb and cumulative production for all Saudi Arabia was 29 Gb. Thus, total proven reserves (produced and remaining) at the end of 1976 was equal to 139 Gb (29 Gb plus 110 Gb), of which 96 Gb (26 Gb plus 70 Gb) was attributable to the four super giants and 43 Gb (3 Gb plus 40 Gb) was attributable to the rest of the fields. This figure of 139 Gb does not include probable reserves, unlike total URR, and is less than the total URR estimates of 150 Gb and 160 Gb from the two research sources above. Allowing for the inclusion of probable reserves and only small discoveries since the last giant field Shaybah was found in 1968, an appreciation from 139 Gb to the total URR of 175 Gb appears reasonable.
As of June 2007, Aramco’s total cumulative C&C production is 112 Gb, being 64% of the URR 175 Gb. Over half of the 112 Gb has been produced from the super giant Ghawar. Abqaiq, Berri and Safaniya have also been significant producers. Aramco has produced over half of the estimated URR and the production curve is forecast to follow a typical post peak decline curve, shown by the red line in Fig 9. Unfortunately, the new production capacities from AFK, Shaybah expansion, Nuayyim and Khurais are not enough to offset decline from existing fields. Aramco has scheduled Manifa last because it will produce heavy oil which is less marketable than lighter grades.
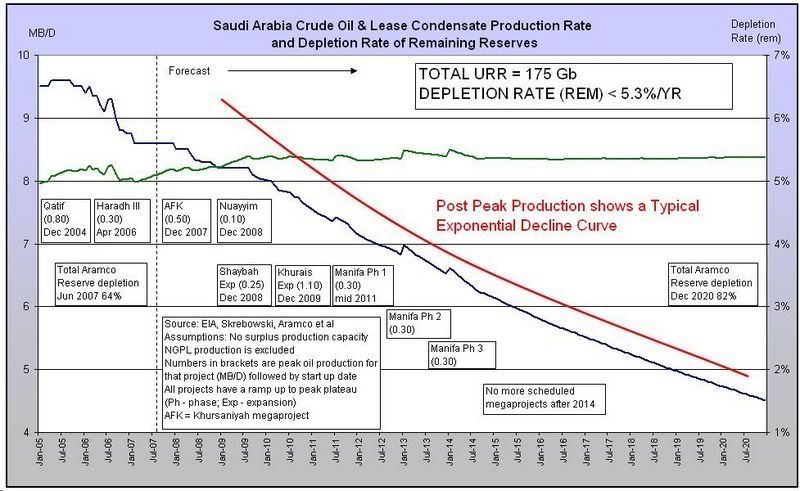
Fig 9 - Saudi Arabia Crude Oil & Lease Condensate Production to 2020 (bottom up forecast) - click to enlarge
Figs 9 and 10 have been updated for Aramco’s most recent project schedule, released in June 2007, which no longer includes originally scheduled expansion from both Al Khafji (Neutral Zone, 0.30 mbd, 2011) and Shaybah phase 2 expansion (0.25 mbd, 2010). Furthermore, Aramco’s recent project schedule showed Khurais start-up on June 2009, but now a recent press release dated 25 July 2007, on Saudi Aramco’s website states that Khurais is “scheduled for the end of 2009”, which is assumed to be December 2009 for Figs 9 and 10. Although Khurais is forecast to produce 1.1 mbd, Matt Simmons doubts that Khurais will produce 0.8 mbd. This report stated that the “Khurais field west of the giant Ghawar field could potentially increase Saudi production by a further 800,000 b/d” and another report made a similar statement “Another potential project, at the Khurais field, could increase Saudi production capacity by 800,000 bbl/d”. These statements indicate that the forecast production of 1.1 mbd from Khurais might be too high.
There are three forecast scenarios from 2007 to 2080, shown in Fig 10. The solid red line shows a “Do Nothing” forecast scenario. This represents a production decline rate of 8%/yr which is equivalent to ultimate recoverable reserves of 148 Gb (billion barrels). This scenario is highly unlikely but serves as a useful lower bound for the forecast production profile. The “New Peak?” dashed red line represents a scenario for which another peak is attained. However, the inset in the chart explains that another 1.75 mbd would be required from other projects and infill drilling. This is highly unlikely and predicts that a peak in 2005 has passed. The “Bottom Up” dark blue line in Fig 10 represents the most likely scenario and includes the bottom up forecast to 2020 from Fig 9, followed by an annual production decline rate of 5%/yr.
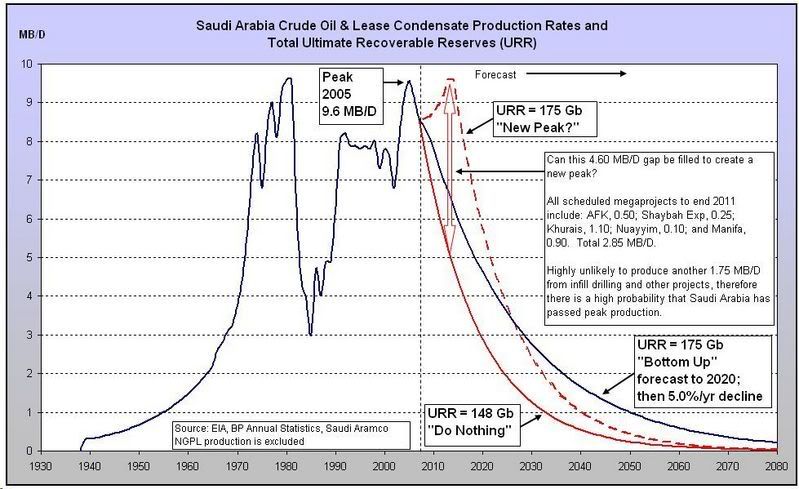
Fig 10 - Saudi Arabia Crude Oil & Lease Condensate Production to 2080 - click to enlarge
Saudi Arabia has never directly admitted that it has passed peak C&C production, but in August 2004 a former OPEC president, Purnomo Yusgiantoro, admitted that “oil prices were at crazy levels, but that OPEC was powerless to cool the market…There is no more supply”. Thus, based on Yusgiantoro’s statement, in August 2004, Saudi Arabia’s C&C production was at maximum capacity of 9.5 mbd, up by a significant 1.1 mbd from April 2004 (EIA). Furthermore, on 11 April 2006, according to this source and requoted here, Platts quoted a Saudi Aramco spokesman saying that “Saudi Aramco’s mature crude oil fields are expected to decline at a gross average rate of 8%/yr without additional maintenance and drilling” and that “This maintain potential drilling in mature fields combined with a multitude of remedial actions and the development of new fields, with long plateau lives, lowers the composite decline rate of producing fields to around 2%.” Therefore, as of April 2006, Aramco’s crude oil production was forecast by this Aramco spokesman to decline at 2%/yr which means that Saudi Arabia has passed peak crude oil production.
These three sources provide additional information about Saudi Arabia’s production decline rates. Aramco Senior Vice President Abdullah Saif admitted that “One challenge for the Saudis in achieving this objective is that their existing fields sustain 5 percent-12 percent annual "decline rates," (as reported in Petroleum Intelligence Weekly and the International Oil Daily) meaning that the country needs around 500,000-1 million bbl/d in new capacity each year just to compensate”. The Schlumberger CEO said that “the industry is dealing with a phenomenon that is exaggerated by the lack of investment over the past 18 years. This phenomenon is the decline rate for the older reservoirs that form the backbone of the world’s oil production, both in and out of OPEC. An accurate average decline rate is hard to estimate, but an overall figure of 8% is not an unreasonable assumption.” The EIA also stated that a “challenge for the Saudis in achieving their strategic vision to add production capacity is that their existing fields sustain, on average, 6 to 8 percent annual "decline rates” (as reported by Platts Oilgram) in existing fields, meaning that the country needs around 700,000 bbl/d in additional capacity each year just to compensate for natural decline.”
Saudi Arabia C&C production was 9.5 mbd in August 2004. According to the previous EIA statement, Saudi Arabia needs 0.7 mbd additional capacity each year just to compensate for natural decline. Therefore, three years later, by August 2007, additional capacity of 2.1 mbd (3*0.7 mbd) would have been required just to compensate for natural decline. Since August 2004 there was a total capacity addition of only 1.1 mbd from these two projects as stated by Saudi Aramco’s Press Kit on their website. In late 2004, Qatif (including Abu Safah) began operations with production capacity of 0.8 mbd and in early 2006, 0.3 mbd capacity from Haradh III, 0.3 mbd (Fig 9), which leaves a shortfall of 1.0 mbd. This implies that Saudi production in August 2007 is 8.5 mbd, 1.0 mbd less than the 9.5 mbd production in August 2004, excluding capacity additions from infill drilling. Accordingly, this number of 8.5 mbd is slightly less than the number of 8.6 mbd for July 2007, from the EIA Short Term Energy Outlook, Table 3a, 7 August 2007. Based on the quotes and statements in this and the previous two paragraphs, it is highly unlikely that capacity additions from new projects, including infill drilling, are sufficient to compensate for existing production decline, and consequently the “Bottom Up” scenario in Fig 10 remains the most likely scenario.
![]()
6. Other Components of Total Liquids Production
Natural gas plant liquids show an increase in production due to OPEC projects from Saudi Arabia, Algeria, Iran and Qatar. Saudi Aramco’s most recent project schedule, released in June 2007, shows two significant NGPL projects to be completed within a year: Hawiyah at 318,000 barrels/day and Khursaniyah at 290,000 barrels/day.
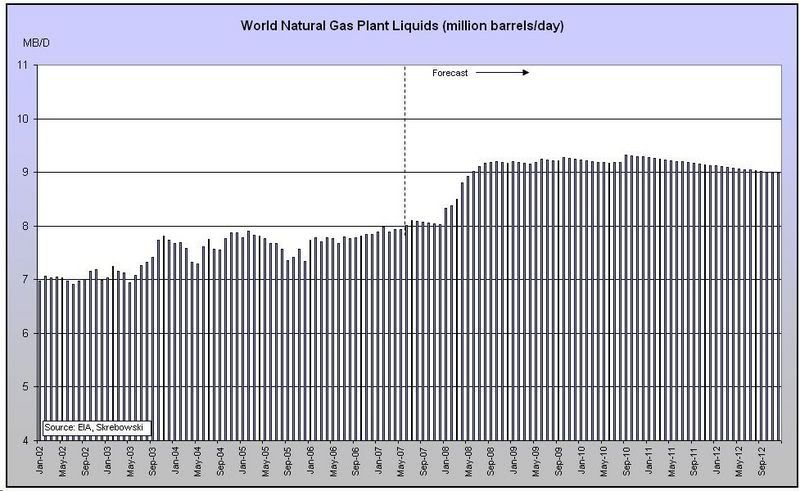
Fig 11 - World Natural Gas Plant Liquids Production to 2012 (bottom up forecast) - click to enlarge
Ethanol and XTL (BTL, CTL and GTL) production is forecast to double to 2012. Unfortunately, the increased production of government subsidised corn based ethanol in the USA is increasing the prices of many other food products.
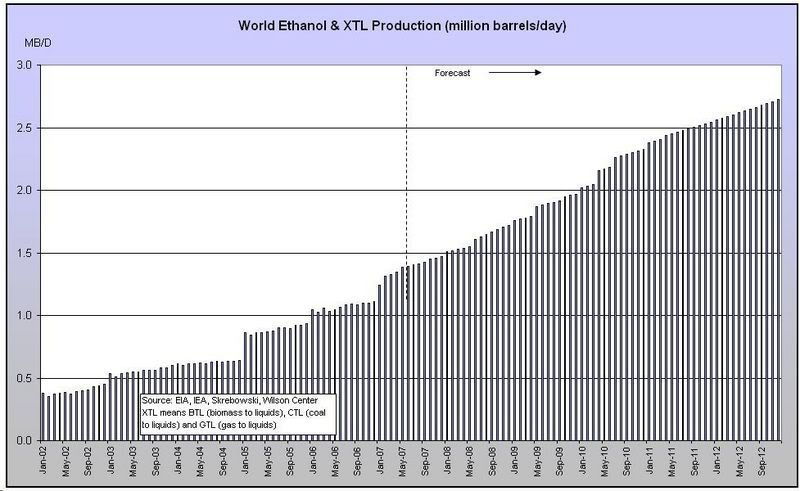
Fig 12 - World Ethanol & XTL Production to 2012 (bottom up forecast) - click to enlarge
Processing gains are defined by the EIA as “The volumetric amount by which total output is greater than input for a given period of time. This difference is due to the processing of crude oil into products which, in total, have a lower specific gravity than the crude oil processed.” These gains are forecast to decline slowly based on the decline in C&C (Fig 3).
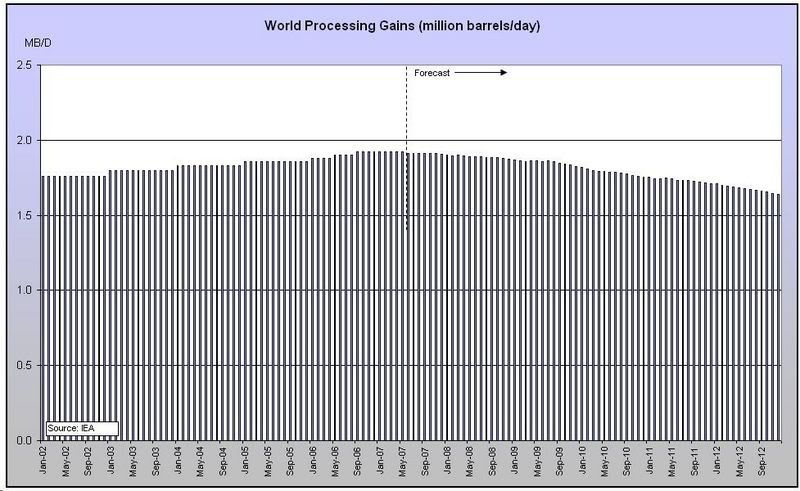
Fig 13 - World Processing Gains to 2012 (bottom up forecast) - click to enlarge
![]()
7. Additional Information Sources
For more forecasts please refer to this article by Khebab, Peak Oil Update - June 2007: Production Forecasts and EIA Oil Production Numbers and to Peak Oil Media Redux by Prof Goose, including this lecture by Dr. Albert Bartlett.
![]()
Further articles about Saudi Arabia:
by Stuart Staniford
- Saudi Arabia and Gas Prices
- Depletion Levels in Ghawar
- The Status of North Ghawar
- Further Saudi Arabia Discussions
- Water in the Gas Tank
- A Nosedive Toward the Desert
- Saudi Arabian oil declines 8% in 2006
by Euan Mearns
- Ghawar reserves update and revisions (1)
- GHAWAR: an estimate of remaining oil reserves and production decline (Part 2 - results)
- GHAWAR: an estimate of remaining oil reserves and production decline (Part 1 - background and methodology)
- Saudi production laid bare
- Saudi Arabia and that $1000 bet
by Heading Out
- Simple mathematics - The Saudi reserves, GOSPs and water injection
- Of Oil Supply trains and a thought on Ain Dar
by Ace
Contact
- Content: editors at theoildrum dot com
- Tech support: support at theoildrum dot com
License

This work is licensed under a Creative Commons Attribution-Share Alike 3.0 United States License.
Ace: Great summary of the situation. Thanks.
Hi all,
Can someone explain to me why, if (as everyone seems to be stating) we reached peak production in 2005 and demand from 2005 to the present has seen a steady increase, are we not already seeing a massive spike in oil price?
Why are US oil stocks still at record high levels given the above?
I firmly believe in Peak Oil and have invested with that thesis, but it seems hard to believe that the world peaked in 2005. Demand has not been flat since then, so we should be seeing much higher priced oil and shortages if that was the case...
--Kevin
Third World countries are tumbling into the Olduvai Gorge as oil prices rise, thus freeing up product for industrialized nations that can pay the freight. As the price increases more countries will tumble in behind. We need a good status report of those countries that have made the transition. Should be a little like watch the movie classic, "Titanic", while being on the Titanic.
The evidence for third world countries tumbling into Olduvai Gorge is frankly not great. Take Africa - recent growth rates have been among the best in 10 years, and only a handful of countries (one of which is Zimbabwe, which has its own non peak nightmare) have had growth rates below 1%. I would dig up the reference for this (its a World Bank/OECD study as far as I recall) but there again, its not information that many folk here wanted to take at face value last time it was alluded to.
From Piggly Wiggly
I stand by my Titanic analogy. We are down by the bow just one degree. Here's a SITREP of the lower decks now. When the ship pitches to four degrees it will get everyone's attention.
Peak Oil Hits the Third World
High Oil Prices Bring Energy Shortages
2007-08-10
By Chris Nelder
Sometimes it takes a strong stomach to weather the ups and downs of the market, and this last two weeks was one of those times.
Crude oil reached a new all-time high of $78.77, then promptly fell 8%, taking most of the energy complex down with it.
Does this mean peak oil fears are overblown? Does it mean we're headed back to $60 oil?
Not likely.
What we saw in the last week has more to do with the sub-prime mortgage meltdown than anything else. It put the fear of freefall into fund traders, causing them to sell perfectly good stocks indiscriminately--especially perfectly good energy stocks, where they were sitting on some nice gains--in order to raise cash. It also gave a sell signal to oil futures traders, who had built up a record level of long positions.
In other words, it was the blowing off of some speculative froth, and little more.
The true bottom line on energy is quite another matter.
Douglas Low, the director of the Oil Depletion Analysis Centre in Britain, recently warned of a "crisis coming up" with real shortages of oil, noting that the world used 1.5 mbpd more crude than it produced in June. "It's not a very happy message," he says. "A lot of people want to slip it under the carpet."
Indeed. Like all the cheap oil cheerleaders who used this occasion to predict that oil was going back to $40 or (snort) $20.
I would like to refer those Pollyannas to a little-noticed opinion essay published two days ago by the CEO of Royal Dutch Shell, one of the world's largest oil companies. Jeroen van der Veer laid out his "Three Hard Truths About the World's Energy Crisis":
The first hard truth is that demand is accelerating.
The second hard truth is that the growth rate of supplies of "easy oil," conventional oil and natural gas that are relatively easy to extract, will struggle to keep up with demand.
The third hard truth is that increased use of coal will cause higher carbon dioxide emissions possibly to levels we deem unacceptable.
I'm not sure what motivated Mr. van der Veer to make such a bold statement. Since his prime directive is to maximize shareholder value, he must feel that it's time to take a defensive position and get out in front of the peak oil story, now that the recent reports from the IEA and the National Petroleum Council have confirmed the basic message that supply is struggling to keep up with demand.
Indeed, given this year's worldwide tapering off of exports, and worse news for our imports, some of those chickens seem to be nestled into the roost already. Mexico, the world's number-five producer, and our number-four source of imported crude (accounting for 11% of our imports), admitted two weeks ago that its oil reserves will be done, kaput, in just seven years.
I've been watching and waiting for these signs for about five years now: Not just high prices and declining exports, but the slowing of commerce, interstate trucking and air travel, food shortages and similar indications.
But the actual feeling of peak oil didn't really hit me until this week, as I perused a page on Jim Kingsdale's excellent Energy Investment Strategies site, listing countries that are currently experiencing serious fuel shortages and grid blackouts.
Here in the first world, we still have the luxury of armchair theorizing about peak oil, and paying a bit more for gasoline, but the third world is actually feeling the pain of peak oil today. Rising oil prices are acting as a regressive worldwide tax, pricing poorer countries right out of the market.
Since their experience must to some extent herald ours as peak sets in, let's see how peak oil feels to those who are undergoing it firsthand.
Asia and Middle East
Nepal: Gasoline and diesel shortages are crippling the country. In July, the Kathmandu valley was hit with its worst energy crisis in history as the state-owned petroleum importer and distributor stopped supplies to gas stations entirely. Fuming taxi drivers subsequently parked their cars before the heart of the Nepalese government center to protest the shortfall. The Nepal Oil Company (NOC) has been facing cuts from its sole supplier, the Indian Oil Corporation (IOC), because of mounting debts owing to Nepal's subsidies, which force NOC to sell fuel below cost.
Pakistan: Chronic power shortages have led to riots in the streets in Karachi. At one point this summer, the gap between supply and demand reached a peak of 3,000 megawatts (MW). Due to chronic underinvestment in energy infrastructure, the country's Planning Commission estimates that its shortfall in oil supply will grow to 3.2 million tons of oil equivalent (TOE) in 2010, and 21.5 TOE in 2020.
Iraq: Iraq has suffered from an acute shortage of oil products since the U.S.-led invasion in 2003. This week brought a report that Iraq's electricity grid could collapse any day now, due to sabotage, rising demand, fuel shortages, and provincial officials who are disconnecting their local power stations from the national grid (presumably in the interest of self-preservation). Constant attacks on pipelines have made it impossible for Iraq to meet its internal need for gasoline, forcing it to rely on imports to the tune of 1.3 million gallons per day. At the same time, it is being forced to reduce subsidies on gasoline in order to meet IMF debt-reduction requirements, even as it struggles with 60% unemployment and rampant poverty as well as chronic grid blackouts. Oil smuggling and a robust black market have sprung up to take advantage of an estimated 10x spread between the official subsidized prices and black market rates.
Iran: Chronic gasoline shortages have forced the government to impose rationing. Motorists can buy only 100 liters a month at the subsidized price of 1,000 riyals (about 11 cents) a liter (the cheapest gasoline in the world). Iran's program of oil subsidies--combined with sanctions from the West over its nuclear intentions--has proved disastrous, putting the government in an intense budgetary squeeze. Angry protesters torched 19 gas stations in response to the rationing in late June. Tehran currently imports about half of its gasoline, and absorbs a loss of nearly $2 per gallon on it, creating an intense drain on the national coffers. As in Iraq, rationing is expected to lead to a brisk black market.
Bangladesh: The shortage of electricity is acute, to the tune of about 2,000 MW a day, which is resulting in regular blackouts. Bangladesh's attempts to import electricity from India, Nepal and Bhutan have been fruitless, so in June the country obtained permission from the International Atomic Energy Agency (IAEA) to begin building nuclear power plants.
Sri Lanka: Severe shortages of fuel have led the UN to warn the government that it may not be able to continue providing humanitarian aid or preserve its supply of vaccines and essential medicines. The UN agencies have been forced to curtail the usage of generators and vehicles. Construction activity in the Jaffna and Wanni regions has all but ceased due to the lack of fuel.
Philippines: A deadly tropical storm hit the country this week, bringing an end to a three-month drought that had severely reduced the country's electricity output. Extremely low water levels were recorded at five major hydroelectric power dams, one of which was forced to shut down entirely. The shortage caused sporadic electricity outages in the country's capital of Manila, which turned to coal and oil-fired power plants to make up the difference.
China: A red-hot economy with rapidly growing industrial sectors has put China in a constant state of electricity shortages, with brownouts a common occurrence. Shortages of coal, power and oil have been reported. Top refiner Sinopec has stopped selling refined products to other companies and private filling stations in order to maintain supply to its own outlets, and some oil dealers are suspected of hoarding supplies. Now the world's second largest energy consumer (behind the U.S.), China's total energy consumption has risen by an average of more than 11% each year for the last five years, 70% to 80% of which is supplied by coal. Meanwhile, all of that coal is casting a shadow of soot around the world, dropping it in places like the west coast of the U.S., and causing acid rain that poisons lakes, rivers, forests and crops. It has been estimated that fully 77% of the black carbon emitted into North America's lower atmosphere comes from Asia.
India: Soaring temperatures as high as 122° F have caused hundreds of deaths and raised grid demand to a record 4,000 MW in the capital of New Delhi, where rolling blackouts and equipment failures have caused power outages lasting up to 15 hours a day. Chronic power shortages in urban and rural India are crippling industrial and agricultural productivity and discouraging foreign investment. The country is currently looking to nuclear energy to provide some relief.
Vietnam: Another red-hot Asian economy with electricity consumption growing at the rate of 15% to 20% annually, Vietnam is facing a 1,000 megawatt shortfall in peak power production. The capitol has ordered local governments to keep the thermostats set no lower than 77° F and to turn off air conditioners a half-hour before the end of the day--with a $1,250 fine for non-compliance.
Africa
Some 25 of the 44 sub-Saharan nations are facing "unprecedented" and crippling electricity shortages with common power outages, even in South Africa. In Nigeria, Kenya, Tanzania, Uganda, Ghana and other parts of West Africa, drought has slashed the generating capacity of hydroelectric dams, which is in turn crippling production of gold, aluminum, and other basic metals.
Uganda: Electricity shortages are frequent as the grid is strained beyond capacity, largely because drought has lowered the water level of the Nile River, reducing hydroelectric generation. Parts of the capital are blacked out for as much as a day at a time. The country has leased two 50-megawatt diesel-burning generators to compensate, reportedly costing the nation about as much as it would have cost to build two new hydroelectric dams. And in a horribly ironic twist, grid power shortages are shutting down a pipeline from Kenya, adding to the diesel shortages.
Zimbabwe: Critical gasoline and diesel shortages are ruining the economy, pushing the price of a liter of petrol to a staggering 120,000 Zimbabwe dollars. Fuel stations went completely dry in June, and there have been long queues at the few which had any to sell.
Ghana: Electricity shortages are causing load shedding blackouts, costing the economy on the order of US $5 million a day. Ghana, among others, has compensated by leasing huge gas generators to produce emergency power--at exorbitant rates.
Nigeria: An acute shortage of fuel occurred in June due to strikes by unionized oil labor over wages, a hike in fuel prices, and the sale of two refineries. Nigeria Labour Congress (NLC) has vowed to cripple the government of Oyo State if it makes good on its threat to eliminate some of the state work force. Abductions, killings and robberies have plunged the oil-producing parts of the country into chaos. Only 19 of 79 power plants even work, and blackouts are costing the economy $1 billion a year. In Nigeria, Angola and other nations, most businesses and many residents run private generators because the grid is so unreliable, adding to their economic and air pollution woes. Imagine: "I've been on the 20th floor of an apartment building in Luanda, and there would be generators on all the verandas, with the racket, the fumes."
Senegal: State power company Senelec has been unable to pay for supplies of fuel for its oil-fired power stations, leading to cuts in electricity supply. China has come to its rescue with a 370 million yuan loan to fund a new distribution network, in addition to its commitment to build a 250 megawatt coal-fired power station there.
Kenya: Gasoline and diesel shortages in Nairobi are grounding industrial and personal transport alike, and price hikes appear likely.
Gambia: Shortages of gasoline and diesel are taking an economic toll across the country, with many empty petrol stations and long lines at stations that have fuel to sell--but only to customers holding coupons from Shell.
Americas
Argentina: The country is facing its worst energy shortage in nearly 20 years. An increase in heating demand caused by an unseasonably early cold snap, combined with the failure of a power plant, caused the collapse of both the power grid and the fuel supply system. Electricity supplies have been severely curtailed, plunging entire districts into darkness and causing the layoff of industrial workers. Shortages of compressed natural gas, which powers many Argentine cars and 90% of the capital's taxis, are common. Argentina now has less than ten years' worth of gas reserves, and can no longer meet peak electricity demand.
Nicaragua: Electricity shortages have led to widespread blackouts, prompting the recently re-elected president Daniel Ortega to promise an end to the "energy bankruptcy" that has afflicted the country. The nation's energy deficit is running between 20% and 30%, forcing the power-distribution company Unión Fenosa to shut down whole cities for six to ten hours at a time. Ortega announced that nations such as Iran would help to build new energy plants to address the issue.
Chile: Reduced supplies of natural gas and lower-than-average rainfall have pushed electricity spot prices to record highs, prompting concerns of inflation and reduced valuations of the country's energy companies. The market took Chile's third-biggest power generator, Colbun SA (COLBUN CC), to the woodshed in early July.
Costa Rica: Beginning in April, Costa Rica began experiencing nationwide electricity blackouts, forcing emergency rationing. The country's hydroelectric capacity is strained to the max, due to a dry summer cutting power output by 25%, damaged turbines at oil-burning thermal plants, and Panama's decision to stop exporting electricity to Costa Rica. Blackouts are now routinely scheduled.
Dominican Republic: Electricity blackouts have become commonplace, apparently due to a lack of fuel and regular maintenance of power plants. Programmed blackouts have now spread from the barrio neighborhoods to the exclusive residential districts.
The picture is clear: the poor and undeveloped countries of the world are the first to fall before the remorseless price inflation brought by peak oil.
Claude Mandil, the head of the International Energy Agency, warned recently of a "catastrophe" for the world's poorest countries as they are forced into the suicidal practice of subsidizing oil just to keep their economies running.
Since we know that there is little point in trying to radically increase anyone's supply of oil, gas or coal at this point, there are only two paths left to choose: powering down or going renewable.
You know what our preference is. Who can turn his back on industries that are growing at the rate of 25%+ a year? While aging oil companies struggle to suck "the last days of ancient sunlight" from the ground, warily eyeing their incipient declines, there are young, agile companies eyeing the abundant and untapped solar, wind, geothermal and wave potential in most of the above countries--with the eager support of the World Bank and the IMF.
Oh, and us profit-seekers over here at Green Chip Stocks.
Until next time,
--Chris
Hi Kevin,
This is not a movie script; the peak may not be dramatic. Crude oil set price records in 2006 (Nymex $77.03, July 14) and 2007(Nymex $78.21, July 31), and production (C+C) has dropped each year. That is certainly the kind of price signal I would expect after a peak. We shall see whether it is THE peak.
It does seem that US stocks often do well when US real estate is doing badly. It suggests that people who were buying real estate in previous years have been buying stocks this year.
If you were to ask the Chimp, he would tell you that a 4% reduction in oil supplies caused a quadrupling of the cost of oil in the 70s, yet a 2% reduction since 2005 has only caused prices to increase by 33%. Its an interesting conundrum isnt it?
Hi maitri982,
What do you mean by "[I firmly believe in Peak Oil and] have invested with that thesis"?
I had the same idea and explained it at this address:
http://www.energybulletin.net/30562.html
Regards, Emmanuel
Ace, thanks for another excellent exposition. Very useful this time that you've put the most important new points of this update as compared to the last one, in bold so that monthly addicts can see what's new!
Can anyone comment on the reason for the size of the drop in production from Norway? Is it just depletion, voluntary restraint, or maintenence?
Depletion + Maintenance. Norway is about 70% depleted, based on the Hubbert Linearization (HL) method.
Nice work, Ace!
Much appreciated.
Ace, superlative work, as usual.
Yesterday, I added up the consumption increase from the top 10 net exporters--inclusive of what I suspect is a temporary drop in Mexican consumption--and I was surprised at the magnitude of the 2005 to 2006 increase (EIA, total liquids): about 500,000 bpd in one year, from 10.7 to 11.2 mbpd.
Note that this is equivalent to a 1.1% drop in production by the top 10, insofar as net exports are concerned.
It took virtually all of Azerbaijan's net exports in 2006, just to meet the one year increase in consumption by the top 10 net exporters.
Thanks Ace!
I always look forward to your updates for some focus.
So, if we assume that Ace's excellent work is a reasonably accurate prediction of medium term oil supply, can we modify the global demand prediction to reflect the likely fallout of the current liquidity problems in the financial market?
Some pointers:
The futures price has fallen about $8 / barrel, I guess largely as a result of speculative money being withdrawn to provide liquidity elsewhere.
The year on year rise in US Gas consumption is slowing, perhaps because of $3 /gallon price, perhaps because of general economic slowdown (collapse of the house building trade, etc.)
A lot of pent up demand is in India / China, as the newly rich buy cars by the tens of millions. Having bought them, they will want to drive them, and I don't see an economic recession getting in their way.
OECD crude stocks remain fairly healthy, due to the economies being strong enough to absorb the higher prices (until now). However, we have little data on 3rd world stocks, and given the widespread reports of shortages of various oil products, it again looks likely that there is pent up demand for crude at a more moderate price.
In the medium term, I think a lower/unstable crude price combined with the unstable money supply, will drastically curtail new oil/tarsand/biofuel developments on a 3-7 year timescale. This will ensure that when production starts going over the cliff, it will be steep
To summarise, in the next few months, I expect oil to fall slightly, OPEC to do nothing in September, leading to oil rising sharply in the autumn, until the next wave of panic hits the financial markets, which will be some time in the next nine months.
After that, I have no idea.
IMO, it continues to look like the stuff will hit the fan this fall:
(OECD Days of Supply, Actual & Forecast)
http://www.eia.doe.gov/emeu/steo/pub/gifs/Slide25.gif
wt - you made this same comment over in the drumbeat. I'm looking at this chart and wondering what you see in it that says shtf. I'm not saying it's not there - just wondering what you see that I'm not getting.
Days of Supply inventories (inclusive of US inventories) are down toward the bottom of the five year range, after showing a steady decline from the high levels last year. In other words, OECD demand is being met by drawing down inventories. Note that OECD statistics only cover 56% or so of world consumption (if memory serves).
At the same time, world net exports are declining. For example, because of rising consumption, currently flat production from Saudi Arabia = declining net exports.
So, net exports are declining, while inventories are being drawn down to meet demand. This is why the IEA has started sounding increasingly urgent calls for more OPEC production.
Unfortunately, the Export Land Model suggests that net export declines tend to accelerate with time.
Excerpt from the OPEC/IEA article that Leanan posted:
Thanks, that helps. I suppose the real question then becomes how prescient the chart is in the suggestion that stocks will remain within the moving 5 year range. While moving from the upper limits to the bottoms limits in such a short time is of concern, it also appears that we've gotten close to those lower limits during the last two fall periods as well. I'm wondering why the chart creator is not foreseeing a rebuild of stocks in the winter 2008 time frame like we had in 2006 and 2007? This would seem to me to make the fall 2008 the real "iffy" time frame.
Re: EIA Projections
I think that they are actually predicting a recovery in OPEC exports. Without such an increase, presumably OECD inventories will be even lower than predicted. However, that is where the price comes in, which actually raises an interesting question.
What if the price is high enough to maintain OECD inventories within the five year range, even as exports decline? Couldn't Saudi Arabia then always say that "Inventories are sufficient and there is no need to increase production?"
http://www.eia.doe.gov/emeu/steo/pub/contents.html
Short Term Energy Outlook Excerpt:
Glad to see you found my analysis useful in your discussions, WT :)
I would like to point out to everyone that over the course of that graph, daily consumption of oil has been increasing throughout the OECD. It should be pointed out that total stocks ARE at historical highs: its demand that gives WT that lovely projection of future OECD days of supply. And we all know that demand can, and will be, changed as the cost of oil increases...
As noted up the thread, prices high enough to keep OECD inventories within the five year range would allow Saudi Arabia to say that "Inventories are ample."
So, perhaps the more meaningful metric is the decline in crude oil production since May, 2005, verses the significant increase in oil prices since May, 2005.
Not quite, as I pointed out to you the last time you claimed this. OECD stocks for N America are near the top range for the 5 year average. OECD stocks for the rest of the world are not. And that's just OECD, we have no data for non-OECD stocks but I'd be flabbergasted if they were high.
Rethin, do I really need to rehash this with you again? Do you really want me to embarrass you again by showing everyone how you have confused the concept of 'number of days stock' with 'total stocks'? I will leave it at that...
You're a funny guy.
Here are the actual numbers
http://omrpublic.iea.org/omrarchive/12june07stk.pdf
On page five you can see days of use as well as total stocks for OECD regions of NA, Europe and Pacific.
Eruope is well supplied by both measures.
NA is not when measured by days of demand. NA total stocks are near the top of the five year average but no where near all time highs.
The pacific region is low when measured both by total stocks and days of demand.
Total OECD are no where near the top of the five year average by days of supply. They are at the top of the five year average by total stocks for this time of the year but are no where near the all time high.
And I believe that's exactly where we left it last time.
/facepalm
For the benefit of others, I pointed out that:
1. 56% of global oil use is consumed in the OECD
2. The Asian Phoenix Economies only consume about 1/12th of all global supplies
3. Russia, China and Brazil as a whole consume 15% of the worlds oil.
4. The remainder is produced by OPEC, who by their very nature have limited stocks because they EXPORT OIL.
Rethin is trying to fool you into believing that the stocks in Russia, Brazil and OPEC matter, when in fact they do not. He is also trying to confuse the issue by stating that stocks are at the lower end of days supply, when in fact they are actually in the middle range, AND they are above historical ranges in terms of barrels of oil.
WT's graph is meerly a PROJECTION. They literally copied the oil data from 2003-2006 and pasted it onto 2006-2009. The graph has been unchanged for almost 6 months now (it conveniently showed us future stock levels as a fact well in advance.) Honestly Rethin, what gives?
I'm talking only about OECD, and stocks are not near "Historic Highs".
Here's a country by country breakdown of Total stocks vs 5 year averages, not days of demand
http://omrpublic.iea.org/stocks/ct_cr_xs.pdf
You can see most 11 of 21 of the OECD countries total stocks are below the 5 year average.
/facepalm
Yes, lets state numbers like '11 out of 21' are below the 5 year average and call ourselves Charlene! What you of course FAILED to inform everyone here is that 9 out of 11 of those countries have NORMAL stocks of 10 million barrels OR LESS: and that they are down by only a few 100k barrels. The only MAJOR countries that have lower than normal stocks are Turkey and France, and thats by a paltry 3 million barrels or so each.
The other countries, which make up 2/3rds of total stocks for the OECD are either at, or ABOVE their historical highs! Congratulations on making yourself look foolish....again.
So in other words most of the OECD countries are around their 5 year average.
A couple are at the high end of their 5 year average for this time of the year.
None of this jives with your claim that OECD stocks are at historic highs.
Repeat after me, just because the US oil stocks are at the high end of the 5 year average (not historic highs) does not mean that ALL OECD stocks are at Historic Highs. In fact most of them are at or below their 5 year averages.
Bu arguing with you is like arguing with a two year old. I give up.
Again you fail to grasp the entire picture. On the whole, OECD stocks, that is to say the sum of all OECD countries oil stocks, are at their highest historical level. Your making mountains out of ant hills by trying to cloud the issue with 'Swedan is down 100k barrels from their 1 million barrel average stock' rants.
Your whole "historic highs" thing isn't nearly as important as you think. Every year that world crude consumption does up (as it does most years) countries need more stock. So most years crude stocks reach a "historic high."
But what we are seeing now is just 2 or 3 OECD countries are near the top of their 5 year range for this time of the year.
At the same time the rest of the OECD is petering along near their 5 year average, no where near "historic highs" or even at the top of their 5 year band for this time of the year.
This is significant and this is the "entire picture" you are failing to grasp. Even OECD countries are struggling to keep their stocks at the 5 year average (despite demand increasing in the past five years).
WT,
That graph from EIA shows a repeating pattern, eerily one might say. Look at the red line starting from January 2003 through January 2006. This is very similar to the tracing from January 2006 through January 2009. Any thoughts as to why?
Lonnie
Yes, it is uncanny, and no it doesn't show a peak followed by a decline. If we were to go back further, would we find a similar pattern for a decade or more?
I think any predictions of the future need to wait till after hurricane season is over. Considering how tight oil supplies are what happens next is totally dependent on how we get through it. Other then that your probably right. But from now on out on bad Hurricane will have major repercussions.
Dean for example will have some effect if only a few days lost production. So until Hurricane season is safely over its the short term controlling factor. The other factor is the status of our monetary system cuts from OPEC in Sept. are not beyond the realm of possibility they have said no increases but the have not said no cuts. And of course how the economy itself actually functions over the next few months.
Like I said I agree but for now the above issues overwhelm any other ones. This means to me we can't make clear predictions until we get into say November at that point a lot of factors will be settling down. The economy should be slowing and we can see how OPEC handles dropping demand.
The big generic unknown factor is how oil demand will change as the world economy slows down this will begin to be answered in November barring a Hurricane etc. Once we start getting good numbers and OPEC's response then its reasonable to extrapolate. I'm of course betting OPEC and esp KSA uses the slowing economy as and excuse to make major production cuts helping them maintain a capacity cushion if they are in decline. But its a coin toss till later in the year. Or till after we have a bad hurricane. And additional 1mbpd +/- in global production over the next year makes a huge difference. Assuming that a 5% difference between supply and potential demand for exports initiates a exponential bidding war we are right on the cusp. The only way out is if demand starts dropping say 1% without major price changes.
Has anyone contemplated the global political repercussions associated with this? Given what I see happening around the world in terms of military "enhancements" by most major nations (India, China, Russia, Venezuela, Iran, US, Canada, etc. ) it would seem that the political leaders are quite aware of PO and are gearing up accordingly. The recent actions by the countries I've mentioned don't seem to have any relationship to any other issue, and in fact some have come out and stated that the purpose of those preparations/actions "is to ensure access to energy supplies " .
Technical issues aside, this seems to be the reality that is staring us in the face.
Or do we just not want to think about that?
no offense, but I had to chuckle when I read that.
this video is more than a year old now, but it's still a good one...
http://www.eenews.net/tv/video_guide/354
An excellent history lesson. I wish my school teachers had been as lucid.
That's what I find so extraordinary about TOD and the internet links you guys post ... I learn so much ... so quickly.
Thanks.
Xeroid.
None taken, and I appreciate the link. Just finished watching it. I only have one comment about his talk other than that it was an excellent summary of the history up till last year. My comment stems from his apparent view that alternative energy will relieve us of the "oil addiction". To me, this sounds much like offering a heroin addict marijuana as a substitute, and by the way it's going to cost you a lot more. It's just not going to be a satisfactory solution to the addict.
So it does sound like at least some people are contemplating my original question. But that's about as far as it goes, it seems. I was born in '44, so it's starting to look like the "duck and cover" drills I endured in grade school may yet have some value in the not too distant future. Too bad, really. I was just starting to like this planet.
http://science.reddit.com/info/2hm1u/comments
http://digg.com/business_finance/World_Oil_Forecasts_Including_Saudi_Ara...
http://slashdot.org/firehose.pl
if you are so inclined...
I can not understand how you came up with the forecast in Figure 1. OPEC has cut output by about 1.5 million b/d since last fall. They likely will not raise it in September, but that could change later. You don't want to acknowledge that possibility. Saudi Arabia and Kuwait were selling that heavy, sour crude to Asia before and now they can't sell it? We are still waiting for the non-OPEC numbers for 2007 and Skrebowski's schedule shows that 2008 & 2009 look like big years for new supply additions. We'll have to wait and see what the net is in both years, given a global net decline rate of 4%.
I did the forecast for Russia at ASPO-USA but I see you did not include it. They will reach at most 10.6 million b/d but will probably fall short of that goal. We might expect an additional 0.4-0.5 million b/d from them by 2011.
You've got the total liquids supply at about 77 million b/d at the end of 2012. This is completely implausible, it is far too low. That shows the world falling off a cliff in the medium term. Such a forecast is reckless and unjustified.
Your prediction assumes the peak is now — this is not known with certainty but each month that passes makes the point that we are dependent on what OPEC can or can not do. However, forecasts that use all the worst case assumptions going forward have little merit in my opinion, and demonstrate a systematic bias which does no one, including the peak oil community, any good.
It does not make me happy to express this opinion, which is my own, not that of ASPO-USA.
Dave: When would one logically assume the peak in oil production occurred (or will occur?). Prices are high by historical standards and the promised oil is not being supplied. Most people aren't interested in this subject-if they were, most reasonably intelligent persons digesting the data would assume that the May 2005 peak will not be surpassed. That doesn't make it a certainty, just a logical assumption.
I am a reasonably intelligent person who has been reading and digesting the drum regularly for several months now. Given what I have read, I would be absolutely flabbergasted if the old peak were to be surpassed.
Matt
In regard to the C+C component, the cumulative shortfall between what we would have produced at the 5/05 rate and what we have actually produced, is on the order of half a billion barrels of oil.
Matt Simmons, in his recent Financial Sense interview, said that he thinks the recent surge in NGL production is very temporary, partly a result of some gas caps being blown down.
I wanted to ask about Simmons' comment on NGL. Do the gas caps get blown down when fields are retired forever (no longer a need for pressurization) or are they extracted to make way for water flood or some other kind of recovery mechanism?
The reason for asking is that we might be able to predict the size of the NGL contribution if it is tied to oil production dropping (field retired). The amount of drop could be used to predict the amount of NGL.
Jon Freise
Analyze Not Fantasize -D. Meadows
Ideally, with a gas cap expansion drive reservoir, we want to minimize the gas production, especially with a primary gas cap (where there has never been oil in the gas cap).
Frequently, we see a water leg, the oil column and a gas cap. So, we want to produce the oil, while minimizing the water and gas production. However, as the oil column thins this becomes more difficult and more expensive, assuming that the produced water and produced gas are both injected back into the reservoir. (In many cases, NGL's are stripped out of the produced gas, with the dry gas being reinjected back into the reservoir.)
It really comes down to an economic decision, i.e., what is the projected net gain from producing the thinning oil column, with steadily rising costs, versus blowing down the gas cap?
In any case, Matt's point is that the current NGL gain is a blip--basically the result of a lot of oil fields being in terminal decline.
Dave:
I do not get anything near a drop in OPEC output of 1.5 million BPD. Instead, I get something on the order of 865-900,000 BPD (sticking with either OPEC-11 or OPEC-12). It depends upon what you classify as the "fall" (as in autumn). Clearly from August 2006, the drop has been that dramatic, but decline in output was occurring before OPEC ever met to reset quota levels last fall.
Since condensates are not included in the quota, it is interesting to watch how they dramatically increased over the past couple of years.
I would remind you that your view as to what might occur 5 years from now as being far too low, might not be. Five years ago on the start of a very steep upslope in production (using Stuart's center point, single recursive method of averaging) the global production was an average of just over 77 MMBPD total liquids (actual was just about 75.6 MMBPD). Ten years ago (1997) we were at 74.3 though we were headed into an Asian monetary crisis just a little later. The prediction contained here is about 90% of the peak value and represents a falloff of about 10% over a 7 year period IF the peak for liquids really occurred
in 2006.
Whether the global system will follows something similar to US lower 48 production remains to be seen. But 5 years after the peak, US oil production in the lower-48 was down to 80% of the November 1971 peak. In seven years, it was down to 72%. What the US experience shows, though is that with the "main system" in decline, the additions from the GOM, Alaska, and NGLs was not enough to arrest the overall decline.
While you might feel, personally, that it is irresponsible to predict such dramatic declines, is it any less irresponsible to predict flat or growing production as if BAU was the norm? And as I recently pointed out, the EIA in it's assessment of peak oil predicts "collapse" not a slow and gradual decline even though they have pushed their collapse curves and predictions out into the future beyond the time horizons of many of us here.
You are right about the OPEC decline numbers. I exaggerated to make a point.
You exaggerated to make a point? Against an in-depth bottom up analysis whose conclusion you dislike? I think that right there says all that needs to be said about Dave Cohen.
"The greatest shortcoming of the human race is our inability to understand the exponential function." -- Dr. Albert Bartlett
Into the Grey Zone
OPEC C+C peaked in September of 2005 at 32,986,000 barrels per day. (EIA Data) In May of 2007 OPEC output was 31,303,000 barrels per day. That is a drop of 1,682,000 barrels per day.
Ron Patterson
Dave - I think your comments are quite justified.
I find it surprising that in an over-long update, this chart from the IEA is not included or discussed:
http://omrpublic.iea.org/supplysearch.asp
Ace - why does it seem that Saudi production has stopped falling for the last 7 months?
And we also have this rather excellent chart from Rembrandt published just last week that shows Saudi production returning to OPEC quota after a prolonged period of "over-production".
http://www.theoildrum.com/node/2864
Ace - I'd also like to know exactly what you mean by "bottom up forecast". My understanding of "bottom up" is an analysis of all assets that are summed to produce the forecast. You seem to rely heavily on decline rates and depletion rates - which I would regard as top down.
I seem to recall the last time this was posted, that Stuart raised the issue of decline rates and depletion rates - and you still seem to be using depletion rates. Would you care to explain the difference between depletion and decline and why you use the former?
I guess I'll file a "Friend of the Court Brief."
The EIA shows flat Saudi (C+C) production of 8.6 mbpd for four months, but even if production is flat for the remainder of the year, their production would be down about 5.7% year over year (average annual production).
Note that Texas production was basically flat for the first two years of its decline (at about 3.4 mbpd) after peaking at 3.5 mbpd.
From the Khebab/Brown Texas/Lower 48 article, posted in May, 2006:
Texas and the Lower 48 as a Model for Saudi Arabia and the World (2006)
http://www.energybulletin.net/16459.html
If order to refute the 2005 peak, we need to see Saudi production at or above 9.6 mbpd for a full calendar year.
So why did Saudi Arabia's production fall in 2001 and 2002 while Texas oil production increased in 1968 and 1969?
Showing a 10 year fragment of Saudi production and comapring it with Texas 33 years displaced!
Full explanation of logic deployed required please?
I should add that I don't necessarily disagree with the point that Saudi may be passed the C+C peak. But much more robust data need to be presented to make the case.
The entire Texas HL plot gave us a good idea of what stage of depletion that Texas peaked. A subsequent detailed examination of the pre-peak Texas plot suggested that the most accurate pre-peak HL estimate of the URR came from discounting the pre-peak "dogleg up."
In any case, my premise was that Saudi Arabia, in 2005, was at about the same stage of depletion (around 55%, more or less), at which Texas peaked, in 1972--thus the production plots, with 2005 lined up with 1972.
As to having possibly "nailed" the specific year for the start of the Saudi decline, I will concede the point that there was some luck involved.
I concur.
A common occurrence on most large field systems as they approach peak and then peak appears to be this dogleg effect. From every major field system it looks like that dogleg only lasts between 3 and 8 years (meaning there is a degree of luck in predicting when the peak will occur, but I haven't found any system able to go beyond 8 years and the "average," if there is such a thing, is about 5 years.
Note that the EIA in it's 2007 International Energy Outlook is predicting a global dogleg that lasts from now through 2030. The H-L plot for this segment points at 4300 GB but their prediction out to 2030 predicts an extraction total of approximately 1795 GB by 2030. That is interesting considering that the current H-L track is pointed directly at 2200 GB (1982 to present, including the dogleg up through 2005).
The EIA chart shows SA production carefully following their newly agreed quota from late 2006... or, the other way around. It is tough for outsiders to predict what SA production capacity will be twelve months out, but might we assume that SA can make an educated guess?
I look at the cuts they made before the Nov meeting, and in particular the ones made while price was climbing, as providing the important signal, not the ones after it. Who, after all, is OPEC? And, which member of OPEC made the cuts? SA calls the shots among the arab persian gulf states and has substantial influence in north africa as well. If SA says, "lets cut production 1Mb/d, and by the way we will shoulder 80% of the cuts even though we only produce 30% of OPEC production", do you think any OPEC member would object?
Assume, just for a moment, that SA cuts were involuntary. Wouldn't a quota that folows their own predicted decline rate be a good way to disguise the true situation, usefully keeping the rapidly growing tribe of princes at the deep end of the trough?
In order for KSA to 'carefully follow their newly agreed quota from late 2006' some assumptions would have to be made:
1. KSA knew they were lying about their total reserves.
2. KSA is very PO aware
3. KSA knew they were imminently peaking
4. KSA knew their exact decline rate to the barrel and preemptively cut their production to give us that illusion.
All are based on speculation of course...
So you think that the decline was involuntary?
PG and JK - I'm afraid you have me a bit lost here. If you look at the production forecasting records of the UK and Norway - who have the best public domain records of all their oil fields on planet Earth - you'll see that the government forecasting record is crap.
For KSA to have interally forecast their production decline and to then have followed it is the stuff of fairy tales. IMO - much more likely they have managed their production according to a script.
I'm inclined to agree with you to a degree here. One of the things that came out of the 'Ain Dar/Shedgum analysis was that we had to accept their increased OOIP to make the numbers work. There's little doubt that the eventual recovery factors in Baqi/Saleri for ADS are overstated, but I don't see a reason to doubt their OOIP claims at present. If that's true for the country as a whole, then there's 800gb of OOIP there. So then what's the recovery percentage? Well, if you assume it's somewhere in the range of 30% to 40% (in Laharrere's paper, the median oilfield globally is about 30%, and the median giant oilfield is 40%) that gives a EUR of 240gb-320gb (with 120gb cumulative so far, so 120-200gb remaining). (Of course we found 52% recovery in Ain Dar/Shedgum, but that's the best of the best, so presumably the whole country would be somewhat lower).
OTOH, the absolute minimum OOIP is 530gb (which is what the Senate 1979 report said from Aramco at the time), so 30%-40% there gives EUR of 160gb-210gb. However, I think that assuming no OOIP growth at all is very likely too conservative.
The HL evidence on Saudi Arabia is unreliable I think (I just did it last night, and it's not stable at all).
So, given that there's most likely a lot of reserves left (with admittedly very large error bars), the most likely story seems to me that they caught out believing their own optimism on recovery rates in North Ghawar, got unpleasantly surprised, and are now scrambling to bring other reserves into production to make up the ground (the Gestalt impression from reading all their press releases and speeches is that they really are working like mad to bring all these huge megaprojects to fruition as fast as possible). Hard to be certain, but....
Oops - that 800gb should have been 700gb (and EUR downscaled accordingly). Doesn't change the basic point.
Hi Stuart, do you have a graph for the HL?
Just curious how you "interpret" it..
Cheers, Dom
---
Just remember the Golden Years, all you at the top!
For KSA you have to do some paper cutting with the graph and smooth out production that was shut-in on purpose. I read some comments by one of the big names in doing these projects and this is what he did. Now I can't find the link. The point is you have to do some manual smoothing. In my opinion the discovery curve is a better approach for KSA.
Sorry for the unplaced quote I wish I had linked it.
One thing I would like to say is I think KSA will do anything to ensure they have some reserve capacity even as overall production declines. So I feel that their current production rate is a mix of real declines and shut in production. The key is how much spare capacity do they actually have. I'd suggest that they probably are scrambling to bring on line new projects as you suggest but on the same hand they are probably not bringing them into production but instead trying to build up a spare capacity level.
So I think first and foremost KSA wants to remain the swing producer even if they have to lower normal production to keep a spare capacity range. If I'm right then they will periodically have to lower normal daily production a few times a year. Since I believe they have some spare capacity they can control within a range when this lowering is done.
The smooth declines earlier point to them suddenly realizing they where in decline but I think they worked hard to rebuild some spare capacity.
I disagree. As noted down below, Saudi Arabia shows a strong linear pattern (much better data than the pre-peak Texas data) from 1991 to 2002. I think that one thing that the Texas data set does tell us is that we should discount these "dogleg up" inflections, once a region has established a fairly solid linear trend.
And in fact, if we plug in the recent production data, I think that the data points will fall much closer to the 1991 to 2002 P/Q intercept, suggesting a pretty pessimistic number for remaining URR.
This was my central point in January, 2006. Based on the HL analysis, the world's top three net oil exporters--accounting for about 40% of world net exports in 2005--are much more depleted than the world is overall. For the top three, when Russia starts declining (which may be happening now), I actually think that an overall 5% decline rate for the top three may be conservative. When we plug in the 5% plus increase in consumption per year, we get the Export Land scenario.
http://graphoilogy.blogspot.com/2007/03/could-saudi-arabia-be-more-than-...
Wednesday, March 14, 2007
Could Saudi Arabia Be More Than 70% Depleted?
by Jeffrey J. Brown
I wonder if the higher Russian export duties serves a twofold purpose: (1) To raise more money from recently declining oil exports and (2) To serve as an excuse for lower exports.
http://www.themoscowtimes.com/stories/2007/08/23/042.html
Rosneft Buys Local Crude Oil
The Moscow Times, Russia - 18 hours ago
Yes, it sure helps to support our predetermined conclusion when we're allowed to arbitrarily throw out whatever data tends to disprove it. Unfortunately, it's bad science. We would need a much better reason than "there was a similar wiggle in the Texas curve" to throw out the last four years.
Your claim of an EUR of 150gb is a 28% recovery rate on the 1979 estimate of 530gb of OOIP (which I consider likely to be too low). But even if we say it was 530gb, how likely is 28% as a recovery rate for a collection of some of the world's best oil fields? The uncertainties here are so large, that we probably can't categorically rule out 150gb, but certainly the odds are against it being that bad.
Well, some would argue that the production performance by the prior swing producer is relevant to the successor swing producer.
Also, how about the fact that the 2003 to 2005 (inclusive) Saudi data pointed to infinite reserves?
In regard to my "predetermined " ideas, you might recall that I staked out positions on Saudi Arabia and world net oil exports, based on production data through the end of 2005.
In any case, if we use all of the data from 1991 to 2005, it indicates that Saudi Arabia was about 58% depleted. This was my basis for warning (accurately it appears to have turned out) that Saudi Arabia was on the verge of a decline in production.
And then if we include 2006 it goes down to 52%. And so what will it be when we include 2007? 46%? And after 2008? Who knows right?
The point is that the method is not giving stable answers, and therefore we cannot rely on it in this case. This shouldn't be too surprising - where it has worked (eg in the US case), it's because the production curve has been roughly Gaussian. Saudi Arabia's production curve is nothing like that because they chose to deplete their reserves at very low depletion rates, and then got giant fluctuations added on due to the eighties demand collapse.
I don't see how declining production would show a lower level of depletion.
As I noted elsewhere, the 2006 and 2007 production declines would cause the HL plot to start reverting to something closer to the 1991 to 2002 P/Q intercept.
In any case, based on the 1991 to 2005 P/Q intercept, Saudi Arabia will be about 62% depleted at the end of 2007, assuming average production of 8.6 mbpd for 2007, versus about 58% depleted at the end of 2005.
I manually put the 2006 and 2007 (assuming 8.6 mbpd for 2007) data points on to Khebab's graph (using data through 2005) and as I expected, the data points show a reversion to the 1991 to 2002/2005 P/Q intercept. Basically, IMO, Saudi Arabia is showing the same kind of HL "bump" before and after its peak that Texas showed.
2005 Data: http://static.flickr.com/52/145149302_924470eaa7_o.png
My estimated range for Saudi Arabia's URR is from 150 Gb on the low side to 186 Gb on the high side.
However, Texas continued to decline, while KSA has remained exactly at their quot for the better part of a year. The two may be familiar dancers, but they haven't started the decline waltz yet. It is easy to get carried away with speculation that seemingly backs up your beliefs. I applaud Stuart for keeping an open mind. I only wish you could do the same.
Rounding off to the nearest 0.1 of the one mb mark, Texas had flat production for the first two years, while Saudi Arabia, if they average 8.6 mbpd for 2007, will have shown two straight years of declines.
There quota is 8.6 million bpd. Thats hardly a 'decline'.
From memory,
Saudi Arabia;
2005: 9.6 mbpd
2006: 9.2
2007: 8.6 (Year to date)
EIA data, C+C
Texas:
1972: 3.5 mbpd
1973: 3.4
1974: 3.4
(rounded to nearest 0.1)
BTW, OPEC member Indonesia was exporting about 500,000 bpd (Total Liquids) in 2000. They were a net importer from at least 2004 on, a probable net export decline rate of 50%-75% per year, from 2000 to 2003.
Like Saudi Arabia, I guess that they are staying close to their OPEC “quota.”
BTW, what do you call the OPEC quota for a net importer? Don't we need some new terminology?
http://english.people.com.cn/90001/90777/6247435.html
Indonesia concerned over declining oil output
August 24, 2007
Two interesting IEA graphs:
Saudi Production Versus OPEC Quota
http://omrpublic.iea.org/supply/sa_cr_tg.pdf
Indonesia Production Versus OPEC Quota
http://omrpublic.iea.org/supply/in_cr_tg.pdf
The HL evidence on Saudi Arabia is unreliable I think (I just did it last night, and it's not stable at all).
I wouldn't call the HL of world oil production stable either.
The estimated URR has been increasing by ~40 Gbb/year since 1995.
I got about 30gb/year in my analysis. I agree the stability surface could be bigger and flatter, but it's an order of magnitude more stable than Saudi Arabia's HL is. Confidence(US Linearization) >> Confidence(World Linearization) >> Confidence(KSA Linearization).
Yes. Regarding #4, if not to the barrel then to the 100k barrel. They had already noticed their involuntary cuts that had occurred from 1/06 thru 9/06, could extrapolate from that (presumably even better than stuart), and knew what projects were coming on line and when. Pretty easy in oct to figure out what their max production would be for the next year and tailor the quotas to follow their expectations.
While somebody on this site thinks the cuts were too fast to be involuntary, I think they were too slow to be voluntary. Imagine that their capacity was and remains at least 9.6Mb/d, their output of a year ago. It is easy to precisely maintain any production value under max capacity, so, cutting from 9.6 to eg 9.0 (if this is the 'right' new value) would not be spread out over several months but would occur over a few days - just turn down the taps. THe new output would then be exactly maintained until another decision was made. What did occur was, month by month, and as prices were rising, we saw a ragged, erratic decline.
Returning to the 9.6 value, they did in fact maintain exactly that rate for at least half a year; I conclude from this that during that period their max capacity was at least a little bit above what they were producing. The gradual decline that followed began before the new quota and continued, uninterrupted, after the quota was supposed to begin. TO me, it looks entirely as if they have been producing at max capacity ever since falling off the 9.6Mb/d plateau, and further that the new quota, determined by SA and almost exclusively implemented by them, is conveniently masking the real situation.
Sounds like me JK. Too many riddles here for me to unravel. I'll have a post on Saudi by the end of the week. Just bear in mind that Ghawar alone could have produced over 15 mmbpd - but never did.
Would you care to say what the maximum capacity of Safaniyah is - I got a lot of reservoir data but don't know the answer. Returning to Dave's initial point, Safaniyah crude contains a few % sulphur making it very tricky to refine - I believe the Saudis are building new refinery capacity along with Total to deal with this. But how do we deal with this concept of unusable productive capacity in the interim?
Party: Your "inverse assumptions" are ludicrous.
1. KSA is somehow compelled to let everyone know exactly what they know about their oil reserves situation.
2. KSA are not PO aware (must be because they are Ay-rabs!)
3. KSA has no idea when their oil production is peaking (the producer is always the last to know-maybe they could ask experts like yourself).
I was being factitious :P
I'm going to throw my hat into the ring with Euan and Dave here. If we look at the 2006 Opec Bulletin, we see that the Saudis drilled 382 wells in 2006. At historical levels, this implies about 250 new oil wells. Their producing oil wells went from 1885 to 1933, i.e., a gain of 48. Therefore, they "furloughed" roughly 200 wells. If we look at their history prior to 2006 here http://www.uwm.edu/~kswanson/retire.jpg (see the earlier story by Euan here http://www.theoildrum.com/comment/reply/2828/230237) we see that a furlough level of 200 wells is consistent with a drop in production of about 800kbbl/d, in other words, more or less the year-over-year production drop in Saudi Arabia.
I will put my cards on the table saying that Saudi Arabia is not experiencing any difficulties with production - the cuts they have made are totally voluntary.
The fact that they furloughed 200 wells doesn't prove anything one way or the other. Maybe those furloughed wells had to be furloughed in order to keep the water cut manageable in the very heavily depleted parts of certain fields. Or maybe they furloughed them, even though they didn't strictly need to quite yet, to make almost depleted areas last a little longer, since they don't have the replacement capacity in place yet (scrambling like mad to finish all those megaprojects). Or maybe they just felt like charging $80 for oil for a while. Knowing that 200 wells got shut-in tells us nothing about why.
I agree that all of those are possibilities. However, the bottom line is that they are not acting any differently than they have in the past with regard to the relationship between well furloughs and production declines. It is difficult to argue that something has fundamentally changed until established statistical behavior is broken. Definitive proof of your hypothesis to me would have been a small furlough (or even pulling wells out of furlough) and still seeing a production drop, which would suggest a level of panic to keep production up. Time will tell...
"Definitive proof of your hypothesis to me would have been a small furlough (or even pulling wells out of furlough) and still seeing a production drop"
I wouldn't expect to see this since capacity is likely constrained by water handling. Pulling too-wet wells out of furlough would not likely increase oil production.
I have been thinking that Saudi Arabia's declines could be voluntary, but it doesn't make sense unless their reasoning is that they, and the world, are soon going to peak involuntarily, and that despite historical high prices currently, it makes sense to cut back moderately now and save some oil for when prices go even higher.
If they really believed they would not be peaking for 30 more years, they'd be taking full advantage of the current hysterical prices (If peak oil was not now or just around the corner, these prices are hysterical).
So, in the end, voluntary or not, their reduction in production is essentially peak oil - they will never produce more than 9.6 mbpd.
Hi speek,
re: "it doesn't make sense unless their reasoning is that they, and the world, are soon going to peak involuntarily, and that despite historical high prices currently, it makes sense to cut back moderately now and save some oil for when prices go even higher."
Interesting.
re: "If they really believed they would not be peaking for 30 more years, they'd be taking full advantage of the current hysterical prices (If peak oil was not now or just around the corner, these prices are hysterical)."
Except - what does "taking full advantage" mean?
If they voluntarily produced more, this lowers the price - right? (Or, no?)
So, how would an effort to "take full advantage" look any different?
Taking full advantage would mean pumping more oil. In the past, OPEC nations fought to produce as much as possible - probably to maximize revenues. They all inflated their reserves estimates to get the maximum quota, and many times produced more than their quota.
That attitude seems to have now changed, and suddenly Saudi Arabia is seeing the logic of voluntarily reducing supply? When there appears to be willing buyers for more oil (like in Africa and Asia)?
I can only think that they see that the world is never going to produce more oil if they don't want it to, and that their reserves are limited too. So although they may be able to produce more than 9.6mbpd currently, they know it's merely temporary, and that it makes sense to hold it back to preserve future revenues.
It seems to me that something in KSA has fundamentally changed: their rig count. Their rig count has quickly gone from a long plateau to exponential; SOMETHING has changed. As rig lease rates are way up, it seems reasonable to think that *something* is pretty dire.
If you look up the thread to the Texas versus Saudi production plot, in the Seventies Texas saw the biggest drilling boom in state history, following a huge increase in oil prices, which resulted in a production drop from 3.5 mbpd to 2.5 mbpd, from 1972 to 1982.
Based on HL, Texas was 55% plus depleted in 1972, when we peaked.
Based on HL, Saudi Arabia was 55% plus depleted in 2005.
In response to higher prices, both regions showed increased drilling and lower production.
Paranoia without direct evidence. Go ahead, speculate.
Please cut the personal insults, thanks.
My point was exactly that this particular piece of evidence didn't tell us anything, one way or the other.
Kyle - I think the general observation that the Saudi drilling behaviour has not changed is fare enough. The fact that the Saudis can still come up with new drilling locations that produce dry oil will IMO keep them bumping along sideways for a while yet.
Stuart makes a valid point though. Many wells that are shut in will have high water cut - even though they may be producing a lot of oil as well. The flood front in a supergiant keeps moving and many / most of the high water cut wells will never be re-opened.
To expand their oil production the Saudis would have to greatly expand their water handling capacity at major cost. So they have a choice. Produce less oil at higher price and spend the money on schools, hospitals and private jets. Or spend the money on water handling facilities in order to keep the oil price and their revenue stream down. Hmm? They must have spent a long time working that one out.
Hi Euan,
Decline rates and depletion rates. Let's say a country has 100 mb yet to produce oil. In year 1, production is 5 mb. The depletion rate is 5/100 or 5%. In year 2, production is 5 mb. The depletion rate is 5/95 or 5.26%. The production decline rate is 0% as production rate remained constant. Please read page 5 of Colin Campbell's newsletter. http://www.aspo-ireland.org/contentFiles/newsletterPDFs/Newsletter80_200...
I use a combination of decline rates and depletion rates.
The assumptions behind the bottom up forecast are many and in some cases are country specific. An example is probably best here.
Brazil, a positive case, 23 projects/regions
May 07 C&C 1.73 mbd forecast to increase to 2.44 mbd on Oct 09
Existing production
mostly assumed decline rate of 4%/yr, each year, some on plateau production. Mature Campos & Santos fields decline at 8%/yr.
New projects have ramp up to peak, plateau then decline.
Remaining URR (yet to produce oil) of 15 Gb
BP proven reserves 2006 12.2 gb, Petrobras 2006 annual report says 12.3 Gb proven oil and condensate reserves. So 15 Gb includes probable.
Depletion rate (monthly production/remaining URR annualised) is 4.34% for May 2007. Depletion rate is forecast to be just over 7% for mid 2009. This appears a little high but the North Sea depletion rate is also high at 6.5%. (see Colin Campbell newsletter above) Consequently, the decline rate of 4%/yr is not changed up until mid 2009.
However, in late 2009, the depletion rate becomes too high at over 7.5%. Consequently, the production decline rate of the mature fields in the Campos and Santos basins is increased so that the depletion rate stays at about 7%/yr.
Using depletion rates in conjunction with decline rates implies that decline rates of a field change over time. Colin Campbell uses depletion rates as a key part of his forecasts for ASPO Ireland
http://www.aspo-ireland.org/contentFiles/newsletterPDFs/Newsletter80_200...
page 5, "The Eighth Step is to calculate Depletion Rate (annual production as a percent of Future Production) by year, which is a useful check against the estimated Total. For example, a Depletion Rate above 10% would suggest that the Total had been under-estimated."
Colin Campbell was the external thesis supervisor for Robelius's forecast which was endorsed by Dr Hirsch.
The excellent lecture http://globalpublicmedia.com/lectures/461
by Dr Albert Bartlett supports the use of depletion rates as he said production goes up exponentially and then down exponentially. Assuming that Saudi Arabia can produce at peak plateau for Ghawar and then suddenly drop at 10 or 20%/yr decline rate is highly unlikely. Production will drop gradually as shown by the dark blue line in Fig 10 above. The use of depletion rates forces the use of variable decline rates for a field.
For more discussion about depletion rates please see
http://www.theoildrum.com/node/2476
Notice that Saudi Arabia defines their depletion rate as annual production as a percentage of total reserves (produced plus remaining) unlike my definition (and Colin Campbell's) which is annual production as a percentage of remaining ultimate recoverable reserves. This is why Saudi Aramco says that their typical depletion rate is only 2%/yr.
In the link above, I calculated actual depletion rates (remaining reserves) to be over 5%/yr for Ain Dar/Shedgum and Berr. Abqaiq had a depletion rate of over 10%/yr. Abqaiq production must be almost zero now.
I look forward to your next post on Saudi Arabia :)
Ace - thanks for the link to Campbell's methodology which I have read with great interest.
I thought I understood the difference between depletion and decline rate and asked the question for the benefit of others - but now I am confused with several conflicting definitions.
A crucial comment from Campbell:
Depletion rate is of course linked to one's notion of producible reserves (URR). Correct me if I'm wrong here. It seems to me that if Campbell gets a depletion rate that appears too high then he increases his reserves whilst if you get a depletion rate that is too high you reduce your production (accelerate decline)?
I note that you reference Campbell, Hirsch, Robelius etc and I get the impression you are following the same methodology, however, Luis points out that Campbell has a URR of 280 Gbs (C+C+NGL?) for KSA and you have only 175Gbs for C+C - that's a massive difference and I'm trying to get at the root cause of this discrepency.
Hi Euan,
You will be talking to Colin Campbell soon, I assume, so you can debate the depletion rate methodology and KSA with him.
Campbell does prefer a URR of 280 gb for KSA as stated in his April 2007 newsletter, page 7,
http://www.aspo-ireland.org/contentFiles/newsletterPDFs/newsletter76_200...
but maybe you can ask him if it includes NGL and also his split between the primary KSA fields of Ghawar, Berri, Abqaiq and Safaniya?
Campbell states in the above newsletter that
"Han Jud of Switzerland...concludes that..a total of 205 gb would have been produced.
The current assessment preferred here assumes that the reported official reserves are original, not remaining, which, with provision for modest new discovery, gives a total of 280 gb, of which 107 gb have been produced already. This model holds production flat to 2025 followed by a terminal decline at 2.9% a year. This is admittedly a relatively low depletion rate, compared for example with 4.5% in the US-48; 6.5% in the UK; 7.2% in Norway or 3.6% in Russia, which could be taken as evidence for reducing the estimate of the Total in the direction of Jud's analysis. Saudi Arabia is now deploying horizontal drilling as it attempts to tap the less productive zones in the Ghawar field, holding almost half the country's total discovery, which tends to support production in the short term, but accelerates depletion, leading to a deferred but steeper decline."
Hans Jud does not support a total of 205 gb, but a total of 165 gb crude oil.
You add in an amount for NGL.
I assume 175 gb for crude oil and condensate. Would you please ask Colin Campbell how he arrives at 280 gb?
Hi Dave,
The forecast in Fig 1 is a sum of the forecasts from Figs 3, 11, 12 & 13.
In the first two paragraphs of section 5, I acknowledge that Saudi Arabia and Kuwait have spare heavy sour capacity of 2.2 mbd. However, I assume that there is no surplus capacity in the forecast which allows a slower decline in forecast production in Fig 9. If I assume that this surplus capacity is produced, assuming that refinery capacity exists, then the forecast production declines more slowly over the next few years but then the decline rate will be steeper.
I like Skrebowski's megaprojects schedule and I probably would not have done this project based forecast without his project list.
http://www.odac-info.org/bulletin/documents/MegaProjects_Feb2007.pdf
However, I have used his list as a starting point. I have researched almost every project on his list. Here are a few projects on his list that are problematic:
Shaybah (ph 2) 0.25 mbd 2010
Aramco no longer has this project scheduled. This probably means that it has been cancelled. Shaybah peak production will probably be 0.75 mbd instead of Aramco's original promise of 1.0 mbd
Al Khafji exp 0.30 mbd 2011
Aramco no longer has this project scheduled. According to Obaid slide 9, Nov 2006
http://www.csis.org/media/csis/events/061109_omsg_presentation1.pdf
Al Khafji: "Project not confirmed, but highly likely considering current energy initiative."
ExxonMobil GTL (Qatar) 0.154 mbd, 2011
ExxonMobil has cancelled this project
Double counting Iran
Kushk-Hosseineh 0.30 mbd, 2010
Yadavarn, 0.30 mbd, 2011
as you said here http://www.energybulletin.net/31726.html
Indonesia Jeruk, 0.06 mbd, 2007
http://www.theage.com.au/news/Business/Cue-Energy-approached-for-merger/...
Probably won't go ahead under existing Indonesian fiscal terms
Kashagan 2009 0.45 mbd
This project will be more likely to be delayed until 2011 start.
Double counting Indonesia
West Seno ph2 0.05 mbd 2005
Offshore Kalimantan 0.05 mbd 2008
That's 1.11 mbd cancelled capacity and 0.45 mbd delayed capacity.
Skrebowski's assumption of underlying decline rate is probably too low "Skrebowski uses a world decline rate of about 1.6% for his models"
http://www.ldeo.columbia.edu/~odland/Shifting_the_PO_Debate.pdf
I referenced your Russia work in last paragraph of section 4
"World C&C production is dropping, on a year on year basis, by about 0.20 mbd (Figs 7 & 8). This is not a high decline rate but given that Russia is probably unable (hyperlinked under unable) http://www.energybulletin.net/33560.html and unwilling to increase production and that Saudi Arabia, the North Sea and Mexico are unlikely to reverse their decline rates, the world C&C production rate will continue to decline (Fig 3)."
77 mbd total liquids in 2012 implausible? I really hope so but based on my assumptions that's the number. I have assumed total URR of 175 gb for Saudi Arabia. If you think it's closer to 400 gb and all the other OPEC upwards revisions in the 1980s are true then the forecast for 2012 would be higher. The forecast does not show the world falling off a cliff. As shown in Fig 3, the resulting decline rate is only 1%/yr until 2009, followed by 4%/yr.
Under my assumptions, there is a possible peak world total liquids on July 2006, probable peak world C&C May 2005 and probable peak Saudi C&C peak June 2005.
My forecast assumptions are not all negative.
I assume that Kuwait has 45 Gb remaining URR. Colin Campbell thinks that, page 7, http://www.aspo-ireland.org/contentFiles/newsletterPDFs/Newsletter80_200...
"The jury is out on the issue, but the balance of evidence
begins to points at the lower numbers." being only 19 Gb!
I also think that my ethanol/XTL forecast is too optimistic.
What do you think of Robelius forecast? My forecast is better than his worst case.
http://www.theoildrum.com/node/2716#comment-215192
What is your forecast of total liquids for 2012?
If you look at the recent O&GJ article about new oil projects coming on-stream, you will be better be able to evaluate how much the oil supply may increase in the 2007-2009 period, especially outside of OPEC. Now, I am not saying all this will come to pass, or increase things much given the 4% decline rate, but there is no doubt whatsoever that your forecast is worst case, that is to say, very pessimistic.
On the OPEC side of the equation, Venezuela is a fuck-up as is Nigeria. In the Persian Gulf, we wait and see.
The world is a complicated place. It would be helpful if, in declaring the peak of world oil production, you (and Stuart and others) would acknowledge it.
Only five years ago on April 2002, total liquids production was 75 mbd. Five years from now in Dec 2012, I forecast 77 mbd - perhaps optimistic?
It would be much more helpful if you could provide specific feedback rather than using the words "no doubt whatsoever that your forecast is worst case, that is to say, very pessimistic". What is your forecast total liquids production for 2012?
I continually revise this forecast and I do my best to use reasonable assumptions. Do you think that total URR of 175 Gb is too low for Saudi Arabia? Another 25 Gb won't make a difference to the big picture.
I assume that you would disagree with the last part of section 1 below?
Al-Husseini also made this statement in 2005 about the physical ability of the world to increase production:
‘‘You look at the globe and ask, ‘Where are the big increments?’ and there’s hardly anything but Saudi Arabia,’’ he said. ‘‘The kingdom and Ghawar field are not the problem. That misses the whole point. The problem is that you go from 79 million barrels a day in 2002 to 82.5 in 2003 to 84.5 in 2004. You’re leaping by two million to three million a year, and if you have to cover declines, that’s another four to five million.’’ In other words, if demand and depletion patterns continue, every year the world will need to open enough fields or wells to pump an additional six to eight million barrels a day — at least two million new barrels a day to meet the rising demand and at least four million to compensate for the declining production of existing fields. ‘‘That’s like a whole new Saudi Arabia every couple of years,’’ Husseini said. ‘‘It can’t be done indefinitely. It’s not sustainable.’’
On May 2007, Iran produced 3.9 mbd and Iraq 2.1 mbd. What is your optimistic forecast for 2012 for these countries? Do you think that production will go down, stay the same or increase?
What do you mean by "acknowledge" in reference to peak? I assign a high probability to world peak C&C production in 2005. To get a 100% certainty for peak would require confirming statements from OPEC about true reserves remaining.
My forecast of total liquids in 2012 is somewhere between 83.0 and 81.0 million barrels per day.
There you go, I said it. A peak and then a plateau which gradually descends thereafter.
Thanks!
Although my forecast for Dec 2012 is 77 mbd, my forecast for the start of the year, Jan 2012, is 80 mbd, which is only 1 mbd less than your lower limit.
Before production falls there will be a frenzy of investments.
What do you need to have in place to attract investments in low but positive EROEI biomass and very capital intensive hydro, nuclear and wind power?
What would make investors choose to invest in a country like Sweden instead of biomass in tropical countries, very heavy oil in remote or politically unstable areas or crazy stuff like open pit mining of old shallow oilfields or blowing off the top mountains with coal in them?
Having ideal infrastructure would be a posibility but it cost to build and maintain and that cost will in some way be carried by the users.
Dear Ace,
Thank you for this summary and for keeping these forecasts updated. Clearly you put alot of work into this.
I have a question which as been asked before (in threads on previous updates on your numbers) but which, to my knowledge, has not been given a comprehensive answer yet. If you have taken on this question in a previous thread then please make me aware of this and point me towards the relevant post if you don't want to repeat yourself!
The question is this - how do your Saudi Arabian forecasts take account of additional production (such as Khurais) that we know is planned to come onstream in the coming years. Given the technical capabilities of Saudi Aramco I see no reason for assuming that projects they have planned will simply 'not happen'. Thus, take the example of Khurais - planned production 1.1m barrels. You quote Simmons as saying Khurais will only produce 0.8m barrels. I can't see how he can possibly know this (given the lack of information and the relatively early stage of the project) but let's take this as an agreed estimate.
Khurais is scheduled to come on (as you point out) in December 2009. At that point, according to your forecast, Saudi Arabia is producing 8m barrels/day. With an assumed decline rate of 5.3%/yr (equal, mathematically to the depletion rate on a REMaining basis), this means that Saudi production should decline (roughly) 10% over then next 2 years (Dec 2009 - Dec 2011). Thus, even if it takes Saudi Aramco fully 2 YEARS to get Khurais up and running at the assumed 0.8m bbl capacity (=73% of their stated target capacity) we should expect to see Saudi production roughly flat in the two years from Dec 2009 to Dec 2011. Yet your graph (unless I'm being fooled by the scale or something) shows production declining from 8m bbls to (around) 7.3m bbls in that time.
Can you please shed some light on this and tell me if I have misunderstood?
Cuchulainn
The resulting decline rate of 5.3%/yr is a net decline rate, after infill drilling and other remedial actions. Please see the penultimate paragraph in section 5 about decline rates. The gross decline rate of existing production, prior to new fields and infill drilling is closer to 8%/yr.
So, in 2009, production is forecast to be 8.2 mbd. Two years at 8%/yr gives about 1.3 mbd. Khurais is 0.8 mbd, leaving a shortage of 0.5 mbd. There will be bumps along the production decline curve (Fig 9) but the more relevant long range forecast (Fig 10) will not change significantly.
Whose projections are these, exactly? Ace's? A combination of Ace's and someone else's? (I apologize if this is a "dumb question" that everyone here knows the answer to.)
Where did the price projections in Figure 1 come from? Speaking as a card-carrying economist, let me say that few things make my hair stand up on end like long term price predictions in such a wildly volatile arena. No one has a good function for mapping supply and demand to price, especially with all the influence market psychology will have in the unfolding oil situation. I'm not saying these numbers are necessarily wrong and others are right, as much as I'm saying that any such predictions are worthless guesses.
For that matter, where did the demand projections come from, and what are the assumptions behind them in terms of market response to rising prices?
Chris Skrebowski's bottom-up analysis says (quoting from flawed memory) that the peak will be something like 91mbd in mid-2011. That's dramatically different from what you're showing in Figure 1. Why should we believe one set of projections over another?
Given that world cumulative C+C production is about a half-billion barrels less than what it would have been if we had just maintained the 5/05 rate, while oil prices are significantly higher than in the period preceding 5/05, I would think that Deffeyes had a pretty good prediction for the world (C+C) peak--2005, within a 2004 to 2008 time frame (EIA data).
They are strictly the opinion of Ace.
Have a look at what Chris predicted for this year. Where is that oil?
Note that he saw production rising from the c+c and all liquids peaks, not falling. And, while some may insist that a portion of his missing barrels are on account of OPEC voluntarily reducing production, notice that these cuts were begun while price was surging past one all time high after another 1h06. IMO the bulk of OPEC cuts were involuntary.
One can only conclude that, at the moment, old field declines are exceeding new field production, and new fields seem to be routinely late. For this to be reversed, either the old fields must decline at a lower rate (eg new tech) or the new fields must produce on time, stronger, and/or more frequently. The problem at or near PO is that the number of old fields in decline continually increases while the new fields come on at a fairly steady rate, not much different from a few years ago, except that the new fields are smaller, produce less, and go into decline sooner.
Assuming Ace' chart is based on a bottom up analysis, and assuming he includes the various announced fields that are pretty much like Chris', then presumably he assumes a higher decline rate from existing fields. At the moment actual world production (decline) is matching his chart better than others. As an aside, IMO there is not sufficient infrastructure, eg rigs, to maintain production as more and more fields go into terminal decline; of course, this is a good thing, because the lack of equipment means that we hit PO sooner and that the post PO decline rate is a little less steep.
I fully agree that predicting price and/or demand is much tougher than supply, and that such predictions are not worth much.
I would agree with you insofar as projections are only as valid as their underyling assumptions and that they should be expressed as a range of possible outcomes. But when you say that the predictions are worthless guesses do you mean that, given the lack of available information, the range of possible outcomes is so large that for all intents and purposes in five years the possibility of oil being $200/bbl is as likely as $10/bbl? Or do you mean that the guesses are worthless for investment decisions or policy decisions? Most PO literature I've read places the peak between 2005 and 2015. My guess is that the governments of Russia, the U.S., China, the EU, etc. have modeled demand possibilities, supplies and price possibilities within this time frame. Gene's post above poses the right question.
Whatever the actual price and demand figures turn out to be, it's apparent that as Russia buzzes U.S. and U.K. airspace with bombers and plants their flag in the Arctic Ocean that they assume high demand, high prices and a shortfall in supplies. In the same manner, China is on a crash naval program and has laid claim to the Spratly Islands to extend their claim on oil in the East China Sea.
These types of actions do not give me confidence that PO is anything but imminent if not already here or that I should expect prices to drop to $40/bbl. Bull market in oil?
Thanks for the recognition ;) And India is building a base in Kazakstan, etc. Those are only the things we know about.
A friend recently asked me what he should tell his college-bound grandson about dealing with a post-peak world. He'd explained the situation to his grandson in a more close to home hypothetical example using his small hometown and propane as the fuel (not so far off in that, I think ). He was trying to impart some advice as to what skills, and/or things, would be of value when people realised there is not much you can do with money except lite fires with it, and that "trade goods" and basic skills (think 1800's ) would be of more value than paper money and a law degree. Not having a crystal ball handy, I told him what I knew of those kind of extreme circumstances. That having experienced firsthand what happens to a society that is deprived of essential goods (food in this case )that life becomes very precarious and very, very ugly ( in some detail which I won't repeat here), and that his grandson should do everything in his power to keep that from happening in this country.
I don't know the future. I can see some tiny part of what is happening in the world provided somebody reports on it. And I can speculate. And I can plan for the worst while hoping for the best. That's about it. Other than that, it's just: "So long and thanks for all the fish".
Hi Gene,
Thanks for talking about the next generation.
re: "and basic skills (think 1800's)"
I like to add some skills that are perhaps old - yet also may be recent innovations. These are not necessarily easy to learn, at the same time, anyone can try - and the results can be useful (and sometimes amazing). Some examples:
http://en.wikipedia.org/wiki/Mediation,
http://www.colorado.edu/conflict/peace/treatment/tmedtn.htm
Along with: www.cnvc.org, www.gordontraining.com, www.newconversations.net.
Thanks for the links. Non-violent conflict resolution has it's place. Have you ever had the opportunity to practice these forms of mediation in a real world situation, where the people involved have only one concern - staying alive for one more day? I'd be interested in your experience if so.
"But when you say that the predictions are worthless guesses do you mean that, given the lack of available information, the range of possible outcomes is so large that for all intents and purposes in five years the possibility of oil being $200/bbl is as likely as $10/bbl? Or do you mean that the guesses are worthless for investment decisions or policy decisions?"
I definitely don't think that $200 and $10 oil are equally likely--why would anyone think that at this stage? But I do think that there's such a large error factor in prices projected more than a few months out that drawing a single line, and one showing oil at $190/barrel in five years, is a waste of time.
And for that matter, what does the demand line on that same figure mean (I'm guessing it's quantity desired, as in the normal economist formulation)? We can measure or talk about consumption easily enough, but demand? About all anyone can do is look at rising prices and consumers pushed out the market and make a rough guess at what demand would have been at the old/lower price--in other words, we can reverse engineer the demand curve from empirical evidence of market response.
To project both much higher prices and growing demand (appears to be 96mbpd in 2012) requires some very specific assumptions about demand. I don't see how anyone can make a reasonable projection of demand under such trying market conditions except to rely on a simply linear extrapolation or to pull numbers from some source that might not even agree with the price assumptions being made.
I'm making a big deal out of this because it's one of my hot button issues. I've long ago grown very tired of the ridiculous price predictions we see all the time in oil discussions--"If Hormuz is closed oil will hit $250!", etc. Such predictions are worthless, if only because the actual price will depend on far more than just the inciting incident the predictor is talking about. In other words, they're nothing more than a blatant guess, but they're given unwarranted weight because the person attaches a scary integer to them, making for a good headline. Over on my site I've complained about this for a long time, as even some people I respect greatly (e.g. Simmons) do it, and I think it just makes them look foolish.
ace, thank you for that. If you have time,
would you comment on the status of oil shale.
I believe Canada is in the process of extracting oil
oil from oil shale.
Also, there is supposed to be a huge deposit in
Colorado. Is this a viable source of oil?
Yes!! Oil shale contains huge reserves, enough ffor all of us for 100yrs...however....
You need to heatup the shale to release the oil. It needs to be really really hot. Steam injection doesn't work real well. so what to do?
Well the US military will be heavy into oil shale production in about 20yrs when the rest of their sources dry up.
Of course the onnly way to economically extract the oil will be to drill a really deep hole under the shale and deposit a nuclear device down there. preferably around 5 megatons. Fill hole with LOTS of concrete. Ignite. Wait about a week and then drill down to the liquified shale and get the oil. fun stuff.
Resistive electric heating works buy you need massive ammounts of very cheap electricity.
Of course, if we had massive amounts of very cheap electricity, it'd be pretty stupid to waste it extracting oil, which we would then basically turn into electricity!
Well this all depends on infrastructure in place.
Assuming cheap electricity via nuclear power (yes, it has been contested) and an oil based infrastructure, it'd make sense somehow to turn electricity into liquid fuels.
After all, electricity does not pour well into gasoline tanks.
As long as we are on top of a logistic infrastructure that works on oil, no amount of additional electricity by itself will solve oil shortage problems.
Electricity needs to be turned into liquid fuels, until we are in the age of electricity (if ever).
Continuing to invest in the oil infrastructure under such conditions strikes me as exceedingly dumb.
Nuclear power => electricity => extract shale oil (EROI?) => burnin ICE engine at 25% efficiency.
The energy from the nuclear power could have been used in an electric motor at 90% efficiency. Not doing that seems monumentally stupid.
One source of heat that might be in plentiful supply is heat
from radioactive nuclear power waste. This can get very hot if not kept in a well ventilated place. So put waste canisters down bore holes in the oil shale and wait, or maybe
just keep drilling bore holes and dropping canisters until
the field starts producing.
Just a thought...
supertuscan,
There is no oil shale production process that works, is economic to operate and has been tested, Shell closed their research project in Colorado a few months ago. Are you referring to the Canadian tar sands development? or is there a Canadian Shale project I don't know about?Bob Ebersole
Thank you for clearing that up.
I knew Shell claimed to be working on an in situ
retorting technology with the goal of
producing oil at a cost of $30 per barrel.
I was not aware that had been abandoned.
Yes, I was thinking of the
Canadian tar sands development.
How is that fairing?
(You Oil Drum posters are wicked smart ;)
supertuscan,
the tar sands development is coming right along. If you'll read the Canadian reserves and production report by Stoneleigh on TOD Canada about a week ago you'll learn more than you ever wanted to know, guaranteed, with links.He really documents his work.
Look, the problem with the tar sands development is that the capital costs for the equipment to mine the stuff and turn it into synthetic crude oil (syncrude) is that it costs $100,000 per barrel per day of production. Its already producing about 1,000,000 barrels a day, and the operators want to add an additional 4,000,000 a day. The new production is going to cost an additional $400,000,000,000.00 Yes , thats right, as much as the war in Iraq in additional costs, plus each barrel will require an additional $40 to $60 in operating costs to produce. The government of Alberta is charging them a 1% royalty,thats 15% less than the 1/6th that they charge on other oil production in Canada. That's bound to go up. The syncrude producers are using 6 barrels of water for each barrel of syncrude so far, so thats 210 million gallons a day for the project in the North American West.
They are dumping the water and sand and clay in giant unlined open lagoons out there, a practice we made illegal in Texas over 40 years ago, oil operators have to put their waste water in disposal wells to protect fresh water. Thy're using 6,000 cubic ft of natural gas per barrel of syncrude for the heat to make the process work. Canada is post peak on their natural gas,too.
And with all those costs, the syncrude still has to be taken to a refinery and turned into products. The companies claim they are making a gross profit of $10.00 a barrel, but as you can see from the cost figures that is utter BS.
To put a little perspective, average drilling costs in the US and production costs are about 1/10th as expensive as their tar sands, and the US is producing 3.8 million barrels of oil per day, and this is 33 years after the US peak in production. Companies in the US pay about 1/10thof that figure to buy producing wells in a field, or around $7/bbl for proven reserves behind the pipe.
I think the tar sands people are counting on prices of about $200 a barrel to get their money back within about 5 to 10 years, but that's a wild-ass guess. That translates into gasoline prices of $8-$10 dollars a gallon, or over $2.00 a liter. I buy oil leases, I'm not an engineer like the guys posting above who are actual experts.
Bob Ebersole
Bob, I find that very disconcerting.
How long until the collapse?
Anyone watching the arctic ice collapse
has to be saying: whaa?
The persistent antarctic warming has me utterly baffled.
What you think?
Very good summary.
As a side reminder, some of us in Europe are already paying $1.75/liter (c. $6.6/gallon).
No crash, no collapse, no depression.
I think we might be able to take another 20%-30% price hike without serious economic issues (based on modeling of economists here).
Then again, US is different and looks to be quite dependent on cheap gasoline.
How things play out in US might be totally different, esp. if the price rises in a very short period of time (and not slowly/progressively).
some of us in Europe are already paying $1.75/liter (c. $6.6/gallon).
No crash, no collapse, no depression.
One thing that needs to be remembered: the extra money spent on fuel in this case is staying in country thus has less impact on the economy.
One other thing needs to be remembered, the economies of these (European) countries that have higher gas prices than the US are built around and adapted for these prices since very long. The more than double prices here in Europe are not a result of a sudden price chock but that's "always" been the case that we've had higher prices here due to fuel taxation. While I do agree that the EU generally is more prepared to fuel price increases than the US or some developing countries, I don't think that a sharp increase of crude oil costs hardly would go unnoticed here..
While we have a very good rail infrastructure in place, walkable cities and other peak oil-friendly factors, not even we Europeans harvest our fields with electrically powered machines or enrichen our soils with fossile fuel free alternatives.
Canada is primarily extracting bitumen from "oil sands." Think very old degraded oil that is more like asphalt and that does not have much in the way of "light ends" without some addition processing.
Oil shales, specifically the Green River formation in Colorado, Utah and Wyoming, is kerogen (young oil). There are several processes under investigation. But none are slam dunks as to their viability. Some of the small test plots may not scale up well and the idea of requiring a 1200 MW power plant running 24/7/365 for every 100,000 BPD increment of production (Rand Report estimate from the limited data available from Shell), with all of the efficiency and water requirements for that part of the world (it was still a high desert region when I was out their last year), will likely be very problematic.
Some of the data from Shell is very optimistic in the energy conversion efficiency. Yes, combined cycle turbines can be very efficient AND to reach that efficiency require very clean gaseous fuels. Turbine efficiency suffers at high ambient temperatures of summer and the high altitude, but with the dry air, sufficient turbine inlet cooling can be provided to offset some of that power loss. The HRST of the combined cycle portion requires cooling water and ambient temperatures can severely limit the efficiency of THAT steam cycle.
The question is one of rate of production. Theoretically you could replace the US oil import with about 200 GWy of electrical power being supplied to heat and extract the kerogen product. Think something on the order of 600 large 300 MW turbines dedicated to that. That's about 20% of the current US installed nameplate capacity or the amount of gas turbine capacity that has been installed since 1999.
But this has to work with a reasonable energy balance and cost...otherwise these sources are just bit players.
Interesting stuff, "getting more out of what we have already discovered" is a rather old problem, with ingenious answers but still doesn't solve the original problem.
What with the linking today of the Caspian to Chinese pipelines its more important than ever
I have been lurking around TOD for a long time now, reading the analytical and insightful work presented by Ace, Stuart, Prof Goose, Euan, Heading Out, and many others. It is about time I said thanks -
So thanks guys, for your time and effort. I don't know if it will make a difference for the world (I think it will), but I guarantee that it will make a difference for me and my family. My family goes into this period of time much better prepared than we would have been if it were not for your efforts!
Aeldric__ WOW!! Every once in a while a post comes along that makes you think it is not a waste of time to try to enlighten about peak. I was just thinking today that I admired Jeffrey and Alan and Ace and Stuart etc. for not letting up in the face of no seeming progress and then you came along. Thanks
Not so long ago I was an analyst by profession (now I am a Senior Chair-Warmer). A few years ago I put on my analyst hat and looked at the numbers that guys on this site have crunched.... then I went out and started preparing my family for a tough time. In the years since then I have continued to track this site - and revised my timeframes and preparations in line with the analysis presented.
I'm an optimist, so I am also working with friends in the energy industry on partial solutions. Of course, there are no real solutions (... at least none that I have the stomach for... we all know that the real solution is to cut Earth's population by a factor of around 5, then move the survivors onto renewable energy), so we are only looking at possibilities for partial mitigation.
I guess we all recognise that there are possible scenarios where the above-mentioned "real solution" may occur (or partially occur) in a Malthusian kind of way. The worst effects will (in my opinion) be felt in countries other than my own, but I believe that even in my locale your warning is timely, and has led to preparations that may greatly reduce the severity of this problem, benefiting many people (in my country and in others).
I am not alone. I can assure you that this site IS making a difference. People are reading it - lots of people.... and many of your readers are smart people with well-connected friends.
Anyhow, I owe this site a debt of gratitude, so I figured it was time to register and say "thanks". I will now go back to lurking.
Aeldric.
i dont see how anyone can look at figure 4 and conclude anything other than that we are either: at, near or past peak.
have we found our nanpu this week ?
i know, i know drilling the north pole will solve everything!!
I once saw a video clip of an interview with M. King Hubbert from the 1970s that looked like it was from public access TV. In the interview, Hubbert had a chart showing total oil global production. The x-axis was in geologic time, something like 5,000 BC to 5,000 AD.
Does anyone know where either this video or a reproduction of the chart can be found online? It is such a great reminder of the brief appearance of oil as an energy source in the life of our planet. It gives a great perspective on the steep rise up and the steep descent, even in the scale of human generations.
Thanks,
Colin
Austin, Texas
There's this one from
http://www.hubbertpeak.com/Rempel/
and this one from
http://www.franklin-grant.ru/ru/news2/data/news_04/2006_06/20060606_1719...
and here's a 1976 video of Hubbert showing the 5000 year chart
http://www.youtube.com/watch?v=ImV1voi41YY
here's the chart from a 1974 article by Hubbert
http://www.energybulletin.net/3845.html
Title "Fossil Fuels in Human History"
this chart actually plots fossil fuel production which includes oil production
I've put it this way:
During George Bush's first term, the world used about 10% of all the crude oil that has been consumed to date.
Based on Deffeyes' C+C HL plot, during George Bush's second term the world will use about 10% of all remaining conventional crude oil.
To a large degree what we are doing here is arguing over how fast the Titanic is sinking--while the vast majority of the world does not believe that we are sinking at all.
I understand what you're saying, but in fact I believe the "Vast Majority" is concerned solely with day to day survival and could care less about what is argued about or explained here.
The ability to think or act rationally about anything diminishes as confusion and desperation in dealing with ordinary day to day issues rises. Hence the increasingly strident voices being heard in the media and politics. It's my view that society as a whole is going insane at an increasing rate. The problem is that an insane society has no ability to diagnose itself, let alone provide a treatment. I'm not restricting this observation to the USA or any particular aggregation of countries or cultures. My sense is that it applies globally. Don't misunderstand me, many individuals can be, and obviously are, rational and as sane as anyone ever was, but in the aggregate we are not.
Hello TODers,
In regards to the upthread postings on utilizing the gascaps:
A sign of KSA desperation, or portent of change? I have no idea of the significance of this effort in the Rub-Al-Khali:
http://www.lukoil.com/press.asp?div_id=1&id=2661&year=2007
--------------------------
12.02.2007
LUKSAR DISCOVERED HYDROCARBONS IN SAUDI ARABIA
Followed the results of deep exploration drilling on Tukhman structure, Contract area Block A in the Kingdom of Saudi Arabia LUKSAR discovered hydrocarbon accumulations.
The Contract area is located in the northern part of Rub Al-Khali, south of Al-Ghawar, which is a major oil field not only in Saudi Arabia but also on a global level. Total area of the Block A is approximately 30,000 square kilometers.
Starting from the signing date and until drilling stage LUKSAR reprocessed more than 8,000 kilometers of vintage seismic data, conducted 755 square km 3D seismic, 1,700 km 2D seismic and 3,340 square km 3D-Sparse seismic acquisition works, and subsequently all obtained data were properly processed and successfully interpreted.
The first exploration well was spudded in January 2006, and it was drilled on a domed area of Tukhman structure, located in the central portion of the Contract area. TVD of this well is about 5,000 m.
At the present time LUKSAR begins detailed appraisal of the discovery to further evaluate the composition and potential of the said discovery which is expected in 2008.
----------------------------------
Unfortunately, I loaned out my copy of Simmons''Twilight', but I thought this area was previously explored and written off for its FF potential.
From an older article found googling, but with lots of graphs, tables, and text:
http://www.ogj.com/articles/save_screen.cfm?ARTICLE_ID=150293
----------------------------
The Gas Initiative and associated projects could create 32,000 jobs over the next 5-7 years. In addition to the $25 billion investment already expected, this initiative could generate an extra $100 billion in investment for related sectors and services, including energy, creating up to 1.6 million jobs in the next 30 years.
The critical activity period for down stream projects connected to the gas initiatives, and the time when the role of the energy services sector will be crucial, is 2003 and 2006. The initiative is not to explore, produce, and only export product; rather, it is to explore, produce, and utilize gas resources within the kingdom.
----------------------------------
What I found interesting is that they are pulling gas out of every subfield of Ghawar but Ain Dar [fighting water breakthrough?].
One last link:
http://www.us-sabc.org/custom/news/details.cfm?id=40
--------------------------------
Aramco Announces New Oil & Gas Discoveries
April 11, 2006-Aramco announced that three new oil and natural gas fields have been discovered close to Ghawar, the world’s largest deposit. Total finds include 33.15 million cubic feet per day (cf/d) of gas and 5,770 barrels per day (bpd) of crude oil. The first discovery was made at Jufayn-1 well, 14 km east of Ghawar, consisting of 28 million cf/d of gas and 400 bpd of condensates. A second discovery was made at Warid-1 well, 100 km west of Ghawar, consisting of 1.15 million cf/d of gas and 2,300 bpd of oil. The final discovery was made at Tukhman-2 well, 160 km from Ghawar, containing 4 million cf/d of gas and 3,470 bpd of oil.
-------------------
I have no idea if this helps the numerous debates on this thread.
Bob Shaw in Phx,Az Are Humans Smarter than Yeast?
"How the other half live":
http://energyshortage.blogspot.com/
The chart below might be of interest
click to enlarge
Saudi medium and heavy spot oil prices are plotted as a percentage of saudi light spot prices. The IEA 12 June 2007 Oil Market Report, page 15, implies that (see section 5 above) all of the 2.2 mbd spare capacity of Saudi Arabia is heavy sour crude which would have to be sold at substantial price discounts to attract buyers. It is assumed that IEA's use of "heavy" means both Saudi medium and Saudi heavy crudes. It is also assumed that when Saudi Arabia increases or maintains production levels, due to use of surplus capacity, the relative prices of its medium and heavy crudes must decrease.
Five time periods have been highlighted by five vertical bands, B1 through B5. The first four bands represent the time periods for the four biggest percentage discounts of heavy crude to light crude. Each band is discussed below.
B1
The USA invades Iraq causing Iraq's production to steeply fall. Saudi Arabia increases supply by about 1 mbd (million barrels/day). This increase is achieved by drawing on its surplus capacity of medium and heavy crudes which must be sold at a substantial discount to attract buyers. On April 11, 2003, Saudi heavy price was $US19.60/bbl, only 85.8% of Saudi light price of $US22.85/bbl. This is the same as discount of a huge 14.2%. Production reached 9.52 mbd.
B2
This time period coincides with the start up of new capacity from Qatif/Abu Safah. Saudi light prices reached very high levels of up to $US45/bbl at end of Oct 2004, relative to those in B1. Saudi heavy was selling at discounts of just over 20% relative to Saudi light prices. Saudi medium was also selling at big discounts. Although these discounts were high, Saudi Arabia reaped good profits by keeping production high. Once capacity from Qatif/Abu Safah came online, these discounts reduced.
B3
Saudi heavy showed a big discount here for only a month. I don't have an explanation - perhaps there was remedial action including infill drilling on North Ghawar and Shaybah? This required a reduction in Saudi light production rates which had to be offset by increases in heavy and medium crudes.
B4
This time period is interesting as it was just after the US hurricane season which shut in some US production and Saudi light prices reached almost $US60/bbl. Once again, heavy and medium crudes were discounted and volumes increased to maintain high production levels of 9.5 mbd.
Prior to B5
Saudi light prices were over $US70/bbl in Aug 2006. The US hurricane season had almost no effect on US production. The US economy showed signs of slowing. The weather in late 2006 was unusually warm. These factors indicated reduced demand for oil and the oil price started falling. In Oct 2006, Saudi light was under $US55/bbl.
Oct 2006 was a significant month as the relative prices of both Saudi medium and heavy broke above their averages shown by the dashed lines. This indicates a voluntary cut of a total 0.2 mbd from both heavy and medium crudes. Saudi light prices continued falling, during the warm winter, to below $US50/bbl in Jan 2007. Consequently, another voluntary cut of 0.2 mbd from both heavy and medium crudes occurred in Feb 2007. The medium and heavy crude prices remained firmly above their averages.
B5
Since Feb 2007, production has been maintained at 8.6 mbd. However, in Jul and Aug 2007 a small drop in the relative prices of medium and heavy crude has appeared. This probably indicates a small increase in medium and heavy production to offset declining Saudi light production.
Conclusion
What does all the above mean? Well, B2 and B4 indicate that Saudi Arabia was using substantial surplus medium and heavy capacity to take advantage of high oil prices. This, in turn, indicates that Saudi Arabia was probably producing at maximum capacity during B2 and B4.
The return to above average relative prices of medium and heavy crude since Oct 2006 indicates genuine surplus capacity, of medium and heavy crude, of 0.4 mbd. If hurricanes shut in some US production, Saudi Arabia may increase production back to 9 mbd, but only for a short time. This would require discounts on medium and heavy crude and bring the relative prices back to the average dashed horizontal lines.
Without additional expansion any idea what the absolute maximum rate that KSA could pump NOW is if they so wished? [they just bought a load of new rigs didn't they -I guess they have been deployed and connected by now]
Nick.