The Changing Oil Supply Perspective - Opening Lecture Class Note Changes
Posted by Heading Out on August 26, 2009 - 10:16am
It’s the start of a new Semester, and at the beginning of my Power class I spend the first lecture reviewing where I think we stand on the Energy supply to the United States. This has changed a bit since last year and so I thought I would run through some of the changes that I made to my lecture this year, in the same way as I did last September. Since the greatest impact is likely to come from the changing sources of supply that the US has had to go to, with the change in levels of production, I began with this slide:
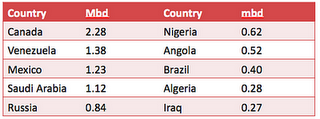
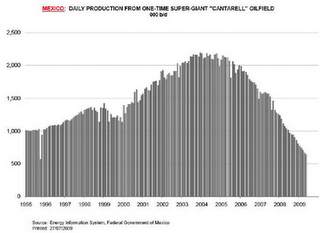
It is interesting to see the relative amounts from Mexico, Saudi Arabia and Russia and the first thing to note is the decline in Mexican supply, brought about by the dramatic drop in production from Cantarell. (H/t Nate Hagens).
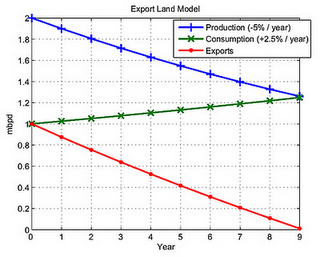
That drop has already shown up as a decline in Mexican exports to the US of over 800,000 bd. At this point I introduce them to the Export Land Model (ELM) of Jeffrey Brown, which basically points out that after a nation’s economy has grown (and oil consumption with it) during the high production years, then as oil production declines (as above) it is the export market which suffers more, as the country retains more of its product for its own use.
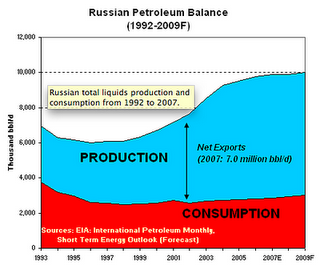
While Mexico is the most dramatic example of this at the moment, it is important to consider Russia next. We used not to get much oil from Russia, but as the table above shows, that situation is changing. (Russia to the Rescue was the theme of a made for TV movie Oil Storm back in June of 2005, where they sent us a couple of oil tankers which “saved the day”. At the time $75 a barrel for crude and $4 per gallon for gas was considered to only happen if the US was damaged by a hurricane and the Saudi terminal at Ras Tanura was attacked.) Well now they are sending more and regularly, but the question relative to the ELM is how long can they keep this up.
Exports from Russia dropped 5.2% in 2008, but have crept up some 0.2% since January, with Russia exporting about half its production. The big question about that, however, is that a pipeline is going in at the moment that will start shipping 300,000 bd of oil from Russia to China and to Japan. Given that overall Russian production is expected to decline (one of their major fields at Samotlor is now producing at 750,000 bd, when at peak it produced 3.2 mbd, and now that it is 80% depleted the water cut is 90%.)
So with increased amounts of internal consumption (it is using about 2.8 mbd internally), it is becoming another example of the ELM.
With both these countries exports declining, the question is becoming who will be the next to step in and provide additional oil for us. Saudi Arabia has dropped production to 8 mbd to keep the price up, and there are some questions about the future production – and I refer to the pictures from Satellite over the Desert that I have used before to question Saudi long term production ability. I also note that Saudi Arabia is now consuming 2.2 mbd of oil and demand is rising. There is, for example, this
Estimates on how much crude it is burning differ, but the kingdom's own data show it has risen in recent years, and it could be as high as 470,000 bpd of crude this year, up 62 percent from 2008, consultancy FACTS Global Energy says.
A Saudi source familiar with the kingdom's energy sector said the maximum it could burn at power stations would be 300,000 bpd, although another 120,000 bpd could be burned to power refineries and other facilities related to upstream production.
Aramco claim to have the capability of producing 12 mbd of oil, but again I remind the class that this includes the oil from Manifa, which cannot be produced until it can be refined and that won’t be until 2013 at the earliest.
And thus one comes to Canada, and so there is the quote from the Wicks Report that the Alberta oil sands will provide half of North America’s imports. The level of those imports is shown in the first table, and the oil sands are not now predicted to get to 2.7 mbd until somewhere around 2018, up from the current 1.3 mbd. So with the oil sands being the increasingly major supplier of oil to Canada as the conventional reservoirs deplete, it does not look as though Mr Wicks Report will prove realistic, and we will need to look elsewhere to make up supply shortages for ourselves.
At which point it is timely to point out that the UK will be competing with us for the remaining world supplies of oil, and that China and India, with their burgeoning car sales, will also be adding an mbd or so to their demands for oil next year.
The one bright hope that I end the oil section of the lecture with is that, with ethanol production at around 750,000 bd there is a new candidate supplier of jet fuel. The Japanese airliner that tested fuel this past winter used Camelina as the source for the jet fuel. It seems to have more going for it than corn or cellulosic based ethanol, at this point in the evaluation.
It is nice to end the section on an optimistic note, and the message from the above is that there are going to be jobs for the students when they graduate, and it will likely remain so for the length of their careers.
Contact
- Content: editors at theoildrum dot com
- Tech support: support at theoildrum dot com
License

This work is licensed under a Creative Commons Attribution-Share Alike 3.0 United States License.
Good stuff.
How does this analysis look if you include domestic production (which we all know if decreasing, but potentially not at the same rate as exports from, say, Mexico or Saudi)?
What is the expected total percentage drop in supply over the next five, ten years? What is the worst case scenario (i.e. no exports from Saudi, Russia, Venez)?
What are your thoughts on potential increased exports from Iraq over the next five, ten years? After all, we weren't there for the WMDs :)
It still appears (to this observer in the UK) that the US is better placed to tackle peak oil than almost any other developed nation for three reasons:
1. The US has (probably) the highest wasteful use of oil of any country on earth (per capita consumption vs quality of life), and can therefore reduce the 'froth' on top of their usage more easily that other nations (as uncomfortable as it may seem not to drive for a 2 mile journey and actually do what our bodies were made to do and walk)
2. There is still considerable domestic production, albeit falling, which can be put to the most urgent uses.
3. They are best placed (apart from Canada) to benefit from increased supply from the oil sands - 2.7Mbd by 2018 will be very welcome when oil is getting seriously scarce.
Thanks.
I get nervous about making predictions that go out any great length in time. (See the comments on the Oil Storm movie).
What I do in class, among other things, is to compare the two curves that Sam Foucher put up from the Megaproject update last September. The one at the top of the post assumes a decline rate of 4.5% - the more interesting one is down in comments where he replots the graph with a 5.2% decline rate. As you may have noted Fatih Birol just announced that the IEA now believe that it has increased to 6.7%. This is partly due to the increased percentage of wells that are drilled as horizontals, rather than vertical.
Domestically I don't see anything that is that encouraging, changing the culture so that folk walk more is difficult (I say this since I came to the US and adopted the habit of the car - just recently I had to stop driving for a while, and was glad to get back to the car - since a pleasant 3 mile stroll to and from home in a Missouri summer isn't always). From abroad we have to remember that if supplies get tighter then it becomes a much more competitive environment and the current culture battles in Iraq don't promise that becoming a more stable environment than say Nigeria.
Thanks.
That Canterell chart is pretty amazing - I wonder how much it is discussed/understood/digested in Mexico?
I doubt the people in Mexico know about Mexico's decline in oil production, any more than Americans know about the US decline in oil production.
I had the opportunity to meet one of the people in Pemex's organization, back in February, in conjunction with the EIA conference in Washington. This individual was involved with planning, but had a background in field work. He said Pemex had two sets of forecasts--published forecasts, and what they really believed. He said the Pemex individual who spoke at the EIA conference (not the person I talked to) gave the official numbers, not what the company was really expecting.
So Pemex certainly knows what is happening, whether or not it shows up in official forecasts.
Charts and or graphs of mexican production are seldom published in mexican mass media. I have not seen the phrase "pico de producción petrolera" used in mexican newspapers or media. You can do a google search and corrobarate this. My blog has kept track of it but i'm about the only guy consistently talking about it in México.
http://Economanias.blogspot.com
To be fair, I suspect that even in the UK, the majority of people on the street would say that the UK is a net oil exporter if asked. It's not one of those things that the media/government trumpets..
Actually I reckon that most people in the UK would not only be blissfully unaware that we even have oil, let alone where the 'stuff they put in their cars' comes from. They might have some vague notion that it has something to do with deserts and Arabians but that will be the extent of their knowledge.
And only a very, very small number would have any appreciation of the role oil/gas has to play in their lives thanks to the petrochem industry.
When ever prices at the pumps jump there is the routine interview of the 'disgusted' motorist on the evening news. They always spit that they 'think the government is to blame and that the oil companies are too greedy'.
You see, access to cheap and plentiful petrol is their RIGHT don't you know. Just like turning on the light switch or buying food in the supermarket.
It isn't just oil -- one day, a while ago on a stroll along the river walk in Portland, OR, I just asked other strollers whether the river we were walking along was the Columbia. (It is the Willamette, of course, which runs into the Columbia.) Most of them were unable to answer correctly. Maybe it was a just a bad day, but I think public ignorance of almost all useful facts that make up "common sense" is essentially boundless.
But since people are brought up to do whatever the TV tells them, knowledge is inconvenient-- even maladaptive.
I guess it would help if Gerry Springer or Oprah would get interested...
Normally it is called "cenit del petroleo"
Thx. for the post ... looks like an interesting class ... just a few notes to add to your lecture:
>the world currently consumes 80+million boe/d, which works out (rounding things off) to about a billion boe every 12 days ... so ask yourself, 'How often do you see announcements of billion barrel + discoveries?' ... yes, we are still finding stuff, and yes, our recovery technology is constantly improving, and yes, it is possible to extract more oil from existing fields at higher prices, but the inevitable conclusion we are forced to is that we are overwhelmingly consuming previously discovered fields ... demand is exceeding supply on an ongoing basis
>oil field production suffers from natural decline rates, which, depending on whom is talking and which data they are referencing, seem to be in the 4%-8%/yr. range ... doesn't seem too bad, but think what the numbers mean ... a 4% global decline rate means we have to discover a little over 3 million boe/d of production each and every day of the year, and that is a wow! number
>it is in no one's best interest for China & India to be filled with poor people ... they are moving towards a 'middle-class' economy as rapidly as they can, and that is to their, and our, benefit ... they have cracked the door on the BMW and smelled the leather, and nobody is ever going to be allowed to close that door on them again
>assume best case that the OECD goes flat-line, or slight decline, on oil demand ... this allows Chindia to ramp up their economy & boe/d demand ... however, the mechanism that this works thru is price discovery
>price must go up, demand must be destroyed ... our transportation is completely centred on oil and that must change ... we are in for a lot of change over the next 20 yrs.
>the Chinese character for chaos is the same as the character for opportunity ... may you live in interesting times
>j.
for a 2 mile journey and actually do what our bodies were made to do and walk)
For a two mile journey, our bodies were made to bicycle :-)
Alan
I walk almost 2 miles each day to work, and the same distance back home again. Takes a little longer than by bicycle, but better exercise, safer, and more time to clear the mind.
Nonsense. Two miles are meant for the SUV. Let the animals walk or swim. We have oil.
;)
A colleague of mine died in a bike accident this summer, and my Chancellor suffered a torn rotator cuff when he fell off his bike this summer - thanks this no-longer-athletic individual prefers to walk. (I ride a stationary bike for exercise)
Hook it up to a generator and make your own power.
http://www.youtube.com/watch?v=mgRFPpZGx8Y
Yes! Then connect it to the power grid and sell the peddle power electricity back to your local power company - $0.01/hour if you're lucky! Of course That's about 500 calories/hour for food, so you'll have to find a way to buy cheap food!
I know quite a few people who have died in car accidents, including one pedestrian standing on the sidewalk, and dozens more with permanent, life altering injuries.
Two statistics on bicycling. Those that bicycle to work live 10 years longer than those that drive. +12 years due to improved cardio-vascular health, reduced diabetes, etc. and -2 years due to accidents for a net of ten years (ignoring the months).
The other is that as bicycling increases in a community, the # of bicycling fatalities stays flat or goes down. The per capita risk drops at least proportionately to the popularity of bicycling.
Bicycling has increased dramatically in New Orleans post-Katrina (one or two pass my corner every few minutes, night and day), yet we have had fewer bicyclists killed than before Katrina (need to confirm statistic, this was told to me by local bike engineer at Public Works).
Best Hopes for More Bicycling,
Alan
UK still bicycles less than it used to.
Children and cyclists most at risk (and elderly pedestrians) especially in 'deprived areas'.
From UK Department http://www.nao.org.uk/publications/0809/improving_road_safety_for_ped.aspx
Tame the cars - and get them off the roads and we cyclists and pedestrians are much safer :)
Phil
aging risk-taker hit from behind by car in Edinburgh 13y ago
Alan is right. People tend to over-estimate the risk from bike accidents and to under-estimate the health benefits.
A study in Denmark found that those who bicycle to work have 39% lower all-cause mortality. That's huge. (Google "Andersen bicycle mortality" and select the NIH link.)
Three key observations regarding the ELM and several case histories, once production peaks in an oil exporting country: (1) The Net Export decline rate tends to exceed the production decline rate; (2) The Net Export decline rate tends to accelerate with time and (3) Net Export declines are front-end loaded, with the bulk of post-peak Net Oil Exports (NOE) being shipped early in the decline phase, e.g., Indonesia shipped 44% of their post-peak Cumulative Net Oil Exports (CNOE) in just the first two years after their final production peak in 1996.
The 2006-2008 (inclusive) CNOE from the (2005) top five net oil exporters (Saudi Arabia, Russia, Norway, Iran & UAE) were about 25 Gb based on EIA data. This falls between Sam's middle case and high case for 2096-2008 CNOE for the top five. His middle case for total post-2005 CNOE for the top five is 90 Gb; the high case is 144 Gb. Let's assume, based on current data, that the most likely case is about 117 Gb. So, in round numbers it appears likely that the (2005) top five net oil exporters--accounting for about half of world NOE--shipped about one-fifth of their post-2005 CNOE in just the first three years after their apparent final (collective) net export peak in 2005.
Operating costs increased to $50.23 per barrel in the second quarter of 2009, up $8.31 per barrel from the same quarter of 2008.
Year-to-date operating costs were $43.66 per barrel in 2009 versus $38.90 per barrel in 2008.
http://www.oilvoice.com/n/Canadian_Oil_Sands_Trust_Announces_2009_Second...
Perhaps you could add a table showing the increasing cost: production ratio and speculate as to when this will be too high for the USA to do anything but nationalise Canada ;¬)
Your students working oil sands may be being paid in Canadian dollars in the same way the Scots print their own money.
The Scots don't really 'print' their own money. The Bank of Scotland, Royal Bank of Scotland and Clydesdale Bank are licensed by the Bank of England to issue their own branded notes but as a sub-set of the total paper sterling currency that the Royal Mint issues. ditto with Northern Ireland notes as well (Bank of Ireland, Ulster Bank, First Trust, Northern Bank).
That was the meaning I aimed to convey...
I like to assume my readers are on the same level as me or if not can use wiki like me.
Canada would like nothing better than sell its output elsewhere. They are working on transporting oil products to the west coast by rail, so they can be sent to China and the Far East.
http://network.nationalpost.com/np/blogs/francis/archive/2009/04/09/cn-s...
http://network.nationalpost.com/np/blogs/francis/archive/2009/04/15/oils...
Gail and everyone,
Enbridge is busy building and/or advance planning for the "Northern Gateway Pipeline" from Edmonton to Kitimat in BC.
http://www.northerngateway.ca
It will have a large capacity and its target market is China. It is about 700 miles closer than Vancouver (small pipeline there already). The Chinese already have significant investment in the Oil Sands (e.g. Husky Oil and Meg Energy, etc.).
Pipelines are of course massively more efficient to transport even viscous oil than railcars.
I sincerely doubt that the Oil Sands will be producing (let alone exporting!!) 2.7 million barrels per day by 2018. There has been a huge decline in investment in the last year and Oil Sands projects are among the most capital intensive projects in the world. It is not just the water shortage problem (they are making gradual and steady improvements there), nor even the availability of natural gas (there is a process for producing natural gas-methane from the left-over carbon from upgrading the oil sands, e.g. Nexen), but rather the availability of capital. Which you know a lot about.
I was shocked by the relatively low overall export levels of Canada (importing from Venuezuala and exporting the oil sands to the US). That would have to change (how could it?) if Canada is going to export more to the US.
Hope that this helps,
Ian
Gail and Ian
Thanks I look forward to Part 2.
Yes, retro rail seem a little unlikely and the way it is framed in the articles kindly supplied by Gail it seems a token / political gesture.
As the articles mention local transport to terminals is required for either method.
Is the problem the cost of pipeline rental / indirect taxation through US territory that seems more likely.
I have noticed N. Americans seem coy with elephants in the room ;¬)
No special market knowledge just a commited perpetual and fairly poor student.
Until quite recently, all Chinese imports of oil from Siberia and Central Asia (Kazakhstan, etc.) were by rail (DESPITE the change in gauge !), and rail imports continue in parallel with pipelines.
So rail export is certainly not out of the question, but pipelines use (very roughly) 1/3rd the energy.
Alan
Dag,
Right now the major method to transport highly viscous bitumen with API = 8(from the Oil Sands) to market via pipeline from Canada requires the addition of a low viscosity diluent (e.g. naptha, API = 26-34???) to bring the combined liquid up to pipeline viscosity specifications (e.g. API >16??). The source of that low molecular weight, hydrogen rich, expensive diluent has traditionally been to a large degree from the refineries south of the Canadian border (e.g. Chicago area). Large investments in Canadian refining capacity have not really been made BUT the synthetic crude from Syncrude and Suncor, etc., which uses hydrogen derived from natural gas to upgrade the bitumen from its natural (high molecular weight) API of 8 to around 26-32 which is more than adequate to be pumped by pipeline. So as the proportion of synthetic crude oil is increased and local "refining" capacity increases, Canada becomes more independent in terms of its ability to export crude by pipeline without the need for US refining capacity. Note that the value add in dollars is also significant. Raw bitumen sells for a discount of as much as 50% (or more) relative to synthetic crude. Adding that hydrogen (from natural gas) really improves the profitability for the sale of the product AND the volume of the resultant synthetic crude is GREATER than the volume of the bitumen that it replaces (less dense). To put it another way, they are really "selling the hydrogen" (or the liquid fuel premium for a light hydrocarbon is greater than a heavy large hydrocarbon with lots of carbon).
There are literally mountains of discarded carbon from bitumen upgrading. AFter cracking of the bitumen, the lighter fractions are upgraded and sold as synthetic crude, but the petroleum coke (waste carbon) which is somewhat similar to coal with LOTS AND LOTS of sulphur in it (about 7-8% by weight) is usually discarded. There are buried mountains of pet coke buried in Alberta near the oil sands plants. I'll wager that the Syncrude tour that Gail took did not feature a tour of the pet coke burial sites!!! That pet coke also contains lots of metals, including nickel and vanadium. It is a truly terrible terrible fuel.
Hope that this helps you,
Ian
P.S. I wouldn't be surprised that the energy ratio calculations that SYncrude gave to Gail did NOT include the loss of all that net energy from the loss of the natural gas used to upgrade the bitumen to synthetic crude, but I hope I am wrong!!
The plan is to import the dilutent from the East - FSU, one presumes. Kitimat is also a VLCC port; this is of concern to me since, living in Oregon, PADD 5 imports have been on the rise and the primary source for Washington state refineries has been the North Slope; consumption in Washington increased 31% from 2003 to 2007; if production in Alberta was curtailed enough we'd have to fall back on increased overseas imports, and Puget Sound is only rated for
The plan is to import the dilutent from the East - FSU, one presumes. Kitimat is also a VLCC port; this is of concern to me since, living in Oregon, PADD 5 imports have been on the rise and the primary source for Washington state refineries has been the North Slope; consumption in Washington increased 31% from 2003 to 2007; if production in Alberta was curtailed enough we'd have to fall back on increased overseas imports, and Puget Sound is only rated for tankers smaller than Suezmax. Supplies could become extra tight and turn into shortages in the Pacific NW soon if things became too lopsided; our other sources are product pipelines coming in from Montana and Utah. PADD 5 is to a large degree isolated from the rest of the country, who have fallback options we don't, especially outside of California, who can handle VLCCs at the port of Long Beach - although they face constraints of their own.
Ian, AfBE and Dude:
It is fascinating stuff my inadequate picture of the world just got a bit clearer.
Which for me is as good as sausages to a Scotsman and as they say "sausages are the boys".
Thanks.
Now, if you could come up with a process to burn the coke, sequester the CO2, convert the Sulphur to sulphuric acid for sale and extract the heavy metals in sale able form, you'd be on to something, especially if you could sell electricity back to the oil sands operators at the same time..
LOL. I think some of the sulphur is being made into fertilizer, but there are mountains of it unsold.
Ian,
Thanks for the tips on the waste coke and above on the Northern Gateway Pipeline.
You are right about not seeing the mountains of waste coke. I didn't really figure out where the waste metals were going, but in a way I would rather have them bound up with the waste coke than in the tailings ponds. I knew there were metals in the oil sands originally. If they are bound as well now as they were in the past, we are probably in good shape.
It seems like the EROI calculations are based on energy in -- energy out. If some of the coal sands material ends up buried back beneath the new vegetation, that is neither here nor there, as long as it is deep enough or well enough bound that the new plants are not affected by the higher level of metals. The energy in would be purchased natural gas, diesel and gasoline. The energy out would be SCO. So I think the calculation would reflect things fully.
Gail,
Happy to put in my two cents worth anytime. What do you think about the current capital crunch as it applies to the Oil Sands? The other issues are solvable (even the use of that poor quality fuel ==> pet coke). Check out a small company in Chicago and Massachusetts (Great Point Energy). Their coal (and pet coke) gasification process captures the metals and sulfur and it is supposed to be the best coal gasification process available. I am pretty certain that the CO2 is released (or can be)or captured. They produce methane in a double water shift reaction: C + H20 ==> CO + H2; 4CO + 2H20 ==> CH4 + 3CO2. It is the so-called "Blue gas"
http://www.greatpointenergy.com
Given my skepticism about CO2 being a net detriment to mankind, coal (and pet-coke) gasification is a likely alternative. The good news is that there is LOTS of carbon in the Oil sands!!
Ian
Apparently the capital costs are a lot lower on non-mining than mining. CERA quotes capital costs of $126,000 per flowing barrel for mining including upgrader and $30,000 for SAGD, at the height of costs. Download free report here. See PDF page 28.
I think the economy's inability to maintain a high enough oil price to justify the cost of investment will be a major obstacle. Even if SAGD is cheaper up front, its full cost are quite high, even apart from the problem of finding the funds to invest.
Also, taxation right now in Canada is low. Surmont told us they are paying 3% in royalties, because they have not yet recouped their capital investment. It seems like there is going to be pressure to get more money from the companies as royalties, and this too will operate as a downward force on production. Federal government in particular wants more control--may be less kind to oil companies than Alberta.
So between finding investment $, high enough price, and taxation issues, it seems like there are a lot of barriers to a big ramp up in production (besides natural gas, water, diluent/heating).
Macro economics must be playing a role here banks are holding onto capital and if I were a cash rich billionaire it would be going into gold and top quality land in stable Western countries even at a loss.
Buying up existing resources on EROEI i.e. minimum cash flow required to maintain value.
It looks to me like we have just started a cycle of capital destroying oil shocks.
Previously you might risk a punt with future growth to reduce the risk using high gearing.
Now less gearing is available and the risks are higher.
Oil sands offer lowest returns for highest risk of capital destruction, nationalisation by the USA or Canada might be cheaper than a modern war until life becomes cheap for us also.
Rather like Dimitri Orlov's fairly recent blog post I am waiting for aliens to invest;¬)
One thing I noticed in your report is the 2 million bpd discrepancy between what
1. EIA calculates Russia is exporting, based on their view of Russian consumption, and
2. What Rosstat says they are exporting. The linked report says
According to EIA, Russia is producing about 9.4 million barrels of crude oil a day, through May. Assuming the Rosstat percentages, if Russia exports 50.7% of it, they are exporting 4.8 million barrels a day, and consuming 4.6 million barrels a day. This isn't what EIA is saying, in its graph and in its numbers.
If one looks at Russian EIA Energy Profile, it shows estimated consumption of 2.9 million bpd in 2008, with no number shown for 2009 yet.
This is a huge discrepancy in Russian oil consumption for such a small number (4.6 million bpd from Rosstat vs 2.9 million bpd based on EIA). Do we really have good information about Russia consumption / exports? Is the Rosstat report just wrong, for example? Or does EIA have any real idea about what the number are?
Of course, you need to make sure that you are comparing apples to apples. For net oil export calculations, we have to use Total Liquids. Here is what the EIA shows for Russia in 2008, along with their rate of change relative to 2007:
Production: 9.8 mbpd (-0.9%/year)
Consumption: 2.9 mbpd (+2.8%/year)
Net Oil Exports: 6.9 mbpd (-2.4/%year)
The really stunning number for 2009 is going to be the decline in Russian natural gas exports. Obviously lower demand is a factor, but what is odd is that Norway has shown no export decline year over year, at least based on recent monthly data
I'm sure I didn't get apples to apples, but I think the change makes the comparison worse, not better.
My question still stands-do we have good consumption numbers for Russia, or are they just guesses?
I noticed some of that, but it is going to take me a little time to track all the numbers - you get current Russian production here and I haven't had time to go back and see how that trend is going. (Note you multiply by 7.3 to convert tons to barrels).
(Unfortunately it does not show what happens once it is produced.
Here's the reddit links for this post (we appreciate your helping us spread our work around, both in this post and any of our other work--if you want to submit something yourself to another site, etc., that isn't already here--feel free, just leave it as a reply to this comment, please so folks can find it.):
http://www.reddit.com/r/collapse/comments/9ecvv/the_changing_oil_supply_...
http://www.reddit.com/r/energy/comments/9ecvo/the_changing_oil_supply_pe...
http://www.reddit.com/r/environment/comments/9ecvq/the_changing_oil_supp...
http://www.reddit.com/r/science/comments/9ecvu/the_changing_oil_supply_p...
Find us on twitter:
http://twitter.com/theoildrum
http://friendfeed.com/theoildrum
Find us on facebook and linkedin as well:
http://www.facebook.com/group.php?gid=14778313964
http://www.linkedin.com/groups?gid=138274&trk=hb_side_g
Thanks again. Feel free to submit things yourself using the share this button on our articles as well to places like stumbleupon, metafilter, or other link farms yourself--we appreciate it!
Exports from Russia dropped 5.2% in 2008
My summary is:
http://tonto.eia.doe.gov/country/country_time_series.cfm?fips=RS
Just wondering how you got -5.2% ? IEA data ?
Not yet submitted to what COULD be (low probability) an important breakthrough.
Alan
Alan:
I read a fair number of different articles in putting together the material, so I can't be certain, but I think the source might have been this one though that only deals with the first half of 2008 and I thought I had a source for the whole year, I'll keep looking.
Dave
How can you call the growing of oil seed crops - be they camelina, canola, sunflowers, or what have you - a "bright hope" as a source of jet fuel? Is jetting around the world more important to you than eating? Would you rather see the rich elite of the developed world be able to travel by jet than see the masses living in poverty have something to eat?
it would be interesting to know how many hectares would be needed to supply the entire world's aviation fuel consumption for a year..
Camelina is interesting since a) it can be grown on land that is unsuitable for conventional crops and b) when it is grown in rotation with wheat it will increase the wheat production in the following cycle.
Some of us actually do try and find crops that don't get involved in the "food or fuel" debate - the underground growth of algae being one such route that we've done some work with.
The use of aircraft is an integral part of today's society - I have always felt that part of my job was to help sustain society, rather than destroy it, but then others may disagree on some of the solutions we have worked to produce.
""The use of aircraft is an integral part of today's society - I have always felt that part of my job was to help sustain society, rather than destroy it, ""
Is this another way of saying...Business As Usual? One knows, this "part of today's society", will not hold for long. As will nothing of the BAU that presently exists. Yet one promotes it? Is this not a intellectually dishonest way for one to make a living?
When one is a teacher of the weaker minds, is it not correct to point the weak to the right path? Yes?
You obviously can't even concieve of the possibility that "the weaker mind" might be your own. You would do better to reflect a little on the possibility, however remote you might consider it, of Heading Out being somewhat more capable than yourself. That's certainly my opinion, but then I've only seen a very small amount of your published work.
Excellent.
As the Twig is bent......
The act of jetting all over the world, for whatever cause that pops into someones head, can be justified by those who know of no other way to live. The obscene consumption of the US, taught to the youth every day in the classroom, by the supposedly educated among us, will soon be coming to an end. But I'm sure the intellectual elites feel free to burn every last drop on the way down.
There is a better way. Yes?
Where I live camelina is grown under center-pivot irrigation, in rotation with other crops including wheat but primarily with alfalfa. Saying that it can be grown on marginal land or on "land that is unsuitable for conventional crops" typically translates as land that is highly erodible, has unsuitable edaphic conditions, or is otherwise unsuitable for cultivation, period. Whenever crops are grown for fuel it invariably involves the "food for fuel" debate, since the labor, diesel fuel, water, land, fertilizer, etc., that goes into growing crops for fuel could have been invested in staple food crops. Promoting the growing of crops for fuel does not "help sustain society." It causes people to go hungry, rather. You may say that "the use of aircraft is an intergral part of today's society" but I haven't flown in years and never intend to do so again in my life. If you are sincerely concerned with sustaining society you could make the same commitment and forget about the truly misanthropic idea of growing crops for fuel that only a privileged elite can afford.
Umm, camelina IS a food.
Of course it is, or should be. The point is that people can't simultaneously eat it & burn it in jet engines. We can live without flying machines. We can't live without food. What misanthrope would prefer to fly around the world in aircraft fueled with food while a billion people are malnourished and many millions starve?
Al Gore?
http://www.youtube.com/watch?v=2VV309lbB8c
The practice of rotating an oilseed crop with a cereal seems to be petroleum dependent. The oilseed stubble is grazed by animals then plowed in using petro diesel. Any later regrowth is arrested with a knockdown herbicide made from petroleum based chemicals. Then the cereal is planted using petro diesel machinery and nitrogen fertiliser (albeit less) made from natural gas. Both the oilseed and the cereal need harvesting with different kinds of machines, again petro diesel powered.
Try doing all that with just oilseed biodiesel then having a surplus to make jet fuel.
Good going! Say, since you have students, would you survey them on the Export Land Model name? I've become convinced that the name itself obscures more than it conveys, and have proposed two alternative names for the thing, which really should be much better known and understood:
The OPEC curve -- oil producers' exports contraction curve
The OECD curve -- oil exports continuous decline curve
I call "Export Land Model" one of those "clear only if known" terms -- that is, it's a name that only says something to someone who already knows what it says. I believe that reaching beyond the choir requires us to avoid COIK terms and to adopt terms that are, as much as possible, effective at reaching beyond the already-aware.
Or just call it Net Export Math.
Speaking of OECD countries. In response to oil prices increasing at +20%/year from 1998 to 2008, US consumption in 2008 was back to the same level as 1999 (19.5 mbpd). I thought that I would take a look at changes in consumption for the other top 15 consumers (based on 2007 data) over the same time frame. The top 15 account for about 70% of total petroleum consumption.
Six countries showed flat to lower consumption from 1999 to 2008 (EIA). All six of them are OECD countries: US; Japan; Germany; France; UK and Italy. Their combined consumption fell slightly from 33.6 mbpd to 32.2 mbpd (-0.5%/year), volumetrically down by 1.4 mbpd.
Nine countries showed rising consumption from 1999 to 2008. Six of them were non-OECD countries. Of the three OECD countries, the only non-oil exporter in the group was South Korea. The rising consumption countries were: China; Russia; India; Brazil; Saudi Arabia; Iran; Canada; Mexico and South Korea. Their combined consumption rose from 19.8 mbpd to 27.0 mbpd (+3.4%/year), volumetrically up by 7.2 mbpd. The non-OECD countries accounted for most of the increase, 6.7 mbpd (from 13.7 mbpd to 20.4 mbpd).
In any case, the top non-OECD oil consuming countries showed a +4.4%/year rate of increase in oil consumption from 1999 to 2008, in response to oil prices increasing at about +20%/year.
Camelina sounds like a good subject for a separate post. RR, are you interested?
Is it water insoluble? What is the empirical yield? Any special refining difficulties? Can it also produce a diesel substitute for trucks and ships? How would it scale? The link sounds like good information, but Biofuel Digest is obviously an advocacy publication.
In a logical crop rotation with wheat, would camelina take the place of a food crop legume such as alfalfa or soy beans?
You are right--a full post on it would be good. There are a couple of paragraphs on it in this post by Heading Out, but not really very much.
The export number for México (1.23Mbd) is not a net export number. México imported 472,000 b/d of finished products in that period sinceits own refineries do not have the capacity to process all the crude it needs to vonvert into gasoline and diesel.
That makes net Mexican oil exports almost exactly equal to the production from Cantarell.
KUDOS for trying in Mexico !
Best Hopes,
Alan
There is also the issue that Mexican laws require low sulphur fuel, especially near the border where US trucks are refueling. I have heard Mexican refineries are not set up for that.
HO, I'm not sure Mexico is really a poster child for ELM - for ELM to make sense, you'd have to have internal consumption rise faster than elsewhere in the world. Mexican oil consumption fell in 2008 (even while world consumption/production was increasing) according to this: http://tonto.eia.doe.gov/country/country_energy_data.cfm?fips=MX
Mexico maintains gasoline prices at world levels, which means that it's consumers aren't shielded by subsidies. That means that there's no relationship between the fact that it's an exporter and the level of internal consumption, a relationship required by ELM.
Nick:
The problem of expecting countries to exactly follow the ELM is that there is always going to be some form of geopolitical event that can bring additional factors into consideration and in Mexico's case one has to recognize that the recent and ongoing global recession has had impacts on the global economy, which affects individual country demand. Thus one has to look at a slightly longer term trend than usual - but I do accept the correction.
one has to look at a slightly longer term trend than usual
Well, there's no question that Mexico's consumption was rising before 2008. OTOH, that was true for most countries, especially the middle income countries like Mexico.
The question is, what does the ELM model add to the analysis?
If there's no relationship between the fact that Mexico is an exporter and the level of it's oil consumption, then I don't see any additional information from the ELM model.
Sure, Mexico's production and exports are falling - how does the ELM model give a more useful picture than just factoring that decline into a world model?
----------
It seems to me that ELM is capturing, in a crude way, the fact that most oil exporters shield their consumers from world prices.
However, not all exporters shield their consumers (e.g., Mexico), while some importers do (China, etc).
A much more useful model would be to look at all countries that subsidize oil/fuel prices, and look at the behavior of their consumption. That would give a far more granular, precise analysis of the past. It would also give a far better prediction of the future, because you could explicitly include the effect of declining levels of subsidies*.
*Declining subsidies would be very likely due to budgetary issues, rising trade deficits and declining trade surpluses.
While it's true that Mexico's consumption fell in 2008, at a rate of -0.5%/year, relative to 2007, their 2004 to 2008 rate of increase in consumption was +1.6%/year, versus a -4.7%/year rate of decline in production, resulting in a 2004 to 2008 net export decline rate of -13.5%/year.
In any case, I proposed the ELM as a way to understand Net Export Math. For example, if we assume no increase in consumption, "Export Land" would go to zero net oil exports in 14 years, instead of 9 years, not exactly a big difference. The three factors that affect net export declines are (1) Consumption as a percentage of production at final peak; (2) The rate of change in production and (3) The rate of change in consumption.
What the model and various case histories show is that Net Oil Exports (NOE) tend to decline at a rate faster than production declines, the NOE decline rate tends to accelerate with time, and the bulk of post-peak cumulative NOE are shipped early in the decline phase.
The key question to ask is the following: Are there any examples of net oil exporters experiencing a production decline where the net export decline rate is less than the production decline rate? After looking at 21 case histories (one with increasing production, 20 with lower production), I have not found any:
Four Former Net Oil Exporters
Production & Net Export Increases/Declines Per Year, Over the Referenced Time Frame, Are Respectively Shown (EIA, Total Liquids)
China (1985-1992)
+1.8%/year (Prod.) & -16.9%/year (Net Oil Exports)
Indonesia (1996-2003)
-3.9%/year & -28.9%/year
UK (1999-2005)
-7.8%/year & -55.7%/year
Egypt (1999-2006)
-3.8%/year & -37.1%/year
And here are the initial (first year of the decline) and final (last year before net oil importer status) year over year Net Oil Export Decline rates for the four former Net Oil Exporters:
China
-5.5%/year (Initial) & -57.3%/year (Final)
Indonesia
-16.0%/year & -69.3%/year
UK
-38%/year & -237%/year
Egypt
-8.6%/year & -100%/year
17 Net Oil Exporters Showing Production Declines
Production & Net Export Declines Per Year, Over the Referenced Time Frame, Are Respectively Shown (EIA, Total Liquids)
Saudi Arabia (2005-2008)
-1.0%/year (Prod.) & -2.7%/year (Net Oil Exports)
Russia (2007-2008)
-0.9%year & -2.4%/year
Norway (2001-2008)
-4.7%/year & -5.1%/year
Iran (2005-2008)
-0.5%/year & -3.4%/year
Nigeria (2005-2008)
-6.4%/year & -6.9%/year
Venezuela (1997-2008)
-2.6%/year & -4.5%/year
Mexico (2004-2008)
-4.7%/year & -13.5%/year
Colombia (1999-2008)
-3.6%/year & -8.3%/year
Oman (2000-2008)
-3.1%/year & -4.4%/year
Malaysia (2004-2008)
-4.2%/year & -16.8%/year
Syria (1996-2008)
-2.4%/year & -5.5%/year
Vietnam (2004-2008)
-3.5%/year & -46.0%/year
Denmark (2004-2008)
-7.6%/year & -16.4%/year
Yemen (2001-2008)
-5.4%/year & -11.5%/year
Ecuador (2005-2008)
-1.7%/year & -4.4%/year
Gabon (1997-2008)
-3.7%/year & -3.8%/year
Equatorial Guinea (2005-2008)
-1.45%/year & -1.46%/year
What the model and various case histories show is that Net Oil Exports (NOE) tend to decline at a rate faster than production declines, the NOE decline rate tends to accelerate with time, and the bulk of post-peak cumulative NOE are shipped early in the decline phase.
No question. But, why is this important? What does the model add, vs a world model? If a country is exporting 100K of oil one year, and 90K the next, 10K has been lost to the world. If the country's consumption changes at the same rate as the rest of the world, then the ELM model doesn't add anything.
Let's say the whole world (including this country) is maintaining level consumption rates. If this country consumes 80k, then they just lost 50% of their exports. But, who cares, except for people in that country, who might care about internal matters such as disappearing trade surpluses? What matters is the fact that 10k has been lost to the world, and that's the same for the ELM model or a world model.
The ELM assumes a tight linkage between exports and consumption which doesn't exist. Some exporters control prices and subsidize consumers, and some don't. Some importers control prices and subsidize consumers.
ELM suggests hoarding, but I'm not aware of any direct controls or attempts to limit exports. Rather, exporting countries tend to have the apparent luxury of protecting their consumers from the harsh realities of the marketplace. That's very different, and it's important to keep in mind that 1) such practices are counter-productive for the exporting country's self-interest, and 2) will face pressures that will tend to erode these consumer "protections".
at the beginning of my Power class I spend the first lecture reviewing where I think we stand on the Energy supply to the United States.
The info presented here is just about oil. Shouldn't a discussion of "Energy supply" cover more than oil?
After all, it's only 40% of US energy supply, and the part that's most clearly shrinking (i.e., not the future).