Petroleum Demand Lessons from the Late 1970s
Posted by Gail the Actuary on March 19, 2010 - 10:36am
This is a guest post by Kevin Rietmann, known as KLR on The Oil Drum.

A collapse in demand for petroleum products happened in the late 1970s and early 1980s. JD, proprietor of the blog Peak Oil Debunked, examined this briefly in this 2007 post about what he termed ”The Big Glitch”:
So what really does happen when global oil production drops by 15%? Well, it turns out we know the answer to that one because it actually happened once before, in the early 1980's. Production hit a high of 66mbd in 1979, and over the course of 4 years dropped by 14% to 56.6mbd in 1983. In fact, oil production didn't surpass the 1979 high until 1993, 14 years later.
So what did the world look like in 1983, after oil production had collapsed by 15%? I'll tell you what. Go out to your local freeway, and look at it during rush hour, when it's totally crammed with cars. That's exactly what 1983 looked like. I was gassing up as usual, totally oblivious. The "crisis" had such a minor impact on daily life, that I didn't even realize anything out of the ordinary was happening, let alone a liquid fuels armageddon that was wholly shattering the oil dependent economy and reducing the citizenry to poverty. I could be wrong about this, but I'm pretty sure that no one was forced by starvation to eat their Flock of Seagulls albums.
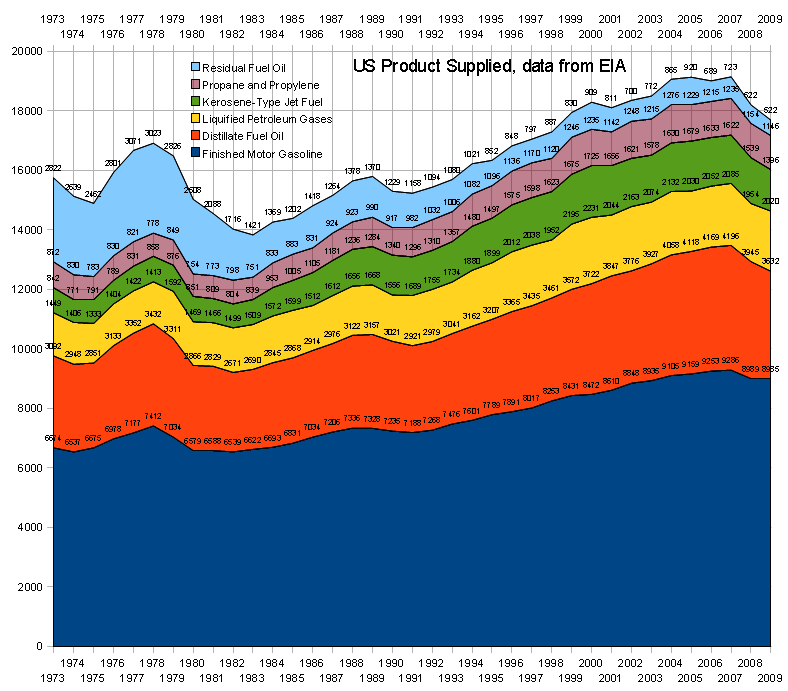
As it happens, demand for petroleum has gone down in the wake of JD's rant; how does it compare to the shortfall of 3 decades ago? This post will examine what happened in the late 70s to demand for the various petroleum products, and compare their rate of downturn to what has transpired since their corresponding recent peaks. This will be about US demand, using EIA data, as it is by far the most comprehensive to be had. The general situation in other regions of the world will be covered briefly at the end.
CERA's Current View of Peak Demand
To move from bloggers to think tanks, CERA made their first pronouncement about US peak demand on June 19, 2008, claiming that a long-term shift in consumer behavior, spurred on by increased penetration of the market by higher efficiency vehicles and higher volumes of biofuels displacing petroleum products, would mean 2007 would be the all time high for US gasoline demand. As it happens, 2008 and 2009 average volumes of gasoline supplied were at 96.80% and 96.75% of the 2007 value, so this initial forecast isn't exactly playing out. A year after CERA issued their report their Managing Director Jim Burkhard stated at a presentation that "Peak Oil is Here," referring of course to their notion of peak demand, not a peak in supply. In response Dave Cohen served up his trademark brand of caustic derision in Peak oil = peak demand?
CERA must have been thinking really hard in the first half of 2008 about how to spin the fact that global demand was growing but supply could barely rise to meet it. And then it must have come to them like a bolt from the blue—peak demand! This is an ingenious solution. The oil supply doesn’t have to grow anymore because we don’t need it to. World oil production capacity doesn’t matter anyway. We can acknowledge peak oil without acknowledging peak oil.
And so in June, 2008 when things looked bleak for the oil supply, CERA issued its report, "Drivers Turn the Corner in the United States". CERA knew, as many of us did, that demand would surely collapse with prices over $140/barrel and stay down for a long, long time.
As Dave subsequently points out, that hasn't exactly transpired, is far from accounting for the world as a whole, and also looks like a lame way of covering for a peak in supply. Others have commented on this topic; Sam Foucher posted a detailed article here in the fall on peak demand in the OECD; and in the last month a pair of additional excellent critiques of peak demand have been published by Kurt Cobb and Chris Nelder. Chris references a Deutsche Bank paper from last fall which is worth reading as well; I will comment briefly on one of its cornerstone assumptions later in this post.
While CERA aren't specifically citing historical examples of demand troughs as JD did - although they are more than happy to bring up failed historic peak oil forecasts, as well as deigning to mention failed past attempts at bringing unconventional oil to market in their uberbullish supply projections - this article will cover the major demand contraction of the late 70s/early 80s, which, as JD points out, restrained production for about 13 years worldwide, and compare them to how things are currently unfolding.
Overview of Demand Destruction in 70s/early 80s
To give a general overview of how the previous phase of demand destruction unfolded, here is a pertinent excerpt from pgs 717-718 of CERA chairman Daniel Yergin's Pulitzer Prize winning history of the oil industry, "The Prize":
Significant changes were also taking place in demand. The massive twentieth-century march toward higher and higher dependence on oil within the total energy mix was reversed by higher prices, security considerations, and government policies. Coal staged a massive comeback in electricity generation and industry. Nuclear power also made a rapid entry into electricity generation. In Japan, liquefied natural gas increased its share in the energy economy and in electricity generation. All this meant, around the world, that oil was being ejected from some of its most important markets and was rapidly losing ground. Its share of the market for total energy in the industrial countries declined from 53 percent in 1978 to 43 percent by 1985.
Not only was petroleum experiencing a declining share of the energy pie, but the pie itself was shrinking, reflecting the profound impact of increased energy efficiency, otherwise known as conservation. Though often dismissed or even ridiculed, conservation had turned out to have massive impact. Energy conservation in modern industrial society meant, for the most part, not deprivation, not "small is beautiful," but greater efficiency and technological innovation. The 1975 legislation that mandated a doubling of the average fuel efficiency of new automobile fleets to 27.5 miles per gallon by 1985 would reduce United States oil consumption by 2 million barrels per day from what it would otherwise have been—just about equivalent to the 2 million barrels per day of additional oil production provided by Alaska. Altogether, by 1985, the United States was 25 percent more energy efficient and 32 percent more oil efficient than it had been in 1973. If the United States had stayed at the 1973 levels of efficiency, it would have used the equivalent of 13 million barrels of oil more than it actually did in 1985. The savings were huge. Other countries made their own dramatic savings. Japan over the same period became 31 percent more energy efficient and 51 percent more oil efficient.
By 1983, the first year of economic recovery, the impact of conservation and fuel switching was clear. Oil consumption in the noncommunist world was 45.7 million barrels per day, about 6 million barrels less than the 51.6-million barrel-per-day level of 1979, which had been the high point. So, while demand had fallen 6 million barrels per day between 1979 and 1983, non-OPEC production had increased by 4 million barrels per day. On top of that, the oil companies eagerly sought to dispose of the tremendous inventories they had built up in anticipation of a demand level that never materialized. Those three trends—the collapse in demand, the relentless buildup of non- OPEC supply, and the Great Inventory Dump—reduced the call on OPEC by something like 13 million barrels per day, a fall of 43 percent from the levels of 1979! The Iranian Revolution and then the Iran-Iraq War had crippled the exporting capacity of those two countries. Yet suddenly, instead of the feared shortage, there was a large surplus of production capacity over market demand in short, the makings of a massive glut.
Recent Drop in Demand vs Drop in Demand in 1970s
This article will examine that collapse in demand. These peaks happened at different times; a problem with building a complete data series is that monthly numbers for the 70s aren't included for many minor products such as ethane-ethylene or petroleum coke, with data only going back to January 1981, a few years after the local peak had arrived. Another shortcoming in the EIA data is that the "Finished Petroleum Products Supplied" series also only begins in January 1981; luckily a monthly series for "Crude Oil and Petroleum Products" does go back to 1973, when the data also begins for products such as Liquified Petroleum Gases and Propane and Propylene. By summing the product series which are included I've derived numbers for monthly Finished Products sans crude oil, which look to be accurate enough; when the series begins the difference between the last summed value and the first EIA number is 93 kb/d, a wholly negligible difference, so I feel confident in using the summed values here. I should explain that Crude Oil itself was a product supplied, presumably for power generation or industrial applications. It peaked at 66 kb/d in 1983, and had hit 0 kb/d in 1999, where it has stayed ever since.
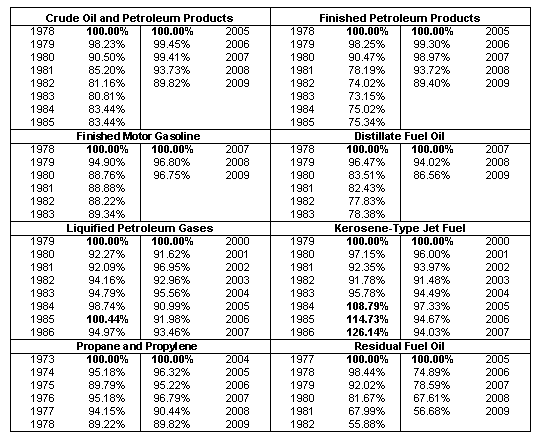
Here are the local peaks for 1973-1979, all values in kb/d:
Crude Oil and 		Finished 		Finished 	Distillate 	Liquified
Petroleum Products	Petroleum Products	Motor Gasoline	Fuel Oil	Petroleum Gases
Feb-1979		Feb-1979		Jun-1978	Jan-1977	Jan-1979
21287			19794			7913		5103		2086

Kerosene-Type 		Propane 		Residual
Jet Fuel		and Propylene		Fuel Oil
Feb-1979		Jan-1977		Feb-1978
951			1354			3974
The actual peak for Propane/Propylene was Jan 1973, at 1376 kb/d; to this day Propane/Propylene is a very seasonal product, with winter numbers exceeding those of summer by some 40%, so I have taken the liberty of using the above figure from Jan 1979, which is only 22 kb/d short of the 1973 number.
By calculating percentage values of these product streams from their local peak value we can see how much demand had contracted over the years. I've built up monthly series for 6 years after each 70s local peak, which can be matched with the local peaks from the last 6 years. In most cases these are the absolute peak for the past decade, with a couple of exceptions.
The recent peaks in 2004-2009 for these products were as follows:
Crude Oil and 		Finished 		Finished 	Distillate 	Liquified
Petroleum Products	Petroleum Products	Motor Gasoline	Fuel Oil	Petroleum Gases
Aug-2005		Aug-2005		Jul-2007	Feb-2007	Jan-2004
21666			19473			9640		4582		2596

Kerosene-Type 		Propane 	Residual
Jet Fuel		and Propylene	Fuel Oil
Dec-2005		Feb-2007	Aug-2005
1756			1798		1051
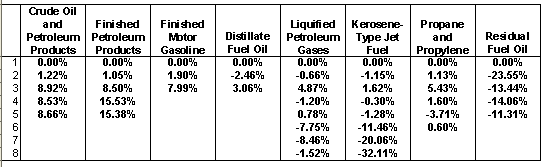
Some of the absolute peaks for the past decade were previous to these dates, so after this section I will conduct the same analysis using annual figures. But first, here are what the December 2009 product supplied numbers would have been, if the decline had followed the same pattern as obtained in the late 70s/early 80s, along with the difference between actual values and what they would have been following the percentage pattern which obtained in the late 70s:

To clarify, here is an example: Dec 09 is 53 months from the modern Aug 05 peak for Crude Oil and Petroleum Products; the equivalent local peak happened in the 70s in Feb 79, and 53 months later was at 71.82% of that peak value. The "Actual Product Supplied" is what was actually brought to market in Dec 09; the next column is what it would have been at 71.82% of that Aug 05 value.
Clearly the current contraction in demand is far less steep than what obtained previously; note that the majority of the peaks in each instance occurred on the cusp of severe economic downturns, beginning in the US in December of 1980 and 2007 respectively. The current recession is by almost all measures proving to be more severe than that of 1980-83, but is having less effect on petroleum demand. To be sure demand destruction has occurred, but if CERA's projections are going to come to pass the rate of contraction will have to show a sizable uptick soon.
Here are tables contrasting the two local eras of peaking, this time on an annual basis:
Starting with the peak values from each era and subtracting the current percentages from the 70s numbers, we get:
To clarify once more: positive numbers indicate steeper declines in the past, negative numbers mean the current values are steeper. The averages for these numbers are:
CO&PP	FPP	FMG	DFO	LPG	KTJF	P/P	  RFO
6.83%	10.11%	4.95%	0.30%	2.11%	-0.28%	1.11%	-15.59%
As can be seen resid is contracting faster now than it did previously, but not to the same volumetric effect:
Note as well that LPG and jet fuel quickly exceeded their local peaks; the number of years for each product to exceed its 70s peak were as follows:
CO&PP	FPP	FMG	DFO	LPG	KTJF	P/P	  RFO
21	n/a	16	20	8	7	8	  n/a
But this is misleading to an extent; many streams were back up to ca. 95% within shorter spans of time. Gasoline, for instance, bottomed out at 88.22% in 1982, rising to 98.97% in 1988, before declining again for a few years.
Years to hit bottom:
CO&PP	FPP	FMG	DFO	LPG	KTJF	P/P	  RFO
7	7	6	6	6	4	3         n/a
Those who wish to examine this in further detail may download my "Product Supplied - Annual" spreadsheet linked at the end of this essay.
CERA's call of course is for demand to never exceed 2007, not for it to decline at comparable rates to historic precedents. But can demand be said to have permanently peaked now? After all, the more sharp declines from the 70s hit bottom fairly quickly; Crude Oil and Petroleum Products only declined for 5 years before beginning its subsequent rise. And for any domestic declines to have meaningful significance in the first place they must be balanced against fast rising demand from developing nations.
The current demand destruction is much milder than those of the past. Are we wrong to assume the pace of decline won't pick up? As Yergin points out, an inflexible attitude about strong future demand took many by surprise 30 years ago, with investors placing faith in bullish forecasts which failed to pan out in spectacular fashion.
What are the qualitative differences between then and now? Do low hanging fruit remain to be picked? I will delve deeper into two examples: finished motor gasoline and residual fuel oil.
Finished Motor Gasoline - Potential for Improvement
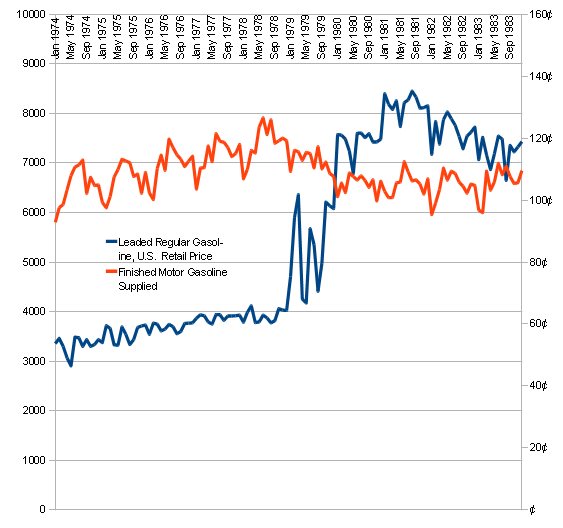
Gasoline is the sector of the petroleum industry with which we are all familiar; why did demand for it fall so sharply in 1978-1980? The price spike in the wake of revolution in Iran shutting down its petroleum industry had an obvious effect, as can be seen in this graph:
CAFE standards were meanwhile bringing vehicles to market with much higher fuel economy standards; past figures are followed by tentative present goals set by the White House/EPA:
Model  Passenger       Percent
Year    car MPG      Improvement
1978	18.00		5.26%
1979	19.00		5.00%
1980	20.00		9.09%
1981	22.00		8.33%
1982	24.00		7.69%
1983	26.00		3.70%

2011	30.20		8.94%
2012	31.96		5.51%
2013	33.72		5.22%
2014	35.48		4.96%
2015	37.24		4.73%
2016	39.00		4.51%
This would firm up the CERA scenario of efficiency curbing demand, if these goals were actually met; however, Dave Cohen explained in his article Obama Tackles the Liquid Fuels Problem that whether this will happen is actually a surprisingly open question.
In addition we are going through the worst downturn in vehicle purchases in history; while 1980 sales were down -18.6%, subsequent years showed milder contractions followed by vigorous rebounds, with an -8.67% average for years of decline; 2006-2009 is -11.09% average:
	Total car/	 YOY 	Total Vehicle   Sales as %
	LDV sales	Sales	Registrations	of fleet
1978	15,122,000	 3.4%	142,049,000	10.65%
1979	13,984,000	-7.5%	145,451,000	9.61%
1980	11,389,000	-18.6%	149,477,000	7.62%
1981	10,678,000	-6.2%	152,026,000	7.02%
1982	10,426,000	-2.4%	153,494,000	6.79%
1983	12,132,000	14.1%	157,658,000	7.70%
1984	14,187,000	14.5%	160,264,000	8.85%


2003	16,548,000	-1.6%	222,857,000	7.43%
2004	16,906,000	 2.1%	228,276,000	7.41%
2005	17,001,000	 0.6%	231,905,000	7.33%
2006	16,505,000	-2.9%	234,525,000	7.04%
2007	16,089,000	-2.5%	237,403,000	6.78%
2008	13,260,747	-17.6%	246,000,000	5.39%
2009	10,429,553	-21.4%	250,000,000	4.17%
While January auto sales were up 2.6%, suggesting 2010 sales will rebound to some extent, it is questionable that they will improve to any great degree. Toyota's stuck accelerator woes have impacted sales of hybrids as well, undercutting another of CERA's precepts, as Prii account for no less than 48.12% of US hybrid sales. In the 70s the size of the vehicle fleet was smaller in the first place as well, allowing new vehicles with greater MPG to have a proportionately larger effect on fleet fuel economy, as can be seen in the above chart.
Counting on hybrids to negate demand for gasoline in the short term is on shaky ground in the first place, since, while their total sales volume has climbed up to a whopping 2.71% of yearly totals, as a percentage of the total US fleet all hybrid sales from 2005-2009 amount to .6568% of the total, a rather insignificant amount; if these had been pure EVs by 2009 they would have negated about 60 kb/d of demand, to give an idea of what an upper bound for their savings would be. Not all of the fleet is in daily use, of course; a general number I use for calcs is the percentage of the US labor force which drives to work solo, that is, 76.1% of ca. 154 million workers = ca. 117 million vehicles, assuming there is a 1:1 correspondence between workers and vehicles, which of course isn't the case; this is a subject of ongoing research for me. But with this lower bound figure (useful for estimating how long it will take to replace the essential part of the vehicle fleet) as a static number cumulative 2005-2009 hybrid sales still only account for 1.38% of the total fleet.
The Deutsch Bank study somehow proposes that total US hybrid sales for 2010 will be 4.2% of "light vehicles," that is, "cars, personal light trucks, commercial light trucks, hybrids, plug-in hybrids and pure electric vehicles." My sources for sales are the Hybrid Dashboard (the Toyota article linked above) and the Hybrid Car Review, both of which do capital work in compiling sales figures.
I haven't fully explored the inroad of hybrid commercial vehicles here; PHEVs aren't on the US market yet, or much of anywhere else for that matter; the lone example marketed in Happy Motoring China has proven to be an utter flop; BYD, the company that builds that PHEV and who plan to be the world's #1 automaker by 2020, have delayed selling it outside of China from 2010 to 2011, and only ca. 10k Volts are slated to be in showrooms at the end of the year; thus the DB forecast for 2010 is quite the question mark, barring total sales contracting sharply enough for it to come about, which I assume isn't what they're talking about.
DB consider PHEVs to be a "game changer," comparable in their effect on petroleum demand to how kerosene shouldered aside whale oil in the 19th century. As the evidence above suggests, the net effect to date is very minor. This isn't US-centric on my behalf either, the US and Japan respectively account for 47.53% and 44.68% of global hybrid sales.
CERA also consider biofuels to be a major factor in future demand destruction; those interested in this should seek out Robert Rapier's articles, both here and on his R-Squared Energy Blog.
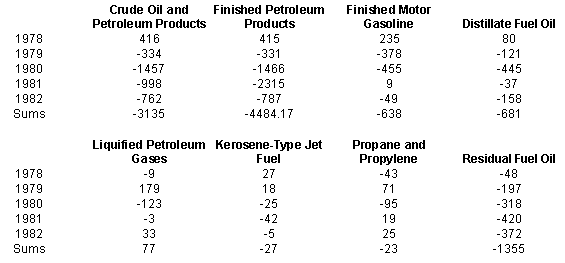
Savings in Residual Fuel Oil for Power Generation and Heating in the 1970s
The other sector I will focus on is residual fuel oil, used for "the production of electric power, space heating, vessel bunkering, and various industrial purposes." Note that it accounted for 16.65% of total US demand in 1977, declining over the decades to 3.13% in 2009. As can be seen in this chart of post-peak YOY differences in amount supplied, the cumulative short term savings from phasing out residual fuel oil amounted to around twice that from either gasoline or distillates:
Much of these savings came from declining use of resid for electrical generation; the EIA's Annual Energy Review includes data on use of petroleum in the electric power sector from 1949-2008; in 1977 this amounted to 1,575 kb/d, 51.3% of 3071 kb/d total; for 1982 it was 642 kb/d, 37.4% of a total 1716 kb/d. The sum of YOY Diffs for resid 1973-2009 amounts to -2300.5 kb/d, almost completely obviating the 2310.58 kb/d accounted for by gasoline.
Potential for Savings in Petroleum for Power Generation and Heating Now
Other nations are strongly dependent on petroleum for power generation; JD also had a post on this topic in March 2008. In North America resid was displaced primarily by natural gas; in Europe nuclear and hydro served the same function. Various regions have changed their mix of petroleum consumption over the years; as a preliminary example, here is BP data on OECD demand, broken down into 4 general sectors:
			OECD (1978)		OECD (2008)
Light distillates	31.89%			36.25%
Middle distillates	29.36%			36.13%
Fuel oil		23.47%			7.43%
Others			15.28%			20.19%
Other examples may be seen in the BP Stat Review. My worksheet version has more percentage figures like the above (link at bottom). JD's preliminary figure for 2004 use of petroleum in power generation worldwide was 3.58 mb/d; using a newer edition of the same data source (the World Bank's World Development Indicators (WDI)) I get 3.82 mb/d for 2006, a slight increase. Both of our figures were for 620 kwH/bbl or 35% efficiency, which I've subsequently discovered is likely to be a bit on the high end, given what this 2000 EIA paper suggests:
The national average thermal efficiency of power generation from fossil fuels in 1999 was estimated to be 32.54 percent, slightly higher than the previous year's average of 32.42 percent.
This refers to the US. Perhaps efficiency improved 2% in the interim; JD gives no source for his figure. Numbers like the EIA's are common in other articles I've come across, as well as being in use by knowledgeable commentators such as Engineer-Poet.
JD also includes this very intriguing bit of information from veteran oil industry analyst Henry Groppe:
[Henry Groppe] believes that something like 20mbpd of the current 84mbpd of oil demand is going for heat and power generation primarily in developing countries. He thinks that with oil in the $50-$60 range, all of this will get converted to coal or natural gas, and that, along with vehicle fuel efficiency, will be the main initial responses to peaking, and will keep us out of serious economic pain for a decade or so.
This is from Stuart Staniford, relating what various speakers had to say at the 2005 ASPO-USA Denver Conference. Whether he subsequently examined this in depth I'm not sure; my intuition is that efficiencies in developing countries are often likely much lower than the EIA figure for the US, as Groppe's comment might suggest; either that, or a sizable amount of demand worldwide is for domestic heating. What is more, these same countries which are heavily dependent on oil for power are often major producers of that oil in the first place. According to the WDI data no less than 19082 kb/d of production is coming from oil producing nations who also are >50% dependent on oil for their power generation. Here are some preliminary numbers (using the 35% efficiency figure), all values in kb/d:
		2006 cons
		for elec 	2006 Total
		generation	Consumption	% of Total

Iraq		138.85		532.99		26.05%
Kuwait		152.50		266.87		57.14%
Iran		152.77		1,693.04	9.02%
Indonesia	171.15		1,172.91	14.59%
Italy		202.60		1,812.59	11.18%
China		227.82		7,381.77	3.09%
Mexico		238.24		1,969.95	12.09%
United States	358.87		20,687.42	1.73%
Japan		409.60		5,213.11	7.86%
Saudi Arabia	415.53		1,841.44	22.57%
The choice of countries here is dictated simply by their being those which used the highest volumes of oil for power generation in 2006. As Groppe suggests these numbers could in many instances be much higher, especially in countries with antiquated/dilapidated infrastructure such as Iran or Iraq. If 23.8% of world demand is accounted for by power and heat, a staggering amount of low hanging fruit is waiting to be plucked, and the substitutes in many important cases needn't necessarily be other fossil fuels or nuclear; as has been observed, Saudi Arabia is the Saudi Arabia Of Solar Energy, and they are making preliminary noises about going renewable, with possible assistance from EU members, too. This could potentially be a major growth sector for renewable companies, freeing up oil exports in the process; whether the OECD example of shifting away from petroleum for power generation can be ported successfully to developing nations will be the subject of a future article, along with a closer examination of how global petroleum demand has changed.
What May Be Ahead
In conclusion to this article, here is the following paragraph from Stuart's 2005 piece excerpted above:
I need to research it, but that story made a lot of sense to me. Fuel switching in heat and power was exactly what the US and Europe did back in the late 70s and early eighties, so it's believable that developing countries would do that this time around. Combine that with a lot of OECD fuel efficiency improvements (which have already begun) and we can probably maintain economic growth through quite a bit of the early post-peak era (except for geo-political shocks). That also buys us more time to start doing the harder things that will need to be done down the road.
Staniford Oil Drum articles on the US vehicle fleet:
The Auto Efficiency Wedge
Why We Drive
Some very messy spreadsheets of mine, Open Office format:
Electricity (from World Development Indicators 2009)
Statistical Review of World Energy 2009 Work Copy
Hybrid Vehicle Sales
Product Supplied - Annual
Product Supplied - Monthly
Contact
- Content: editors at theoildrum dot com
- Tech support: support at theoildrum dot com
License

This work is licensed under a Creative Commons Attribution-Share Alike 3.0 United States License.
I don't think JD has much of a sense of the discovery to production life-cycle, or he just won't admit it. Clearly, the late 1970's and early 1980's showed real perturbations in global oil production. These were not phantom.
The Oil Shock Model easily demonstrates the perturbations. Nothing surprising about the behavior as it simply adjusts the extraction rates. Thats why I called it the Oil Shock model, as these perturbations will cause "shocks" to the system. So the OPEC adjustments on production produced most of the level adjusting shocks to the global supply during those years.
I figure the only reason the model is not generally accepted is because we are indoctrinated in using a fixed heuristic model such as the Logistic. The straight Logistic or sigmoid function does not accomodate any perturbations because the basis for it (as conventionally accepted) is the brain-dead Verhulst equation.
Search Oil Shock model on TOD or go to http://mobectivist.blogspot.com if this perks your interest.
I know JD has never challenged the model directly, probably because he doesn't have a good argument against it. And that's why he won't acknowledge it either, as it would ultimately deflate his arguments and his web site would become pointless.
Can't recall JD having much to say about models in general, other than latching onto HL as evidence that world production will decline at a gentle 1%, allowing for his conservation/electrification scheme to do its thing. Mostly he's a first order guy like me, and he digs up solid data on subjects like those listed in the article, which fly under the radar of many peakists, whether deliberately or not. His other bête noire is or was "Doomers" and their frothing prophecies of imminent death and destruction, which is nothing I disagree with; their opposites on the cornucopian side are certainly tiresome - remember TheAntiDoomer?
On balance I think his blog is good work, a welcome antidote from that Doom. Don't see the need for all the ******* profanity, though.
[dp]
Oil is a fossil source of usable energy. If peak oil was the only imminent shock to global civilisation then I would have more time for JD. He may be optimistic about decline rates, but peak oil in isolation would not be a game changer. However, global population is now at unsustainable levels for a whole host of resource and environmental reasons, and the limits to growth are rapidly making themselves felt. On top of that we have a global financial model which requires exponential growth of measurable GDP - in practice this means exponential growth in the consumption of physical resources. This is fundamentally unsustainable, and the wheels are coming off the wagon.
The first oil shock was an early warning on exponential growth. The second one is a very late one.
No one should latch onto HL (Hubbert Linearization). I agree with Robert Rapier and a few others that HL is absolutely the wrong way to go in understanding oil depletion. Sam Foucher did a valient job of reconciling HL with the Oil Shock model here (Hybrid Shock Model - http://www.theoildrum.com/node/2430), but it is really not necessary.
HL only comes about because of a coincidental mathematical identity implicit within the Verhulst equation that Deffeyes somehow became infatuated with. However, oil production is not governed by that equation, which should theoretically only work for lifeforms that can reproduce and reach a steady-state carrying capacity. Oil does not reach a carrying capacity however, since oil molecules do not reproduce. They may "die" but they don't reproduce.
More here: http://mobjectivist.blogspot.com/2007/03/derivation-of-logistic-growth-v...
So the only thing I share with JD is that I don't spend any time with doomerish thoughts. I don't swear on my web site (cuss level currently at 3.8%), yet it makes we want to scream when the facts are deliberately obscured for some hidden agenda. That is what gets me about JD and his **** musings.
It seems to me like JD hasn't posted since October 09? Has his blog moved or something? His arguments were interesting. Although I am far less optimistic than JD, I think that TOD needs more people like him who attempt to disprove doomers - it keeps the doomers on their toes and keeps their arguments logical.
On an unrelated note, it's a shame that we lost Airdale. Even if he really does stay off the internet and live out his last couple years farming like he said he would, he will probably be remembered by most here for a long time - from what he said about his kids, he probably had a far greater aggregate impact on the world through his TOD postings than raising his kids.
Both occasionally publicly state they're retiring, only to reappear after a while. It happens; I know, how could anybody get sick of the Internet...
Would like to hear back from Bob Shaw, too.
I can imagine getting sick of something if you treat it as a game.
On the other hand, some of us are in this for the long haul and find the Internet the best way to mine for data and ideas.
That was his mistake. He should have tried to disprove the scientists and not the doomers. A science of doom does not exist.
WebHubbleTelescope said, "A science of doom does not exist."
Hmmm...that could actually make for an interesting discussion!
I prefer to think of it as more of an art than a science, call it "An art of doom". :-) Several years ago I found an article in a literary magazine discussing the long history and seeming need in the human psyche for apocalyptic forecasts and predictions...no culture seems to go without them, they are like psychics and astrologers, never totally absent.
RC
Greer had some excellent comments about mindsets, apocalyptic and otherwise, in the Long Descent. The book is built on old blog entries so if you want you can fish those out of his archives.
If we want to remain optimistic about the future, the only mindset we need to understand is that of the people with some sort of authority. And then you get into scientific and analytical policy discussion, which is where my head is always at.
For some reason I have not read Greer at all, but noticed that he is the one that writes the Archdruid Report, which I have heard about. That just goes to show that I definitely miss most of the hypothetical and philosophical arguments in favor of the scientific and analytical side of things.
Maybe if we were still getting a lot of electricity from oil, and using a lot of heating oil, we could substitute like in the time period JD mentions. Also, if hybrids got twice the mileage and were the same price or cheaper, efficiency could trump Jevons for a few years like in the early `80s when people flocked to more fuel-efficient cars. However, as they say, "This Time Is Different." People need to realize this. Even I am terrified by attempts at an infinite growth paradigm:
http://bravenewclimate.com/2010/03/19/britains-energy-future/
Sure,
efficiencies will work in the short term only for the Jevons effect to increase energy use in the long run fueling our exponetially growing socio-economic system.
Jevons paradox works because the increased efficiency drives down energy prices and decreases in energy use caused by the greater efficiency allows one to use more of the energy. This time is different in that despite increased fuel economy, crude oil prices would likely still increase. Thus Jevon's paradox will likely not occur in this scenario - assuming that we are peaking in oil production now.
Of course, this scenario supports the point that the increased fuel economy may happen anyways whether CAFE standards were increased or not....
Retsel
Retsel wrote; "Jevons paradox works because the increased efficiency drives down energy prices and decreases in energy use caused by the greater efficiency allows one to use more of the energy."
This is not quite how Jevon's paradox operates. It works because the increased efficiency makes it attractive for more people to employ this efficient technology. James Watt's improved steam engine (over the Newcomen) meant it could be used, profitably, for many more applications, so coal used increased dramatically. Even if the coal price went up, it was still cheaper/better/more reliable/scalable than horses.
This is really a case of increased efficiency of Fuel A displacing usage of Fuel B. The same has happened in Europe with diesel cars, which have become more efficient and more widely used even as diesel prices have increased. But the proportion of diesel cars on the road in Europe has no chance of making any impact on world oil prices, or Euro fuel taxes, which are the main price components.
What is different this time is that increased efficiency (e.g. hybrids) is (slowly) displacing more less efficient vehicles using the same fuel, and probably won't lead to more miles being driven. For example, the taxi industry, is rapidly hybridising, and decreasing their fuel use, but this won't lead to more people riding cabs. A family replacing their old sedan with a hybrid may drive more "recreational" miles, as opposed to commuter miles, but this will only lead to a small increase in their miles driven.
To summarise, most vehicle miles driven are fairly non discretionary, and increased efficiency won't lead to a lot more vehicle miles driven, and it certainly won't cause fuel switching from anything else to gasoline. It may delay switching from gasoline to other fuels, like CNG and electric, which would prolong gasoline use, but still not increase the rate of usage.
I'd say that the % of discretionary travel is likely half and half:
At least in the US. If more citizens lived within walking distance of their destinations that would certainly help.
Diesels haven't really cut down on European fuel usage, at least by the broad measures of light and middle distillates that BP data uses; middle has increased while light declined but the sum of the two over the last 20 years has slowly increased. If dramatic fuel economy improvements came about that would have an impact on global demand, but the European example shows that diesel driven fuel economy improvements weren't enough to drive demand down; population growth alone perhaps did that in. They did moderate demand of course, but only so it could grow like crabgrass elsewhere in the world.
PHEVs do hold the promise of almost divorcing the motorist from hydrocarbons, but as I laid out in the article they are only now being fielded. Another question I have is to what % of the overall market luxury vehicles have ever penetrated. After all, if GM can show strong profits selling 60k Volts per year why bother increasing production, if the expansion costs weigh too heavily on the balance sheet? To get to the bottom of this one I need much more data on past model sales; it would also be useful to get an idea of how fast makers have rolled out new models in the first place.
KLR, Thanks for that. I would have to agree, based on that graph, that half the driving is "discretionary". But that doesn't mean that doesn't mean, of course, that people ca/are willling to give up half their driving. I would guess that a 10% reduction is easy, but more than that starts to require changes to more than driving habits (changing to smaller vehicles, moving closer to work, working from home, taking transit where available, etc).
I haven't got the numbers in front of me, (though someone recently posted a graph showing the breakdown of US oil consumption) but the total US gasoline consumption changed has changed little over the last five years, even the the price more than doubled in that period, and is now more than 50% of where it started. If you add in ethanol, it might be that light motor fuel (gasoline + ethanol) hasn't decreased at all.
When gasoline was $4 plus, US vehicle miles decreased for the first time on record, but only by a few % points. So if it took a doubling to get 3% reduction, what kind of price increase do we need for 10, 20, 30% reduction? And if prices are that high, consumers, at the lower end are so squeezed that they can't afford a newer car or to move etc, all they can do is pay the cost.
Folks who can afford to but the limited number of PHEV's are much better off, but as you point out, it will only be a small fraction of the market. Even if 10% of new car sales are EV, that is only a 1% portion of the total vehicle fleet, so the overall impact is negligible in the short term.
Agreed about the carmakers - their mission is to be profitable, not to solve the nation's oil problem's. If the Volt is only profitable at $40k plus, then that is as low as they should sell it for. Past figures on luxury car sales might not be the best indicator. In 06, no one was buying entry level versions of anything, they were all optioned to the max. Now, that has settled down a bit. Still, even a Volt at $30k is tough when you can buy nice, fuel efficient mid size Hyundai's for $15k, and subcompacts for less than $10k . Toyota still sells more Yaris than Prius.
Returning to my original theme though, US motor fuel consumption barely budged during the highest prices and now worst recession in a generation. I think it will take quite some time, and/or even worse prices/economy to make any substantial (>10%) reductions in motor fuel usage.
Honestly, you guys must get over the "OmiDog, gas at $4.00?" paradigm. I'm almost certain that the price of gasoline is so cheap it has very little if any measurable effect on consumption. For evidence, I offer Canada, where gasoline has sold for at least US$4.00 / gal since forever, yet the mix of vehicles used is the same, distance driven is higher, etc. etc.
How about some evidence? And analysis?
Len,
By "you guys" I am not sure if you are including me, but the point of my reply to KLR there was that the price makes little difference - it needs "structural" changes (changing vehicles/relocating etc) to reduce oil usage.
I live near Vancouver and pay about the same as you do for fuel, though I have lived in Australia and Europe where it is twice the price. When you have a practical alternative to driving, you take it, otherwise you have little choice. Difference is, of course, that Euro cities (and countries) are set up for lots of transit use and we are not.
The Americans are fixated on high gasoline prices because they have never really had them, and think it's the end of the world as they know it. For most of them there is no short term alternative to driving. Personally I think a serious price and/or supply shock is what's needed to jolt them in to action. But whoever are the politicians that are in office when that jolt happens, likely won't be for long. California turfed out their governor over high electricity prices, the whole country could easily do the same to Obama (or anyone else)
I agree they should just get over it, but somehow I just can't see that happening - it will be forced on them and they will be very bitter and feel that it's someone else's fault. It may indeed be someone else's fault that oil prices are high, but it's their own fault that they have no real alternative to using it. I just don't want to be the one that has to tell them that...
32% Can tax instead of US 20%. Are you Canadian? Neither of us have anything to complain about: CPPI Canadian Petroleum Products Institute — Questions & Answers Or boast about, you've seen the charts of subsidized prices around the world.
Price shocks move consumers, as the chart of gasoline supplied vs gasoline price in the article shows pretty clearly, when taken in tandem with the gains in CAFE at the time. I think I've found some evidence that a shift back to MT took place as well; a FHWA report from 1977 said 91.6% of commutes were personal vehicle, 4.6% public vehicle, 3.8% other. Chart in "Our Nation's Highways 1981 (.pdf, 12 mb), available from Archives - Publications - HSS - Policy Information - FHWA. That would have knocked some of the gasoline out of the picture; I know that the current figure for personal vehicle solo is 76.1%. But the 1977 number might have carpooling folded into it.
Here is gasoline supplied vs VMT; both are currently on the rise:
2009 was 96.75% of the 2007 peak in gasoline supplied, as shown in the...chart in the middle of the article. Darn, should've slapped numbers on those things. As the chart above that one illustrates, 2 years after the equivalent peak in the 70s demand was 1880 kb/d lower, so we're not cutting back as eagerly this time.
VMT began to slide down in 2006, people responded to a much lower price than the ultimate peak. The Brookings Institute analyzed this phenomenon: The Road … Less Traveled : An Analysis of Vehicle Miles Traveled.
How people will respond to further price shocks is up in the air. I fully expect another one this summer, though, which should result in another round of political theater; perhaps some will begin to demand more constructive action from pols, or real explanations. As always, Interesting Times.
A high level of consumption is baked into our built infrastructure. We are a lot more auto- dependent than we were thirty years ago.
Much of the industry that occupied the US economy is overseas. Higher fuel costs are balance by much lower labor costs and different tax/tariff structures.
Price shocks will take place at lower price levels than previous. There is less money in circulation, more unemployment, less credit and more risk. A crude price of + $100 is probably out of the question. The US economy would have a coronary before the price reached that level, not so much because of the high oil price but the inflationary implications of that high price. We are certainly not in 2008 anymore!
The current price is probably what the market will bear. Here's Nymex Unleaded gasoline superimposed over Brent Crude:
ULG has shown a tendency to run higher than the underlying crude price. In fact, Brent has so far been unable to test the January high. Why are prices doing this? Because refiners - which buy ALL crude - are desperate to make some coin! Unfortunately, the higher unit price cuts into volume. The refiners are in a trap, being stranded by high input costs that they themselves cannot pass on. Industrial fuel components are in the toilet due to the ongoing business slump and high priced gasoline cannot create sufficient margin as a substitute.
Steve, I think a $100 US price is a very real possibility. All it needs is a pirate attack on a tanker in the Gulf of Aden or Strait of Molucca to go wrong (i.e. ship burns/sinks/explodes) or any escalation of anything between Iran and Israel/Iraq/US, or some serious pipeline attacks in Iraq, requiring increased US presence and oil will be over $100 by the end of the week.
Agreed that for purely economic reasons it shouldn't get that high, but there is much more to oil price than purely economic reasons, and therein lies the problem. The US economy is driven, in part, by a commodity that can quickly become priced at recession inducing levels for reasons not directly related to supply and demand. I say not directly because the fact is, that if supply is curtailed or even just seriously threatened, the prices move up, and fast.
While I agree that high oil prices are inflationary, I'm not convinced it would cause the US economy to have a coronary, further or extended recession, yes, but not collapse. For an average family, their cost of health care is bigger, and rising faster, than gasoline. As consumers spend less, the things they tend to cut back on - consumer goods - are mostly imported. They things they can't cut back on - food, insurance, health care, layers, mortgage payments, are (mostly) not imported. Yes it's bad for the malls, and tourism/recreation, but real industries (that remain) that create real things or provide real, important services will carry on, though less profitably.
I think a big factor in the difference from the 70's is that there were real supply disruptions, not just price rises. When people were faced with not being able to get fuel, at any price, there is a more severe reaction. Finding out that the price at the pump just went up $1 won't make you race to the gas station, but hearing that imports have been curtailed and supplies are threatened certainly will. Some serious supply disruptions in the Persian Gulf might just re-create those conditions again. And with that situation threatening China and India's supply too, I think the price of the remaining oil will be bid up that much faster.
(duplicate)
(duplicate)
Hey Paul ...
What you mention about real supply disruptions is where the issue (probably) lies. If an incident causes the loss of one tanker, it would not represent a supply disruption. There are many tankers parked off Rotterdam and Singapore that are simply waiting as replacements. I think any action would have to represent a disruption of a substantial percent of oil flows.
Then again; $100 oil, economic crash, price plummets. I think this would happen even with a longer- term interruption in supply. I bet demand destruction would have more effect this go around than it did in 09.
What I'm trying to get at is an assumption: that oil prices can easily rise to much higher levels. This assumption leaves the false sense of assurance that current prices are 'low' and that nothing must be done to change the way business is done.
It's also shoddy economics. When Jeff Rubin yaks on and on about $200 oil I cannot take him seriously. Where is that money going to come from? Not from production which is strangled by the same $200! The oil import trade is really fundamental. Most people - even college profs and PhD's - just don't get it.
When the USA imports fuel, what does the exporter receive in return? The answer is not much. Outside of UK, Norway and Canada, the returns have not been production or productive leverage. Oil exports is called 'The Oil Curse'. Most exporters are poor. Even Saudi Arabia is a culturally poor backward country - a stifling religious police state.
What countries get in return for their incredibly useful oil is money. All that oil - for decades - out of the ground and into the air as pure waste. Nothing to show for it, anywhere. Just mess, noise, rusting junk, biodegradable houses and bulging landfills. What this means is the commerce return on oil produced has not been of great value. As prices continue to rise the commerce return on oil shrinks. (CROEI)
What is left instead is the money value returned for oil produced; (MROEI). The outcome of this is the world's economies are reverting toward buying and selling money, rather than making and selling goods and services. Buying and selling money is behind the euro crisis, the squabbling in Washington over Chinese dollar reserves; concern over debt, carry trades in US and Japanese central bank rates ... and why Main Street is shutting down. It long since lost its place in the money line. Main street's productive capacity is falling worthless when measured against the oil it consumes.
This productive capacity includes a lot more than domestic fuel consumption which isn't productive at all - it's a dead loss, in fact.
What is happening in Latvia right now (its government collapsed today, BTW) is the reflected image of what the rest of the rest of the world will be, starting ... last year! Every country in the world (except perhaps China) will be Latvia, with GDP falling 20% and wages being slashed. Why? Because the business of the world will be buying and selling money and if you don't have any or the right denomination you will be a Latvian.
But ... all this is ignored behind the comforting facade of 'Oil @ $150 a barrel' as if there will be money flowing into the sewers and out the shower heads. I'll believe it when I see it!
Another idea I work on is the assumption that the past depreciating dollar is doomed to always act this way. This is very dangerous for those who believe it. The 'worthless dollar' assumption is part of the establishment's propaganda aimed at convincing you to turn loose of your dollars! "Buy Gold!" Buy guns and ammo! "buy euros!"
Don't! Do what the rich people are doing; selling their stuff for cash! That's what I'm doing. Selling everything I own, what isn't bolted down and some that is; books, computers, cameras, furniture ... everything. Don't believe the inflationary dollar assumption. It's a lie!
Times change. A dollar is worth about a half gallon of vanishing fossil energy. It's valuable! Whatever is bought with that dollar must produce more than a half- gallon of crude oil can.
I agree, it's not entirely realistic to look at crude availability simply as an economic issue. I plead guilty to 'modeling' and simplification.
In order for the dollar price to change dramatically - outside of some 'Black Swan' event that actually disrupts supply such as a major Gulf hurricane - there would have to be another leg of the finance crisis with some untoward twist. Such a twist would require a dollar devaluation. With deflation all around, it is hard to see what the twist could be. The twist would be doing the damage to the economy, not the devaluation. Of course, the devaluation would then do its own damage a bit later.
Steve, "I think any action would have to represent a disruption of a substantial percent of oil flows." I would suggest that the action would merely need to have the potential to disrupt that significant %. A Gulf of Mexico hurricane, no, any military or even terrorist event in the Persian Gulf, yes.
And who can afford $100 oil? China and India (and even Japan) they all produce far more GDP per barrel of oil than the US, as do most Euro countries. I'm not saying it won't induce recession, but that other countries can handle it better than US, because they don't waste so much oil on personal transport. And the US consumer is already a declining force in the world market, so any further US slowdown won't hourt the rest of the world as much - it has already done it's damage.
Don't know enough about the money trading part to make a meaningful comment there, other than the observation that physical goods or services do seem to be much less important.
That pie chart is fascinating to me, being the suspicious cynic I am...notice that 34 percent of the pie is given over to some very general catagories: "other family or personal business 19%"(?), and just plain "other" 15%(?). Those are some big undefined catagories!
We should recall that the move to more efficient vehicles is not the only technological revolution underway...telecommuting to reduce driving to the workplace is still in its infancy, and the nature of shopping is being revolutionized by online shopping...I think much more fuel consumption is descetionary than we often may believe...of course, everything relies on price...if oil stays cheap or gets cheaper, any "revolution" in consumption stalls, because it simply gets off the consumers radar and becomes not worth the effort.
RC
The pie chart was lifted from Staniford's Why We Drive which I linked to at the end of the article; he got it from one of the National Household Travel Surveys I believe. It's as robust as any other survey, I'd imagine. IEA said that "Other" was what people tended to cut down on first in supply emergencies, too.
If you assume 12kmpy driven, that's 3360 for work. Taking off 104 days for weekends, 10 statutory holidays and 5 vacation days, the average distance driven to work is only 6.8 miles, and only 7.1 with 2 weeks vacation. It wouldn't take much of a battery to get you there, assuming the car didn't weigh 2 tons.
Jevon's paradox works because we use money to measure everything.
So people will spend the same amount of money on energy hence use more when it is cheaper.
If we used energy as the measure the paradox would not hold.
We should measure potential economic activity in energy units available.
In a practical world an energy unit currency would be a good idea but the biggest problem is how do we get from here to there? How do we go from a money based society, that has been in existence for thousands of years and is the accepted paradigm the world over, to valuing energy in a more realistic way?
That is the big question that has only one answer I am afraid.
A total failure of the monetary system.
Jevons paradox will thwart efforts to delay the peak significantly, but if oil scarcity is causing significant societal disruption post-peak, then improving efficiency will not be met with increased demand. The central question is what standard of living can be maintained with a decreased oil supply, and that is entirely an efficiency question. Some people think there are big efficiency gains yet to be made...and this seems to be the case. Other people then point out that many efficiency gains will be expensive and slow to implement...and this also seems to be the case. Sorting out what will actually happen involves that devilishly difficult task of predicting the future...but you can be sure that Jevons paradox will not cause efficiency gains to be compensated by increasing demand during an oil shortage.
Demand destruction will play a bigger role post peak than Jevons Paradox. They will both concentrate energy into the hands of a few much like monetary wealth now.
I read on another blog the suggestion that the best way to eliminate air pollution (soot) and deforestation in India, etc. would be small efficient solar or similar generators for families.
The idea suggested by KLR above is very similar, that massively inefficient, older oil fueled power plants in 3rd world countries could be replaced freeing up oil for critical uses, stretching out our transition time to alternative enrgy sources.
The Chinese of course are famously known for their command economy fast infrastructure replacement capability (though they use coal for electricity so this would not help in oil). However in India and other countries funds and political will are missing probably to do this. Ancient polluting car models are also running around in 3rd world along with all the efficient toyotas (2 stroke DDR Trabis still manufactured in Egypt for example). So bringing 3rd world up to western energy and environmental standards could help a lot in all areas, i.e. pollution and conservation, impoving standards of living along the way.
People mention occasionally how cheap it would be to save all the rain forests dollar for dollar as the poor farmers that clear the forest just need a few bucks to survive. So pay them minimum wage (UN development aid or similar) to take care of the jungle. Lots of low hanging fruit is available in 3rd world and in first world, but very different fruit. Development aid should be steered in that direction definitely from IMF or wherever. It might be much more cost effective to help replace old infrastructure with modern infrastructrure in 3rd world using western multis with state supported loans with tried and true technology as to try to bring the 1st world up to the 22nd centruy 100% renewables satus. This would be a cheap way to buy us time of course. In the west of course conservation (insulation/passive heating/cooling, solar thermal) is the most cost effective way compared to increasing electrical capacity with solar and wind projects(to recharge more I pods/nintendos/laptops) to feed the growth economy of throw away electronic products from Asia.
Glad to hear a comparison with last time around as the 70s/80s is always brought up as an excuse to not worry about, i.e. We will get over it through technology, regulation, new oil discoveries, substitution.
Maybe things will change however more substantially than just a technical adjustment of lifestyle. Maybe as often speculated about WWI/II being fought over oil, WWIII will also be a resources fight due to lack of ability or more importantly, desire to adjust. In 1979 Deng Hsiao Peng had just started his reforms and India and East Bloc were still in a poverty mindset(almost nobody with private cars). Now nobody wants to conserve or do anything for the common good (basic communist tenet) as Reagan/Thatcher have won the ideological battle. Greed being good(basic capitalism) and everyone having a right to self detemination (democracy), what is stopping everyone who wants a resource (oil, coal, gas) to claim it is "MINE". So when the economic bubbles can`t be blown anymore, since communism has "failed", i.e. there is no turning back in former East bloc/China and capitalism has apparently failed, in the west with no replacement ideology then all nations will simply go back to primitive brute power plays, without any ideological stance whatever. Kepp the voters/citizens happy or lose your head. It is all a matter of if we can all adjust quick enough o avoid conflict. The will might not be there although technically the capability is always there. People just love a fight and to blame it all on others. It is easier than paying the piper.
I am less convinced about the possibility of converting electrical production from oil to natural gas in less developed countries.
If the countries do not have natural gas of their own that they produce, it is difficult for me to see this happening. It would be difficult to find a supplier (World supplies are likely to get tight in not many years as it is, even without additional demand!) The cost of the infrastructure and the timing to build the pipelines would be issues. Also the problem of coordinating pipelines running through many countries would be an issue.
I would expect that these long-distance pipelines would need to run underground, to prevent sabotage. My impression is that oil pipelines generally run above ground in less developed countries, because of the cost difference. Running the gas pipelines underground would further add to the cost.
Even in countries where oil is produced, it is not clear that there would be natural gas to burn. Natural gas is often reinjected, to maintain pressure. One often sees articles such as this one, about a shortage of natural gas in Saudi Arabia.
If natural gas is available, I would wonder if countries wouldn't use it in cars, as Iran, Argentina, and Brazil have.
By the way, I didn't write the post (I didn't do much at all); Kevin Rietmann wrote it.
There is a major boom in hydroelectric generation all throughout the developing world. Last week Iran agreed to help Ecuador build two dams (and a smaller one) for over 100 MW.
http://ecuadorreport.wordpress.com/2010/03/09/iran-ecuador-to-build-hydr...
Iran is just finishing up the most active hydroelectric building boom in the world (basically built one anywhere it was viable).
Literally hundreds of dams & run-of-river projects are underway. Chavez announced 40 more hydroelectric projects after the last big one is finished in 2014.
Grand Inga could supply the bulk of Africa's electric demand (40 GW, steady for 50 weeks/year). Add some geothermal, solar PV and hydro elsewhere (perhaps an extra nuke or two in South Africa) and Africa could go all renewable/non-carbon.
Kenya is about to put up the first large scale wind farm in Africa.
The alternative is not just natural gas.
Best Hopes for Renewables,
Alan
In the US, and globally, many existing hydro plants are reaching the end of their designed lifespans:
http://www.thenewamerican.com/index.php/tech-mainmenu-30/environment/1752
Environmental concerns not-with-standing, a huge investment will be required to maintain current levels of output from our hydro infrastucture.
Western droughts continue to limit the usefulness of many existing hydro plants (think Lakes Mead and Powell), and flooding millions of acres of forest and agricultural land will exact a price. Our global addiction to ever more energy (clean or otherwise) is an idea we need to rethink. Few really good choices exist.
They emit methane, too - and not just in the tropics: Extreme Methane Emissions from a Swiss Hydropower Reservoir ...
How dam emissions stack up in the greater scheme of CH4 emitted I'm not sure, part of the 10% from waste water?
The Electricity spreadsheet I link to at the end of the article has rundowns for most countries, if you're interested - 1990 and 2006 energy mix, by coal/oil/NG/hydro/nuke, along with some stabs in the dark by me of estimating how much oil they're burning for power.
I'm seeing a lot of crap lately attacking any form of storage-hydro-electric generation. The "methane emissions" angle seems to have been chosen as a particularly useful one, since its so obscure and intractable to quantification for most listeners or TV reporters.
Hmmm... at 16 grams per mole (22.5 litres), 150 mg ~= 1/90 x 22 = 0.2 litre per sq m per day.
"surface is approximately 3.65 km²"
http://en.wikipedia.org/wiki/Lake_Wohlen
total emissions = 3.65 x .2 x 10^6 / 10^3 = 730 cu meters / day.
One typical home in Canada uses about 4821 cu m / year or 13.5 cu m / day.
http://www.netzeroenergyhome.ca/Files/files/events/NZEH-Workshop-07-2007...
"A typical cow burps about 280 liters of methane each day."
So this reservoir is venting approximately as much natural gas as 730,000 / 280 ~= 3,000 cows. About as much as is used to heat 55 Canadian homes.
What the attackers of hydro generation need to also provide is the methane emissions of the alternative methods of heating homes in Canada. How much methane is lost to (wellhead / collection compressor seals / gas processing plant leaks / pipeline leaks / pipeline compressor seal leaks) each year to supply natural gas heating to replace the hydro electricity forgone by not building or renovating a hydro storage system? I do know that, for example in Indonesian gas fields, for every cu m of natural gas extracted and shipped, another cu m of CO2 is extracted along with it, separated and simply released. What's that ratio in N America?
A LOT of this stuff, especially anti-nuclear, is simply the fossil fuel lobby.
Len, good points all. to which I would add that there is considerable methane generation in natural lakes and in forests, from composting/degradation of plant material.
I would think that all the reservoir has done is cause a local concentration of methane emissions that would otherwise have happened throughout the catchment area.
In any case, hydro, properly done, is about the cleanest, and most renewable energy there is.
I expect to see lots of western environmental groups trying to stop the Africans from building hydro, but there are far worse things they can (and have) done to their environment than hydro.
Keeping the ramifications of developing any energy source in the open isn't an "attack". It's clarity. Whether the discussion is wind, hydro, solar, nuclear, etc., there are trade-offs that need to be considered (in an honest discussion). What effect did damming the rivers have on salmon populations in the PacNW? Does that mean that hydro wasn't a good option? Not IMO. Do we need to consider these costs? Yes. There's a difference between unintended consequences and ignored consequences, but they have their costs, just the same.
Well stated, Paul and Ghung. I've nothing against hydro, just throwing in the methane factoid; certainly there are much more massive sources of CH4 around. Done right it's very effective, and anything is an improvement over coal.
Gung,
Agreed that we need to acknowledge and account for these ramifications. However, more often than not, HONEST descussions do not occur, and these ramifications become sound-bites for the media(and thus the generally uninformed masses), fodder for the environmental extreme BANANA crowd, and so-on. This then creates (sometimes) unessessary road blocks, or even bogs down projects to the point they are abandoned. In fact, this is a tactic used by the BANANA (build absolutly nothing anywhere near anything) crowd to stop much development - wrap the project in so much red-tape, create so many obstacles, and generate the appearance of public outcry, that the projects become abandoned.
So IMO the key question isn't "can we discover/discuss the ramifications", but rather (as you pointed out), can this hold this discussion openly and honestly?
What format would these discussions take? in what forum? who mediates and who makes the final decision?
Oh the troubles I have seen as part of hydro projects in BC... truly "Absurdistan" But Enviro Tech said it perfectly.
As an example,there was a public information meeting about a potential run of river project in the BC Kootenay region in a small town called Kalso. One of the main objections is the project would occur in prime grizzly habitat. I wanted to be there just to make the point, "Did it ever occur to you (enviro objectionists) that this town, Kaslo, used to be in prime grizzly habitat?"
I have a very low hypocrisy tolerance level...
"I have a very low hypocrisy tolerance level..."
Then you are living in the wrong province, it is like that everywhere here (quite the opposite of what I observed living in Calgary). Some people here would object to the construction of an ikea chair!
Where I live on the coast there are several run of river projects under constr and proposed. People here say we don't need them as the power is just being exported. Even if this were true, they miss the point that every kWh exported is less tax we have to pay for health, education, roads etc. Of course the noise is loudest from retired people who make minimal contribution to the current tax base, but consume maximal services.
The R o R projects will continue to produce for generations to come - how many other investments can do that?
Grand Inga is just a bit more than a run-of-the-river project. Dedirect the Congo River into a nearby valley (displace hundreds of people) and then a large drop.
40 GW of almost steady power for 50 weeks/year (half of watershed above equator, half below, so contrasting rainy seasons).
Alan
A Grand Inga promotional site:
http://www.sapp.co.zw/documents/The%20Grand%20Inga%20Project.pdf
This may be a "Grand" solution to some of Africa's growth problems, including electricity, river navigation, irrigation?, tourism, etc. It seems that the loss of one of the planet's greatest remaining wild river ecosystems is a small price to pay for "progress". And the loss of many unique species to BAU is nothing new either. 40 GW trumps 40 species every time.
"I don't live in lakes. You're gonna need new fish"

It would not be a loss of one of the "great wild rivers", anymore than hydro at Niagara Falls has spoiled the Great Lakes.
Divert a few miles of river away from the cataracts (some flow there still) and into a valley with a few hundred people. Gain, renewable power for centuries equal to 40% of the US nuclear power fleet.
Wild overstatement,
Alan
Overstatement? I hope you're right, Alan.
Let's see: The Colorado, the Columbia, the Nile, a dozen Amazon tributaries, Three Rivers in China, the Hudson, even the Great Lakes system and the St. Lawrence, (shall I continue?), Tennessee, Ohio, Chattahoocee, Savannah, (dozens more) all have suffered the alterations of humans' ambitions. Beg pardon if I think that extracting 40 GW of energy from this river system may have major consequences to its ecosystem. I just hope it's worth it.
That 40 GW is otherwise spent on friction in the cataracts. A close analogy to Grand Inga is Niagara Falls, where 4+ GW is extracted at night and off-season. No reported effects except that the Niagara Falls will last MUCH longer before becoming the Niagara Cascade.
And yes, the reduced carbon emissions are worth 1,000 times the damage that Grand Inga will cause (i.e. trivial to nil).
Alan
"Thanks, Alan! We feel better now."

Dams are ecological nightmares, and need to be removed as fast as possible.
The idea of building more is madness, from a dying species on a plundered planet.
Ignorance.
Let us burn more coal instead.
BTW: Grand Inga is basically a run of river scheme with almost no storage. All it does is redirect the path of the river and avoid the cascades.
Alan
Gail, I must agree with you on this, I think the "dash to gas" for many nations could turn out to be a costly detour. Right now, the dash to gas seems easier than endorsing real renewable alternatives (sun, wind, geothermal) and there are big corporations pushing conversion to natural gas as the greatest thing since sliced bread.
The Germans seem to me to have the right idea...go ahead and bear the cost of renewable energy research and implementation...they know what it is like to be reliant on others (the Russians) for gas and know it is not a cure all.
RC
One thing I'd like to add because I think its important is that when I calculated oil consumption from atmospheric C02 data basically all the demand collapse in the early 1980's disappeared. Indeed oil consumption rose substantially.
There was a flattening then slight dip leading into 1980 i.e you can see some evidence of the oil Embargo and the Iranian revolution. But the vaunted demand collapse afterwards did not happen. This is on my blog you can get there from my bio.
Now as the 1980's wore on demand did fall off. and finally fell back to early 1970's levels. I argue that CAFE standards did play a large role however it simply took time for the newer more fuel efficient cars to grow in the fleet. Also by 1985 offshoring esp of manufacturing jobs was gaining ground this also finally caused a slight decline in fuel consumption then flattening for a while.
Now this is interesting because it political.
Realistically there is only one place on the planet at the time that you could have gotten a 3mbd or better surge in production sustained for about five years.
Thats Saudi Arabia.
Not only did they not cut to the bone to support oil prices but they surged production significantly over what they had produced before. I suspect the Iranian Oil crisis and CAFE standards and overall peak oil concerns of the time scared the piss out of them. Also it seems they where tied politically with Reagans war against the Soviet Union their other rival in production. All kinds of very interesting politics going on at the time. Including of course nationalization of Aaramco.
My best guess is they produced between 12mbd-15mbd over the course of 5 years while claiming close to 4-5mbd or so.
10 mbd is about 3GB a year or so over five years is about 15GB
Now you can see why I brought it up :)
If I'm right then Saudi Arabia is significantly more depleted then the official numbers suggest.
Going here
http://www.theoildrum.com/node/2476
We can subtract 15GB for a remainder of 50GB.
That was about 3 years ago and being conservative assume its now 2GB for another 6 off puts them at about 44GB remaining.
44/175 = 74% depleted
Saudi Production should indeed be crashing and has been for some time.
Indeed if we take 60% depletion as a reasonable estimate for peak like WT uses then they basically peaked in declined effectively in lock step with rising prices.
Now a bit of common sense suggest that its difficult to change oil demand rapidly as its a infrastructure product. Fantastic claims require fantastic evidence not claims. VMT data from the period show no dramatic change. If all these resid uses collapsed then no way where people driving to the jobs formerly powered via residual fuel use. Switching to NG is expensive and non trivial as a significant amount of infrastructure is needed. I'm not claiming we did not eventually conserve and fairly dramatically it simply took almost a decade to make bring oil consumption under control. This claim is very reasonable and doable and fits will with the adoption of NG and CAFE standards. It makes sense.
Now if the last great period of demand destruction was basically a hoax then you can see why I've very skeptical about this time around. Again I'm not saying conservation has not occured indeed with my calculation we are well past peak by about a decade and 10mbd. If the supply is not there its not burned thus conservation was forced on us. But just as back then I expect that actual changes this time where mild i.e demand simply does not change fast. Now this does not mean we did not have a demand collapse inverse spike at the height of the financial panic and with hurricanes wiping out supply. Plenty of data suggest we almost had a short panic where commerce ground to a halt. However as I've said before a good bit of this was delayed demand that eventually was met later. Since the panic was short and deep it played a role in allowed a significant surge in oil to build. This combination of real physical oil and financial Armageddon collapsed the prices. I also see hints that perhaps large quantities of oil where stored in the first half of 2008 and dumped on the market. A good bit of the last part of the price spike could well have been the result of deliberate storing of oil stressing the market even more then dumping it in concert with the US's actions against Lehman and Bear Sterns that sparked the economic collapse.
Now its important to understand that it looks like a fairly significant amount of real production I think about 1mbd or so was with held for about six months. Assuming it was pumped and stored in tankers all during the first half of 2008 you get about 180 million barrels of oil. Figure the collapse freed up and additional say 50 million barrels of oil during the demand revers spike and also that you have 1mbd brought back online. Your talking about roughly 400 million barrels of oil. Created with some pretty fancy footwork that almost collapsed the world economy.
And who says you can't get blood out of a turnip ?
Thus even with my outrageous claims I can actually figure out a way to create a huge surge of oil at the height of financial calamity that ensures that the collapse in prices also has strong support from a veritable flood of physical oil.
We no joke had a glut. And of course the economic contraction certainly impacted demand even if it was smaller than most people estimate. It as still significant say perhaps 1% or so our about 1mbd globally.
Of course like I said it looks like KSA is in steep decline my C02 data suggest the world is itself declining at about 1mbd and you have export land. The exact times depend on all the numbers but obviously this trick only buys you about 1 to 1.5 years before you hit the wall again. This time playing tricks is not viable and I suspect the attempt to cool the economy got a bit out of hand last time.
But within about a year or so your running about a 1mbd deficit. Once it approachs that you have about six months at most before things get very very tight.
Tin Foil ?
You betcha I like to call it Lead Foil tin does not do it justice.
Regardless of the accusations I think they fit very well with whats happened and also if correct paint a good picture of the future. This story if you will which I call the real oil supply fits very well with history and explains a lot of things.
Indeed the irony is that KSA's tricks way back in the 1980's to prevent a steady and aggressive move off of oil ala Jimmy Carter play a big role in eventually causing our current situation. Not only do I think its probably very close to the truth it has the added bonus of showing the danger of creating a moral hazard. Eventually you will pay.
Does it matter sure. Demand did not drop much and by now natural growth and falling production coupled of course with export land ensures that the oil supply is even more constrained. Also although its too early to tell I am seeing signs that we potentially left our slow 1mbd decline curve for a much steeper one over the same period. The shenanigans certainly cloud the picture and diving monthly C02 data is just that diving.
http://www.esrl.noaa.gov/gmd/ccgg/trends/
However the slope of the C02 data post 2008 seems to have changed and we see a number of surges along with what I contend was withholding at the start of 2008.
The surges probably represent concerted dumping of oil I suspect a effort was made too deliver a good bit of the oil rapidly to flood the fairly just in time supply change.
Next we do see a sharp increase in the recent months. However for now at least given the record breaking cold spells I'm not convinced this is oil but a surge in coal and NG usage. For C02 you have to have all three to figure out oil.
In any case my best guess is that right now worldwide consumption is running about 2mbd above baseline production and most of the excess blood from the turnip is gone. If you include net exports its probably a bit worse perhaps 3mbbd deficit between consumption and production for importing countries. Almost all of the deficit is of course concentrated in importers not producers with consumption changes in exporting countries almost imperceptible.
Thats a big number.
2mbd for 6 months is 360 million barrels or about the same as a weeks worth of consumption by the world or about 20 days of US consumption and on the same level as US storage capacity. The US would have to go cold turkey and not use a drop of oil for 20 days every six months to bring things into balance.
Obviously soon demand has to be brought back in line with daily supply this large and imbalance cannot be sustained. Worse its between 2X and 3X the shock level we experienced when oil went to 140. The shock was withholding of about 1mbd or so rapidly near the end of 2007 first part of 2008. I'm betting on it actually being close to a 3bmd imbalance this time around.
Whats really wild is this actually fits well with my estimate of what oil prices would be if the US was not lying about its storage levels. Right now they are at 80 with the US claiming its well supplied and above the 5 year range. Assuming they would double if we admitted to being in the middle of the range then it would be 160. At the bottom of the range 240. Really we probably have been floating somewhere between the middle of the five year range and the bottom. Only false data is keeping a lid on the truth.
However if I'm right times up and this imbalance has to be resolved and several approaches suggest that it will take a rise of oil prices to around 300 a barrel to bring demand and supply into balance. 300 dollar a barrel oil will cripple the global economy enough to destroy this 3mbd over demand. For the US if it was shared fairly evenly with the rest of the world your talking about a 5% contraction in demand or so just to balance. Even assuming 140 resulted in a 3% drop your still needing 200+ oil just to balance. I think 140 was really 1% so 5X that is 700 ! Big number yes and of course probably well over but these are the sorts of numbers we seem to need simply to balance.
And thats not to cause the price of oil to drop thats to squash demand that simply cannot be met as the oil simply is not there. Of course from then on out further production declines will force prices higher and if oil did hit 300 one has to imagine export land would get a turbo boost i.e. If I'm right about geologic decline already having doubled from 1mbd to 2mbd perhaps it increases again if it did finally make the sharp turn off the back side of the shark fin then its accelerating rapidly.
My point is you really cross the rubicon if you will as prices approach this level with acclerated decline rates and export land ensuring oil become rapidly more scarce in importing countries they basically cannot collapse fast enough to stop the price rises much less induce another surplus. Of course other economic and political factors will come into play probably destroying the open market for crude at some point in this scenario but there is no real return path and little chance of another collapse outside of one that leads to real economic destruction and the system falling apart.
Sure I could be a bit off who knows but if I'm even close to right we will find out very fast. Already things are looking interesting and of course given my scenario they should worsen rapidly. My best guess right now is the US will fake it right up till people are having problems finding gasoline. If so then things get interesting really really fast as the US would be forced to come clean about its real storage levels. With that said my best guess is the US will instead covertly drain down some of the Strategic Reserve and allow its "storage" to fall at a slower but rapid pace. No outages and no panics but still serious pricing pressure. At best I figure we will do maybe 40 million or at most 100million draw down. Obviously we need the Strategic reserve shortly there after because we could well really be having problems if not war. Perhaps a bit more we have 700 million barrels. However I think the military will get concerned if we slipped out much more than 100 million barrels. Given this is covert if you will it could well already be underway. Remember this is lead foil thinking however also remember the strategic reserve is for dire emergencies and although price would not show it at first obviously this would be the first action in anticipation of a oil emergency.
Its not really all that tin foil hatish really as its what its for.
In any case this is basically a military exercise at this point. For lots of reasons we can assume it already started. I'd try and keep prices low through the winter as much as I could simply because running out of heating oil is dangerous. Also do my best to allow the farmers to get the crops planted. However summer demand is really recreational and the lest important to the functioning of the US economy. Thus I'd let reported supplies fall steadily and rapidly in the summer ensuring price increases primarily nipped summer fun driving in the bud. If needed in the fall diesel can be rationed to farmers. Indeed the if I'm right about store and surge in 2008 its pretty much exactly the time regime followed as it makes the most strategic sense. Same game this year however this time around its the Strategic Reserve providing or provided the surge just depending on whats really going on.
For oil at least this puts use in emergency mode I'd think sometime in the fall.
From that point on oil supply would be a political military issue not really financial.
This is my best guess overall about real oil and real demand. And it suggest that if I'm right then things are falling apart right now. If I'm wrong then price would probably not rise much above where they are now as that implies the public data is the truth and we would be lucky to see 100 a barrel again if that for years. So its either now or 2-3 years out with a growing economy before oil prices become seriosly problematic i.e 150+ and of course the demand contraction claims are real and they would then fall again perhaps back to 80 or so this time. And the cycle would probably repeat again taking 3-4 years to reach new highs etc.
Your talking ten years or more before 200+ oil and obviously this is plenty of time for conservation to work its magic as it did last time. This time of course it means EV's and or NG and other real alternatives as simple fuel economy measures are not enough but there is a reasonable amount of time and price pressure required to get efficiency levels up. Real economic growth would be a problem but in 10-15 years the steady move off of oil would finally allow oil independent growth to resume.
I don't believe any of the above but my point is that the scenarios diverge dramatically right now. One will be true and one false. My deficit estimates require a 1mbd+ difference between supply and demand that can only be solved with punishing price regimes. It fundamentally requires this sort of gap to be true.
The official story requires really at least a 2mbd or so surplus and fairly price sensitive demand over certain price levels. They are simply completely different scenarios.
WT's export land potentially includes a lot of this already you can't simply add it directly on top. There is a good chance that some of the claimed demand expansion in produces is really simply hidden declines so there is some overlap depending on the nature of the truth and lies. Same of course for magical Chinidia some of the claims may well be bogus and both the exports and the demand growth simply does not exist. I'll actually be in Bangalore next weeks so I'll use my own beady eyes to checkout out our magic consumers. I used to live in Shanghai so I know the Chinese are lying their ass off I saw their faux economy with my own eyes.
Sorry for the long post full of all kinds of craziness but for now it looks about right. And as always it remains one that will fail over the next several months.
The test is happening right now. So far at least its still very valid with oil prices already pressuring their highs. The next couple of months will go a long way to proving me wrong. If I'm right then there is a very high probability that we blow through this 80 band over the next few months. That does not mean they go right to 300 remember its a con/shell game it goes till it fails. However moving into 90-100 at least before launching goes toward not disproving it while if we stay trading around 80 for two months what I'm saying has serious doubts. I'd really like to see a fall back towards 60-70 as thats viable with the "official" story and probable if we approached the higher 80's and OPEC got a bit carried away pumping. I'd happily go back to the drawing board at that point I assure you.
Enough thoughts from the edge :)
Memmel I love your theories, but I really do not have as much have time to read them as I would like. Sometimes lead foil does not seem strong enough. Castles in the air comes to mind.
If we are to revise global production numbers from the 1980s to this extent based on atmospheric CO2 levels from that period, (If I have picked the key paragraphs) then I'm sure the scientists over at realclimate would have something to say about standards of scientific evidence.
We have to use some historical data as valid, or we are all floating in a sea of conspiracy, from which we can only say 'I don't know what the truth is'.
You are astute, but you have so many theories they end up washing over me.
@RalphW
Just as a starting point, you might want to consider:
"Shortcomings Exposed in Oil Data"
http://online.wsj.com/article/SB1000142405274870352320457513014139249386...
Or such things as the Gold price has been manipulated for decades by central banks (plenty of smoking guns)...or all the fraud and manipulation in the financial world that is coming out in the open every day...
Why would this not happen in the biggest game of them all: oil ? Does anyone really believe that all the oil data out there is accurate and believable ?? Gee, most of it is probably not, starting with reserves!
I urge you to read my paper I focus on the 1980's and now because of the political and social implications. They are important because of this.
But as I've mentioned in the thread. We did enjoy the benefits of conservation to a level higher than is publicly announced. All that hard work in the 1970's and 1980's paid off handsomely and clearly by 1985. Its not as one sided as I seem although obviously I focus on the most important pieces. Once enough time had passed we did make huge gains. And it resulted in a long era of cheap oil until the SUV craze really started. On top of this technical advance where making a huge contribution to oil supply at the expense of rapid depletion.
So the actual data is not as crazy as my posting its just the other parts are not that important in the sense that as the price eased it simply became a natural market. Prices rose consumers made efficiency gains eventually reducing demand and slowing the rate of increase.
Nothing that interesting when and how it happened is whats important not that it happened. I just don't think claiming that for the world to significantly change its efficiency as population grows takes decades is some sort of astonishing fact. Its sort of a Duh.
The claim of some dramatic drop is the problem not the obvious alternative answer that my data supports.
In general oil production and consumption simply don't change that rapidly its a slowly varying system the time scale is really 3-5 years i.e it takes at least 3 to five years for anything to have changed significantly. Even our current post peak decline has generally followed this slow ponderous change with clear trends visible only after three years of rearview mirror data.
The areas where this does not hold are pure political fabrication and complete lies. This is important for us of course because people believe the lies. Other than that the data is really surprisingly bland in the sense that it simply does not change that much that fast.
Now with that said you can clearly see that we seem to have had a real peak oil event in the late 1970's early 1980's and it was not just US peak it was a global land production peak and real. We absolutely had peak oil then no joke. But we had the incremental addition from offshore development and Alaskan and probably more Siberian oil coming online as they where profitable at the higher price points.
We no doubt about it had real honest peak oil its just that it was not global peak but peak land oil if you will.
Conservation, Offshore, artic oil and technical advances worked to buy us decades more time before the final global peak but thats all they did. The chances of the last realistic increment deep water, tar, polar oil resulting in production high enough to reach new peaks is slim much less offset decline to any significant level. Now we are facing our second peak which is peak technology, offshore and final serious decline of onshore production and much higher absolute production levels.
Thus all we did in the end was take a solvable problem and make sure on solution was possible.
But if you take anything away from what I'm saying then it should be this oil supply and demand do not change much on average. The start of a recession or financial problem introduces a very short term negative spike in consumption measured in months i.e. 3-6 then its BAU from then on out no matter what the price of oil is. If higher prices do result in significant conservation then it takes years for it to really grow to be effective. All the other stuff is simply political noise. Now that does not mean we are not in decline now we obviously are and have been for some time but this has been reflected in the price for most of the period as conservation could not keep up with the decline rate. So the hotspots are of a lot of interest because of their implications but oil is really really boring otherwise nothing dramatic :)
Indeed memmel. 'Peakoil land' is considered for the year 1985.
The last 10-20 years most of new oilprojects that came on stream were offshore and relatively small fields. As most offshore fields decline rapidly after 10-15 years of production, to be expected is at least 1-2 % decline past peak. You argue that considerable decline allready happened, but still the amount of spare capacity from OPEC is uncertain. I'm puzzled by the phrase: 45% of oilproduction comes from 190 Gb of 'easy oil'. Does that refer to oil from pre peak fields ?
This depends on other factors. If high oilprices result in a recession it can go fast. Between august 2008 and march 2009 a lot of airlines went bankrupt. Freight exportation with ships and by air dropped a lot. This took months not years.
And other companies got their business. A lot of this is delayed demand.
Effectively what happens is a Recession generally starts in the financial world not the real world as some sort of cascade of bad news causes financial fear. This fear causes two things companies simply stop many business ventures pulling out of deals that are in the works etc. Next of course since most are highly leverage their access to debt drops dramatically overnight.
This is not demand destruction and this is where people have made a big mistake they don't get it. A lot of this demand was real the deals valid the debt manageable etc i.e a lot of real business producing real goods for real markets. Or better commerce.
Thus a good bit of this demand is simply delayed demand and in general you get a build up of deferred business that actually needs to be done.
In any case once you get over the financial shock effect the variation in oil usage is driven by a number of factors related to the details of the financial contraction.
In our particular case the primary real effect aka biggest impact on oil was the collapse of the construction industry. This is demand that will not come back.
In general I like to use VMT as a guide of the impact on oil usage through a recession. If it continues to grow then the impact is probably weighted to the FIREM economy with M being medical. These businesses make immense amounts of money with very little oil usage ( Or it looks that way). Other industries like the Military also have to be considered Aerospace etc as you go back in time. In short every recession and depression is unique and unfolds according to the details of the economic system of the time.
In short the devils in the details after the initial financial crisis common to modern debt based systems. Who's swimming naked when the water goes out and how much oil do they use.
Very delayed. By the end of 2008 the number of ships I saw on the sea from the island I live, was down dramatically. It was at 30% or less. And now in 2010 it is still a lot lower, at least 50%. Exportation from China and Japan dropped a lot from 2008 on.
I think it is difficult to deny that oil consumption is still lower than in the first half of 2008. In a normal BAU scenario, oil consumption should now have been 3-4% higher than 2 years ago. Even if the EIA oilproduction numbers a wrong and OPEC is cheating (and they are, they produce more than their announced quota) the fact is that exportation of goods is down. Demand for products has decreased. Also with $70-80 oil people (have to)spend considerably more on energy, food and other basics than in the cheap era of oil. This diminished oil consumption will be offset by rising population and for example rising car sales in China and India, but it takes a few years before oil demand is back at the 2007 level. Soon it will become clear how much spare capacity OPEC really has. IMO not a lot.
Memmel
I agree with you.
I go back to the megaprojects database
If you take average additions up to 2009 you get 3.98 MBD/year
2010 - 2014 = 2.68 MBD average
so we have been able to keep on the bumpy plateau of 71/72 for the past 5 plus years by adding one Saudi Arabia every two years - 8 MBD
in 2010 the picture changes dramatically
I think Matt Simmons will be right - but a year late. The magic $200/barrel will hit in late 2010/2011
but whats a year, in the 200 year cycle of the industrial revolution
That would be "Supply Side Economics" then ? :-)
Mike - will try and respond to more of your details in a minute here, but first I'll let on that I too was baffled by the apparent non-conformity between the Keeling curve and emissions data from the EIA etc. The reason for this is due to variable influence from natural sinks. A good page explaining this is CO2 measurements.
Similar charts are found in published papers. This guy also demonstrates the strong correlation between emitted and observed CO2. It's surprising how widely the negative sinks can operate; the relatively minor drop in emissions from the early 90s was met with a much more pronounced drop in observed CO2. This could be a problem with a renewables/nuke buildout - suppose we plow all this money into feed in tarrifs and have nothing to show for it in 5 years? But that would be the least of our worries.
Like I said elsewhere in this thread, we were literally "wasting" oil on all sorts of extremely stupid, yet convenient, applications. Like spreading oil on dirt parking lots to suppress dust. I was a kid at the time but I remember my Dad pointing this out to me, and started paying attention to how we wasted petroleum.
These were all applications of oil that did not contribute to CO2 production, as the oil just got dispersed in the environment. We don't want to admit to it due to embarassment, but oil flowed like water during those years, and we really didn't do anything about it until the crisis hit.
Thats basically the approach I used. The assumption I made was that the sink was linearly related to the source. Its a pretty good one as if we had a non-linear relationship then we would be flipping in and out of a glacial/hothouse conditions.
Very dang close man cool paper. But all I did was solve for Oil using the the known production levels of the other sources Coal, NG and and estimate of non oil per capita emissions that grows with population.
Since I used a big ugly constant or correction factor as long as the other unknowns where fairly small and proportional to population then it all works.
In any case the detail are not critical its really simple if China massively ramped Coal production and we have our current C02 levels then Oil had to go down.
You can play with the approach all day long but you can eyeball the answer.
Esp given the paper you quoted as its effectively the same observation I made.
Now I think you might be concerned about the variability of natural sinks but this averages out over a year with the exception of Mt. Pinatubo which gives a striking example of the strength of natural source can be. One note there while I'm at it certainly the sulfur emissions have a cooling effect but also all that volcanic ash is deposited eventually in the ocean acting as a fertilizer boost goosing natural C02 absorption.
In any case the difference between claimed Oil production and my calculated one is large on the order of 10mbd in both places there is a serious difference. This is a perceptible change and equal to the US cutting its oil usage in half.
The first place is here where this paper is using what I believe are simply fraudulent claims by the US about oil usage. Which is why I mention it because if this demand change never happened a lot of assumptions are blown out of the water.
And the second time is now.
And last but not least my calculated oil consumption is perfectly correlated with price.
That last little correlation is in my opinion the most compelling part as no way could I have matched prices using this approach.
And the next thing and this is in my opinion very important. There is always demand for oil no matter what. This fact can be seen in declining per capita oil consumption over time. Thus even our "cheap" oil was priced high enough to price some potential demand out of the market. Competition for oil is fierce i.e plenty of potential demand exists at all price points oil has not been cheap enough to meet all demand for decades. There is always a reserve of potential demand ready and willing to use large quantities of oil at a given price point.
This is in my opinion completely obvious if you look at per capita demand in producing nations where oil prices are heavily subsidized its higher than the US and close to what it was in the US in the 1950's. To actually saturate demand globally you would need oil productions high enough to meet that level. Not sure exactly what that would be its easy enough to calculate but like 10 times higher than current production or something. Pretty insane. But my point is thats the latent demand level for oil all other price points result in demand destruction and the are high enough to eliminate potential uses.
Now thats not to say there are not demand shocks and that public policy cannot slowly over time introduce real conservation. Both are very evident the US did increase its efficiency and reduce its dependence on oil. But its a slow process.
Other than that the shocks basically serve to temporarily push demand forward resulting in a short term surplus if supply are relatively constant over the period of the shock that is reduced as demand rebounds on a natural curve.
The trick is pretty simple the shock is generally fast and hard stalling the economy. While the rebound of latent demand takes time and is a much longer process it does not just snap back but takes about a year or so to recover.
But all it does is shift demand forward and spread it out a bit overtime.
In the 1980's this was met with increasing supply from KSA in 2008 this was solved with a magic blood from a turnip trick by with holding some supply forcing prices higher and suppressing demand then unloading the oil and shocking the economy via overt manipulation of the financial system by taking out a couple of TBTF's.
Of course no one questions why the US felt it could take out Lehman and Bear Stearns to critical financial institutions then turn around and save other ones that where too big to fail and critical. Either they had a epiphany in the process or it was deliberate.
People are correct in comparing now to the 1980's however the truth is that a very similar set of lies and deceit are happening now as happened then. However this time around we don't have excess capacity from KSA to play with it had to be manufactured literally out of thin air playing a game that brought us to the brink of economic collapse.
Its all about oil but the game we are really playing is different and more deadly than most realize. The myth of the great demand drop in the 1980's sets at the heart of the current complacency about our oil situation but the problem is it was simply a myth it was not real then and its not real now just some games to keep the oil addicts happy and spending.
Memmel, I raised a question about the 1978-1982 period in Drumbeat 12 march and this was one comment:
How does that fit with 'a myth' ?
Well 55 was set in 1974 the great drop was several years later.
http://en.wikipedia.org/wiki/National_Maximum_Speed_Law
Don't forget your wedge how many new cars how many where high mpg cars ?
Yes they showed up but whats the impact. Whats the impact of the Prius now turns out on a precentage basis its practically noise despite the fact they where "common" in Cali.
Where was this person located ? He mentions the Bus to work and cold maybe Chicago, Boston ? This is a long period of time was the bus packed before ?
I suggest perhaps you read some of the comments on calculated risk anecdotal evidence abounds giving all kinds of different snapshots. Some people report packed malls and restaurants others ghost towns. It depends.
What I said was according to my data it was not till about 1985 before usage actually declined. These early attempts at controlling usage probably started as early as 1974 with the the first oil shocks however it took basically ten years before usage finally fell off. Conservation certainly started during this period and obviously you will see evidence of it and well you should however the question is when it actually was effective in reducing usage. Understand that in general the natural trend was towards a steady increase in usage I'd have to look but for the US it was pretty dang close to 1mbd per year increase before the shocks perhaps lower say 500kbd but US oil usage was increasing at a healthy pace into the Embargos. By 1979 you had five years of flat to falling consumption against a natural trend that had been rising strongly. Once the cheap oil showed up it was party time.
And understand this is global data not just the US world wide when oil got cheap demand increased dramatically. For the US itself there simply is no way the rest of the world used the large increase plus what the US has claimed to decline.
Your talking about close to 10mbd thats like another China importing oil. Thus US demand had to have rebounded as prices dropped. Now I don't know why this person extends his claims to 1982. Prices where already falling.
http://www.inflationdata.com/inflation/Inflation_Rate/Historical_Oil_Pri...
Now if you look at my blog and this price Chart prices fell in 1986/1987.
And if you look at my chart this is when demand had fallen to its lows after declining from a peak in I think 1983. Yep looked at my spread sheet when prices had fallen to 29 from a high of about 37 or about a 20% drop in prices.
Thus as prices fell demand rebounded imagine that. However it also then started falling from its peak in 83 till its low in 86/87.
Don't forget the stock market crashed in 1987. The deflationary contraction was 83-87 at least as far as oil is concerned.
Certainly you could see signs of conservation before this but it was not til 1983 that the growing fleet of japanese cars and switching to NG actually caused oil consumption to fall or did this even happen ?
http://tonto.eia.doe.gov/dnav/ng/hist/n9140us2a.htm
Whats interesting is it looks like NG consumption also fell as oil consumption fell. If people where switching off Oil then it was not to NG as it was also falling. Funny we have this claim of a massive switch from residual oil to NG yet NG consumption was flat to falling over the same time period ?
I don't have a handy graph but you can go here and look at GDP.
http://www.measuringworth.org/usgdp/
Per Capita GDP definitely declines over 83-87 inline with Oil and NG usage.
This actually also fits fairly well with what we are seeing now the recession is after oil prices peak and decline.
Intrestingly enough seems to correlate with rising housing prices in this case.
Just poking around the "industrial" economy certainly declined from 83-87. Conservation measures had been enacted long enough that a wedge of conservation was helping in finally causing real demand drops even as prices fell.
Supposedly the GDP bottom in 1982 but it looks like a housing bubble was helping a lot in causing a rising GDP even as oil consumption was falling.
I should look more at this. I have global peak at around 1999-2003 it was basically a undulating plateau. Whats really interesting is this also corresponds with when the housing bubble went really insane i.e as consumption fell after 2003.
In this case prices rose this time around.
Looking at interest rates.
http://www.federalreserve.gov/releases/h15/data/Annual/H15_FF_O.txt
It looks to me like falling interest rates spur financial speculation to cause a sort of fake growth as real oil consumption falls.
The periods of so called growth and falling oil consumption are well correlated with falling interest rates and equity bubbles in housing.
Actually this fits very well with my basic thesis which is people cut back on everything else to buy oil. This shows in the GDP as a recession. Eventually they even conserve oil gasp. These born again savers where not spending thus interest rates where steadily lowered to entice them to buy into housing bubbles and empty their bank accounts making down payments on houses.
Actual true wealth seems to increase near the bottom and for a time after the bottom as the new conservative consumer class saves and builds a solid foundation.
Inefficient business's have been closed and "good" sound old fashioned commerce is building wealth. Then the feds spike the puch bowl and off we go again.
But its not surprising at all that the results of a the reaction to high oil prices lag the actual price peak as it simply takes time for the efficiency gains to build to a level that is meaningful. You of course are very perceptive of the start of such measures. I.e first Japanese cars on the road weather stripping etc. But only when they become so common place that you don't even notice have they reached a level to actually have a real impact.
This can be seen in this older post.
http://www.theoildrum.com/node/2095
The first is the change in efficiency for the fleet the second its year on year percentage change.
You can see that both maximized after 1985 i.e the bulk of the efficiency wedge actually hit well after the peak in prices.
Some of the data used in that report in particular Gasoline supplied is suspect using my numbers. The VMT is good stuff and I rely on it.
Basically gasoline supplied really increased with VMT until the efficiency wedged kicked in during the second half of the 1980's. If you read not that overall car sells fell significantly during 1979-1980
As far ass I know your car gets the same mpg or less until you replace it.
I'll stop here read for yourself however I'd argue if you accept my corrected oil figures then everything lines up very well the one number I claim is wrong which is gasoline supplied is the one that does not fit well into the calculations when you consider VMT New car sales and fleet MPG.
Again understand new car sales fell dramatically and many of the fewer number of new cars bought where shiny new Japanese cars. same for most of the other observations we are very perceptive of course of the beginning of a new trend however the efficiency wedge means the benefits happen much later when they new is common.
I should really set down and compare and contrast the two periods now and then some things are the same i.e the Fed spiking the punch bowl as usual and some things are different i.e new car sales are hurting still.
Residential deliveries of distillate crashed in the late 70s, but gently rose thereafter and peaked in 1988 before declining for good. You can see long term numbers in the Petroleum section of the AER. This was right when NG deliveries to residences took a slight uptick, but note that those have always operated in a fairly discrete band anyway. Other factors that would account for a decline in demand here could be contraction of the housing stock, people living together, using alternate forms of heating, or doing without. Likely there's a study of this somewhere.
As for the rest...you realize there are penalties for failing to report data in a proper fashion, right?
It's simply not in the interest of operators to fudge this info, not on the level of movements of bulk supplies anyway, they are too busy and what profit would there be in it in the first place? Certainly refiners often dodge safety issues, or pipeline operators may stave off important repairs, as BP did with the TAPS; but a heating oil company isn't going to attempt to report higher or lower deliveries; and if one of them did, how does that make them collectively act in concert? So, for me, most of these wild speculations of yours are much too far down the rabbit hole for me; usually there's a far simpler explanation to be had.
Now you pissed me off. Why do you have to resort to misrepresentation and logical tricks to slander what I'm saying. I did not say that and never said that and your wrong to represent my argument this way. I'd me more than happy to debate what I am saying but there is no reason to set up a straw man argument to prove me wrong.
I've said the Government LIED not that they did not have the real data and not that people within reason reported real data. The final report from the government was flawed not the input data. The political impact of convincing Americans they could easily get of oil and had flexible demand while keeping them hooked and suppressing real alternatives is immense. Heck the fraud is working fantastically even to this day obviously. Indeed they are trying to run the same trick pony right now.
Worse your not really paying attention to what I'm saying and understand its implications.
I'm saying that something like 7-10mbd of oil was pumped and consumed and unaccounted for. The primary culprit is Saudi Arabia. This oil was purchased by Americans for a high price.
Billions of dollars flowed like a river into Saudi Arabia. Where did this money go ?
Well what do you know we have deficits don't matter Reagan issuing debt like no tomorrow and fighting the war against the evil empire. Who bought these treasuries ?
Saudi Arabia or more correctly the royal family. Not only did we pay we paid a very nice interest rate and booked it as debt against our government.
This is the birth of the real fiat petrodollar today.
Not only are your using dumb straw man arguments your not even attempting to understand what I'm saying its a hell of a lot more than simple fraud its literally the basis of our current monetary system itself.
Follow the money and you can see why I have no problem making outrageous claims the act was itself outrageous. Reagan literally sold out the US and ensured our eventual destruction. We got conned beyond our wildest dreams. Once I realized the scale of the deception it did not take long to figure out why and how. If you would even bother to understand you will realize just how damming my claims are.
I don't know. Only thing I know is that the person is 'WNC observer'.
He also wrote that unemployment was rising.
However oilprices were falling, world oil consumption dropped also, until 1983. Because of the recession.
Your statement that KSA produced maybe 14-15 mbd that time is more than remarkable. It means that the published oil consumption numbers from that years are not true, though there was a recession, which makes less consumption the most logical outcome.
VMT bottomed out and as risen through a good bit of our current recession.
Oil usage dropped the first year of the Great depression and rose there after.
In general during a recession people are going to improve their productivity to work their way out. To work they need oil. And this includes people laid off from jobs etc.
I'll give you my own personal experience so fat as I'm unemployed. To date my consumption has changed very little indeed as it warms up I'll take the kids on local day trips around the area for vacation. My oil consumption is nominally higher however I'm not staying at hotels or eating out but going to free parks the beach etc.
I suspect I'm not the only one that will take this route. Also of course as I look for work and try to get consulting gigs to stay alive my oil consumption on that side depends entirely on effectively random variables. So far at least it meets or exceeds my previous usage levels.
My point is as your financial situation becomes more precarious you leverage oil as needed to make a buck. Making money invariably requires oil consumption even attempting to make money does so.
GDP does not reflect the fact that I cut spending on extras and focused my outlays on two things. Readily paying for gasoline or other oil products as needed for even the chance of a net positive cash outlay. If I had the chance to drive across country on my own dime for 10k at the end I'd do it in a heart beat. If I won a free trip to Hawaii but had to pay only for the hotel I'd decline.
GDP records this change as negative i.e in general I'm looking for net gains in money I'm no longer a source but a sink. The source is of course people who still have positive cash flow who I offer to work for at ever cheaper rates. I.e they see a really good deal they should take.
The theory people have is that when the GDP is contracting its because people that lose their jobs go set quietly in a corner or I guess set around and watch TV.
I hate to break it to you but we don't we are out hustling cutting deals doing what ever it takes to stay alive willing to accept any deal that has a reasonable chance of making a buck. Doing my best to stay alive is as I said a negative in the GDP calculations as I'm a sink not a source. However underlying my new status as a money sucking sponge is oil burned for hopefully net positive cash flow.
Now if the money I make was paid out of a savings account I.e someone with money paid for my services then the savings rate decreases. No net increase is seen in the total amount of money its simply redistribution of existing wealth. In general the money I receive that is spent goes for necessities rent food gasoline! etc.
Part of the money i.e rent could end up paying down a mortgage thus offsetting a fractional lending debt. A portion of the money I spent for gasoline ends up paying for imported oil. This creates a trade imbalance if if its cannot be met with exports it generally ends up in the form of buying treasuries.
My point is your logical assertion is not logical but naive overall in general the relationship between oil and money changes during recessions its not a simple case of contraction of the GDP results in lower oil usage. In general its more that the oil burned often results in some sort of redistribution of wealth for a lower net gain in general and if your and oil importer worsening trade deficit for oil.
Certainly its hard on the financial system based on fiat currencies and fractional reserve lending and the net wealth creation is probably negative as savings of all forms are generally converted to the purchase of commodities however recognize that the relationship between GDP and oil usage is highly non-linear. Almost certainly falling pretty much in tandem at first but converted rapidly into attempts to use oil to keep from ending up on the street.
I'm a computer programmer and work at home my oil usage was already at the bottom so its got no where to go but flat to up. Indeed if I'm eventually forced into a real job then its up. And this has happened in the past as I've taken horrible commutes just to work.
This time around I'm done and will be tuning out of the economy if you will but thats a personal decision.
Yes through this I've used my own situation as a metric but you will find plenty of other people making all the same decisions if you as or depending on your circumstances you will be making similar decisions. In the end staying alive requires a certain amount of oil regardless of what happens to the GDP. Thats a fact how its achieved and how it effects the GDP is almost irrelevant.
Only certain if one can prove that KSA didn't cut production until august 1985 to control oilprices.
I would say that I agree with memmel, if it is certain that increased use of coal
from 1973 on didn't count enough for rising CO2-emissions.
Whats the reason for the trend increase in natural sinks? that they are becoming saturated?
I suspect a lot of that trend is form Pinatubo in 1991.
http://pubs.usgs.gov/fs/1997/fs113-97/
Also happened to blow right in a recession when human C02 emissions generally at least slow their growth rate. Its a huge event and you have to work your way around it. My data is also wrong around this period because of this.
The 2000 plus data is simply wrong because the C02 inputs are from summing the reported Oil, NG and Coal production. If you used my corrected numbers then you will see we have been saturated for a while probably sometime in the 1960's emmisions saturated the natural sinks. I don't have good data back then no one really does. Suspect data from the early part of the series also plays a big role in showing and increasing sink. I'd throw that out and throw out around the volcano for sure. Finally and this is probably the biggest source of error I don't see that non-fossil fuel C02/Methane emmisions are accounted for. Methane of course oxidizes fairly rapidly to C02. There are estimates for this value I used one in my paper in general they are relatively close. But these trend with population. As far as I could tell this graph was also not corrected for this.
These are agriculture related emissions i.e changing land use burning land to clear it and wood for fuel etc etc.
The paper mentions it.
The problems with the pre 1970's data sets are well known. No one has done any real work to my knowledge of questioning the pre-embargo oil/Coal/NG consumption estimates either. I use very little of this data however what I do have suggests oil consumption was significantly higher than reported then lower. We actually burned less oil than claimed in the late 1960-1970's. Oil supply was already seriously strained by 1970 if you look at my paper. This of course corresponds with the fact US production increases had already slowed dramatically by that point. I've thought about trying to look back into the 1920's forward but I fear that the data quality is so poor that its probably a waste of time. I did try to patch in earlier data sets but I was not happy with the approach.
What I do have that I'm confident in suggests we burned a lot more oil than we think we did before 1960.
In any case once you remove the large volcanic effect and also drop the data say pre 1965 or so the trend goes away and we the natural sink is saturated up until it miraculously expands just when oil prices start rising.
In any case my approach to getting oil is to assume that the natural sinks are saturated. You can either assume emissions are correct and calculate the sink or assume the sink is saturated and calculate one component of emissions assuming that the other two are correct.
Given when we have a known natural cause for the natural sink capacity to change i.e Pinatubo we do have and example case. And and understanding of the scale of event needed to significantly change the natural sink. They stand out. We don't have multiple events of this type happening.
Indeed
http://www.agu.org/pubs/crossref/2002/2001GC000264.shtml
My assumption of a saturated system with little natural variation esp over the short time span of interest is in my opinion valid.
I am of course very interested in the rising S02/C02 ratio however if there is error on the C02 side for Chinese emissions its probably towards underestimating Coal consumption not over as the S02 emissions can be monitored.
http://www.grist.org/article/chinas-so2-emissions-highest-in-world/
In any case eventually the fact that discrepancies in oil production claims are tightly correlated with price which is not used as input is the final clincher for me. The fact I can readily produce a oil production profile that matches very well with price adds another dimension suggesting my approach has merit.
In any case there are also other areas with significant discrepancies. In fact it turns out we conserved a lot more than we thought we did from 1985 onwards till about 1995 or so. I'd argue that the effect of US CAFE standards was propagated steadily worldwide as cars built to US specifications where sold all over the world. So our enforcement of increased fuel economy eventually did pay off dramatically for quite some time. This is perhaps something I should make clear in general it seems all our claims about fairly dramatic increases in fuel efficiency actually happened not only that better than reported. It just took time for them to grow to the point they actually altered total consumption. They had their biggest effect when they where so common no one noticed them any more.
Sorry I did not say much about this rise in natural absorption that was shown in the graph. Perhaps I should esp since I assume saturated !
But heck to get into it at this level perhaps at least accepting my thesis is a good start. There are other very interesting secondary points beyond the main thesis that should be explored. However the magnitude of the differences between published oil production claims and what I calculate during times of price issues is large enough it stands on its own. In fact I thought to do it this way because I happened to be looking at all this info at about the same time and the Mark I eyeball can pick out out in a few seconds. The situation post 2003 is blatantly obvious. A little bit of math helps with the 1980's because the magnitude of the changes are much smaller. Its just that the increase is where we supposedly fell dramatically is the issue. Its the political aspect thats important in real terms outside of the surge in general oil production increased fairly steadily and smoothly right up to about 1995 where it again took off.
This 1995->2003 surge correlates very well with advances in technology and use of horizontal wells and new discovery methods.
In any case the reason I'm so fearless about my results is because everything becomes perfectly consistent using them you can literally read off all the relationships you can think of. They all fall out practically perfectly. From conservation effects to technical to price. Everything works.
My training is actually in theory and I assure you that you don't get perfection like that unless your damned close to correct. Data does not coalesce into this sort of powerful insight unless you nailed your model and your data.
If you choose to look its all there from ambivalence and poor record keeping in the early years to the lie of the oil age in the 1980's and real conservation and technical advancement and then to the end of oil every little step of the way everything comes crashing into clarity.
So either I'm a raving ass lunatic selling a crackpot theory or a nailed it.
Its one or the other if I'm a nut then I'd sure like to know how in the hell everything managed to line up like it did I could not have done that if I tried.
Perhaps I'm crazy but if so I don't have a clue on how to even fake my results.
Heck my own theory of a shark fin production curve previous to this work was actually proven at least partially wrong. It was based on excepting the plateau is real. I'm not saying that the entire concept is wrong but the truth turned out to have a much more reasonable result for how we turned over at peak.
Whats interesting if you think about it on a probability basis and almost perfectly flat top is highly improbable almost all curves or lines are either rising or falling through a given point the strait line is rare esp in natural data.
For this and lots of other reasons now that I have these new results I can actually partially dismiss my old shark fin model as incorrect. However I'm not convinced its totally wrong either. I think the basic concept is still correct and you simply have and initial fairly gentle decline before your steepen. How we actually curved off of peak even with the shark fin was the weakest part of the model in any case as it did not really have any predictive power except to suggest the flatter the top and longer it remained flat the steeper the initial decline rate.
Turns out that a more generous model is in order in that more plausible slow declines not flat then a fall off make a lot more sense and don't require some sort of perfect balance act.
Now as far as I can tell although I was partially wrong I may well be right. We did not turn off a plateau in oil production in 2008 instead it looks like we may have seen a significant acceleration in the decline rate aka my cliff from and initial gentle decline. For a whole host of reasons I'll need another six months of C02 data at least to know for sure. Its something that needs at least a bit of a rear view mirror to see. Peak oil itself is not obvious until 2005 putting the peak at 2003. So it took at least two years and perhaps 3 before I'd be willing to call peak even off my own data. Certainly with other data like discovery rates real oil production numbers etc you could have readily predicted peak oil much earlier I'd say with good data you would be very certain of peak as early as 1998.
But you would need discovery data to make the prediction my approach is not sufficient. In any case my shark fin is still alive with a bite mark and more important I have a pretty good idea of the extent I need to collect data to begin to understand whats happened assuming we turned another corner in 2008 then about 2 years afterwards you can start seeing enough divergence for initial confirmation thus assumption of a steep slope then the initial peak pulls in the wait period.
2008+2 = 2010.
Sorry for the long post but I did want to point out that I also proved myself wrong or at least had to seriously modify my theory once I had the corrected data. So I even got nailed by it.
Of course this probably means I'm even crazier not only do I create crazy theories I use them to prove my older crazy theories have problems and need correction.
The scientific process applied to insanity ?
I'm probably as good a candidate as any for such a disease :)
Regarding "motivation for OPEC suppliers to do a short-term over-supply at relatively low prices?" , perhaps we should add a political component as well? eg what might/would the 2nd Bush admin. do in this regard, knowing that the republicans were going to loose the next election at any event? Try to time the recession into the following administration, then fumble that up just like everything else?
Potential political scenarios are wide and deep. First and foremost I doubt seriously that the original attempt to cool the economy into a recession expected the response to be as strong as it was. We have every indication that the idiots at the top played with some knobs on the nuclear reactor and got and unexpected result. I don't think they expected things to unravel to the extent they did. They where certainly shooting to induce a recession to help cool oil demand. Note Volcker did the same in the 1980's and he has now joined the Obama administration. As far as Obama goes don't forget that he was a powerful senator during Bushie's time so unless there was a major policy difference between the previous and current administration over oil the change in policy is really just a different color lipstick on the pig.
We have no indication of a serious divide over this issue so we can assume nothing really changed between the time Obama was a senator till he was president.
At best I do think that Bush was on the brink of war with Iran and that the elections eventually resulted in delaying that event. But thats probably been on and off the table so many times now who knows when its going to happen.
Now as far as basic politics go I think in the end its pretty simple if they can keep kicking the can down the road long enough then yes we can introduce one more level of efficiency gains in general focused on a move to hybrids and EV's. Perhaps also NG for trucking etc. Basically BAU with at least electric assist making up a portion of our fleet. There certainly is one more squeeze that can be done.
Next lost to most people is the fact that the "cheap" oil in the 1980's and onwards was significantly more expensive than in the 1960's and 1970's in general about double in real terms. Back then that resulted in a more rapid development of reserves that would have probably been uneconomical at lower prices. Plus a general infusion of cash from higher prices for existing production.
So since they are doing their best to replicate the game plan of the 1980's the second basic political move if you will is to keep prices high the idea is that a steady new price of 80 a barrel is more than enough to spur additional development and its a bit over twice the 40 or so previous high. Its a higher correction yes but remaining resources are much more expensive to extract.
Thats the basic public political plan if you will and no real reason to not put it into action it worked in the 1980's and it will work now. Heck they even have the same guy that master minded the last trick play Volcker back around. Publicly its a perfect rerun even down to using some of the same old actors.
Now with that said the real plan depends entirely on what the real oil supply situation is. We did lose some excess demand in the form of the drop in housing construction but obviously the remaining demand is more inelastic. The details of the relationship between long term supply and world demand are critical for determining our future a difference of 1-2mbd literally leads to two very different outcomes. If so then the public plan is simply a cover story and in general everyone has bought it lock stock and barrel.
On the political front obviously the Chinese know the real score they are not stupid and they are for now willing to pretty much allow the game to go on as its currently in their best interests to not rock the boat too much as they have their own problems. However you don't have to do much searching to suspect that they are playing a different game from what the US is claiming is happening. Moves by the Chinese to ensure oil and other resources are fairly blatant without a peep from Washington.
We have done nothing about the Venezuela problem yet for example despite it being in our own backyard while we wage ware in the ME. Thats not natural for the US in my opinion. Mexico is spiraling out of control and we really do nothing.
Given the strategic move we made in invading Iraq and Afghanistan ensure we have armies close to the rich oil supplies in both the ME and Stans and a pincer move on Iran I don't buy that the US is ambivalent. More likely its simply and issue of when we execute or next move.
The fact we stopped for a bit suggests that the next set of moves will probably lead to a widening of the resource wars that are already in progress. Obviously direct conflict with China must be a real issue.
Thus we get a bit of a pause in the great game if you will as both sides recognize that the coming set of moves will force the situation into one that breaks the status quo.
I thinks its simply a matter of when this breaks down not if. The US has already made to deep a commitment in securing the energy resources in the ME and Stans. The positioning is excellent from a military stand point but effectively impossible to back down from politically. The Chinese contracts for oil introduce a way for them to position armies if these contracts are breached. I.e deals with the devil that the US is fond of creating. I don't know what the next moves are of course but I'd argue that the positioning has gone far enough that there is no real way to back down. If we are really lucky then perhaps it will end with both basically dividing the worlds resources and a stalemate aka new cold war. But I'm not hopeful.
To keep the worlds resources priced in dollars we need to be perceived as the only ones who can provide security for the extraction of those resources.
There are a lot of implications in that sentence.
Your treading where even I fear to tread.
Seriously though your correct the abyss we are facing if we keep our current how to say it arrogance is deep. Things can get really really messed up really fast.
Memmel, I thought that those years a lot of countries started to use coal and gas instead of oil for electricity generation.
Well in general your correct oil demand became increasingly concentrated in the transportation sector with expansion of coal and NG usage over the longer term representing and increasing fraction of or C02 emissions. Indeed the rapid rise of Chinese coal consumption and the resulting emission profile is what I claim proves that oil consumption has been falling steadily for almost ten years not the plateau claimed.
Thats not the problem at least not in the early 1980's the problem is this transition off oil did not happen almost overnight as claimed with a rapid collapse in consumption. It happened over a much longer time span basically almost a decade before the economy had optimized oil usage. Remember that in general oil usage had been rising and population growth never sleeps. Conservation efforts have to overcome then natural rise and of course these efforts themselves require significant up front energy costs a new car may well be more fuel efficient but its initial construction requires energy for a long term gain.
Also to be clear my data is global not local. The rising tide of imported Japanese cars could well have resulted in lower nominal US consumption but it was simply moved to Japan which as far as I know was completely dependent on oil for energy in the early 1980's LNG was not common. So in this particular case it was not only a simple change in accounting the net oil usage probably rose as Japanese car manufacturing and exports probably had a larger oil component vs local.
So certainly one part of the explanation is simple demand shifting across international borders. But all this means is the Japanese bought the oil and sold us the cars then used the cash to buy treasuries. The introduction of a middle man does not really change the overall flow. An of course these are new cars purchased with debt replacing in general a car that was paid for.
In short the move to efficiency was itself not really efficient and required additional energy inputs over and beyond what was required to simply keep the status quo. One part of this energy increment is of course additional upfront oil usage in exchange for and eventual longer term gain.
The great crash in consumption of oil vi the sudden creation of new more efficient transportation and conversion from distillates with not only no increase in energy usage during the same time period but a rapid decline simply did not happen.
Its simply not possible you can't get something for nothing.
The reason I think it is incredibly important because if I'm right then this time around we are screwed. Back then we had the excess oil capacity to supply the oil needed to convert the economy to a more efficient one and very low hanging fruit to pick. For some excellent indeed brilliant political reasons this truth was suppressed. If I'm right I understand exactly what they did and it was brilliant.
Incredibly evil beyond all imagination but brilliant.
http://en.wikipedia.org/wiki/Reaganomics
The greatest fraud ever committed in the history of man and probably the the largest one possible.
This time around we are if I'm right well past peak and facing falling energy supplies and need to undertake a energy intensive conversion to alternatives that won't result in a net gain for years as it has to be done against a more efficient system.
If I'm right and the 1980's was a sly trick effectively pulling a rabbit out of a hat then this time around there is no rabbit.
In any case plenty of interesting stuff then.
http://en.wikipedia.org/wiki/Grand_Mosque_Seizure
http://www.globalsecurity.org/military/world/war/iran-iraq.htm
The fodder for all kinds of interesting "threats" that make people willing to take certain actions are all over the place in the 1979-1980's.
Perhaps a bit of pressure on the Saudi's to take certain actions ?
But of course the US would never resort to war in the ME to ensure its oil supply right ?
Are my claims outrageous perhaps but also also you have to recognize the sheer audacity behind them. Pure friggin American bastard.
And of course that will cover the missing CO2. Good catch, Han.
Oil consumption is determined by subtracting the contribution from coal and gas.
The problem is there is no missing C02 through this period.
It did not flatten till 1985. I suspect neither of you have really read the paper so I urge you to at least take the time to read and understand it before commenting.
And there are only two place where the approach reports significant divergences between reported oil production and calculated 1980-1985 and post 2003.
And Web I'll say this you have given me complete crap repeatedly about putting up numbers and crowing about your model and not doing a good job of answering my concerns about your data. Yet when I respond with data and with a model you don't even read and understand the paper. Guess what I was right your data is crap and your model is useless without good data. And you claim to be the scientist.
I'm not impressed you flubbed on of the most basic aspects of science which is to vet the data that goes into the models.
Heck a link was made today about people that used the freedom of information act to get access to some of the EIA data and guess what they found ?
Crap.
I don't give a rats ass if you like me or not but if your really a scientist act like one and at least do the most basic fundamentals steps of validating your data.
I took what I feel was a very reasonable approach using C02 data that shows major discrepancies between the published data and calculated in a few very interesting areas and good agreement otherwise. We have people that have accessed some of the EIA data and are appalled at the approaches used. We have a report from a whistle blower. We have VMT data that does not fit well with claim changes in gasoline consumption. I'm pretty certain more and more dirt will surface over the coming years. How long before your willing to back up and try and vet the data ?
Guess what there is a huge array of secondary economic indicators that track oil and natural gas consumption. Sulfur, Tar, Asphalt, Plastics, Ship traffic VMT, C02 etc etc.
None of the secondary indicators suggest a massive drop in oil consumption in the early 1980's as claimed. These same indicators also suggest that oil consumption has fallen significantly since 2003. Overlapping data sets that are in general self consistent and opposite what is publicly claimed is in my opinion sufficient to make vetting the government reported oil consumption data the top priority.
And of course production data. Simmons of course figured this out until we have transparent access to the oil data we cannot know the truth and I argue enough doubt can be raised in secondary data sets to suggest that the answer will differ from whats currently accepted.
As always yes I can be wrong not a problem but its time to cough up real data that proves me wrong. One reason I focused on the C02 approach was it is simple and basic if we burned it then the C02 was created.
And guess what these very same lies are large enough that they are effecting our climate models as the real sulfur dioxide ratio to C02 is substantially different from what the climate change modelers use. Once you realize that in general over the last few decades S02 production has increased substantially then you realize we have not even begun to feel the longer term climate effects of the current C02 levels as for all intents and purposes China is like one monster volcano erupting steadily for years. The weather and short term climate effects of rising S02/C02 ratios have as far as I know unknown effects on longer term climate models. They are getting hosed by bad data like everyone else.
What would models like this produce with my S02/C02 ratios ?
http://www.cgd.ucar.edu/cas/adai/papers/Dai_AAS01.pdf
Can I be wrong sure but the magnitude of the lie is so great it has serious political implications and worse suggests that our understanding of climate change is itself crippled by bad data.
Prove your data prove me wrong do what ever but be a scientist find the truth.
Right now all I can tell is we have been told a horrendous lie.
Correct for my part: I didn't read them. I just believe(d) the EIA numbers. This in combination with what I read about carpooling, more Japanese cars,etc from 1978-1982 and Leanan writing that in the U.S. from the 3.3 mbod less use 1.4 mbd was covered by transition to gas fired plants and gas home/building heating, completed a picture in which the pieces are fitting nicely (apart from the CO2-emissions, which is another story).
Regarding coal fired power plants:
As burning coal produces much more CO2 than oil and gas, this can IMO still be the reason that there is no missing CO2.
Agreed that a rising population uses more oil, but there was a recession which normally decreases oiluse. If it was different from 1978-1982 it would have been the exception to a 'rule' during other recessions. It's correct that when people lose work they still drive, but a lot of people live far from their work, so driving 2 times daily 5 times a week let's say 20-50 miles only for work adds up, and most would never drive so many miles without work. But again I have to write that I didn't read the papers, which seems to prove that the published numbers (worldwide oilconsumption) and observations from that period are wrong and misinterpreted. Very remarkable.
That's the second time you've said that and memmel advised you to read his paper which addresses this issue. You then admit you haven't read it but make the same statement again.
Memmel is a chemist by original training and you just repeatedly insult him by suggesting that he doesn't know that "burning coal produces much more CO2 than oil and gas". Please do us the service of at least reading his blog before commenting further.
No, the first time I wrote that this started in the '80s. Today I searched the internet and I saw it started from 1973. Memmel answered that it takes time to build out coal and to increase CO2 emissions significantly, which is true of course, but actually the conversion started in 1973.
First I know memmel is a chemist and secondly you are wrong in thinking that I suggest he doesn't know this. I just wanted to make this coal point for the others who are reading the comments, since surely not everone knows what happened with oil burning power plants in the '70s and '80s. And even when they knew it, they could have forgotten this or don't know that burning coal emits much more CO2 or don't make the connection. The comment of 'Webhubbletelescope' proves this point.
Last but not least, I still didn't read his blog because it takes a long time reading all his writings and there is allready so much to read that simply there is not enough time and I don't sit the whole day before my computer screen. So I use common sense, and I'm not reading all the different theories or guessings or facts, which doesn't mean memmel couldn't be right. It could be so that KSA had a much higher oilproduction until 1985, although 'officially' as a swing producer they had cut oilproduction to control prices.
Ok If you refuse to read it but continue to incorrectly guess, I'll tell you where Memmel got his figures from
http://mike-emmel.blogspot.com/2010/02/checking-exhaust-pipe-for-peak-oi...
Means the EIA numbers are wrong and the observations from commenters during the 1978-1982 period are anecdotal.
In fact recently I saw a breakdown graph. How this explains the increasing use of coal fired power plants ? Either there was increasing efficiency in coal plants that were allready in use or the information that I read on several sites that a lot of countries converted from oil to coal and gas fired power plants is not correct, or at least not correct regarding the coal part.
Apart from your valid concerns, Han, I would actually like to see that CO2 cumulative deconstructed. The seasonal cyclic component would need to be filtered out, and then apply a careful derivative and we might be able to see some more than seasonal variations amidst the noise.
Cumulatives act like low-pass filters so you need to do at least some signal-processing to discern any causal trends somewhere in between the seasonal and the long-term temporal variations.
Looking at that equation, I don't see how to separate Coal + NG + Oil.
It's like trying to solve X+Y+Z=1
Here are some solutions:
X=1/3 Y=1/3 Z=1/3
X=1/2 Y=1/2 Z=0
X=1/10 Y=5/10 Z=4/10
etc. etc.
The mass balance occurs with CO2 against the other gases. So unless he has other gases such as SO2 that may be more associated with coal, say, then the equations are basically under-determined in a solvability sense, and you have an infinite number of solutions to deal with. And since we think that coal can displace oil, I don't see how this will work. Memmel assumes that oil is the only independent variable.
I am missing something here. And I don't care if I am wrong because it is not my work. I am simply asking questions.
One thing I can add here is the CO2 emissions chart from the BP review which I've quickly plotted. Here's the amount of C02 injected into the atmosphere from fossil fuels according to BP. Note the slope gets steeper towards the end due to a big increase in coal use.

And here's what ends up in the atmosphere. Note the recent apparent increase in rate of rise of emissions doesn't show up. Memmel suggests that's because some other source of CO2 emissions has declined.
Yet, I have heard that the CO2 level will saturate at some point. How does this figure in?
Undertow, how from this memmel can conclude that oilconsumption didn't fall after 1978 ? The graph shows that CO2 injected dropped. From the coal breakdown cannot be concluded that coal use rose after 1978, but anyhow, because CO2 emissions dropped the most logical conclusion IMO is that oiluse decreased significantly.
Memmel's claim/calculation is that oil production dropped perhaps very slightly but mainly flat-lined throughout much of the 80s.
I'm starting to feel like an intermediary between two people not talking to each other, Please read his blog.
Here's Memmel's key chart (which I've sharpened and blown up from the blog) showing his calculated oil consumption to balance the CO2. In the chart the red line is reported oil production. The Blue line is his calculated oil production to balance atmospheric CO2.
http://mike-emmel.blogspot.com/2010/02/checking-exhaust-pipe-for-peak-oi...
I was writing about only until 1983. After that BP's graph shows increasing CO2 emissions anyway.
Me too. A pity that memmel doesn't show up here anymore.
Hey, I responded to your paper and I recall bringing up the point of accounting for CO2 in the form of coal and other non-oil sources.
The problem is that your paper never got posted on TOD. I wonder why the editors here never posted it.
Well you said I should have used the difference in C02 and I explained no this was a Mass Balance flow equation with a constant sink thus the total C02 level is more correct at any point in time and that was it you never responded. You never even said much about the Chem E concept of mass balance or anything. I don't consider your response a fair read as you obviously missed the basic principle of treating the world as a traditional flow chemical process and doing mass balance to figure out inputs and outputs. The chances that the world just happens to suddenly change its natural sink capacity dramatically when its obviously saturated with the price of oil is zero. Daisies don't suddenly bloom because oil gets expensive. So go read about mass balance understand the method then critique the paper its up on my blog.
Given your previous actions I think you owe me and honest and intelligent review and from your response you need to learn just a little bit about chemical engineering to understand the paper. There is a reason why its done the way I did it. And yes there are point for discussion but regardless the basic results that are disturbing are so large that unless the oxidation of carbon to C02 is itself wrong at this scale no way are my results wrong. And I don't think the approach is wrong indeed its simply a variant of approaches used by climate modelers.
Now this gives me a linear correction instead of a constant sink but same difference really as using the difference in C02. Mass balance works with total flux so I had to generate the sink correction factor assuming its linear. The only intrinsic assumption is that the earths absorption capacity for C02 is relatively constant. Pre industrial age estimate point towards this being true outside of cataclysmic events.
And we even have one of those that makes my results suspect around the event worse the volcanic eruption happened to overlay a recession.
Yes you can set up the equation a few different ways I chose this way simply because it was the easiest way to use mass balance equations directly. I don't see a valid reason to go with derivatives certainly comparing the C02 change with the total burned is wrong. It would be the difference in C02 to the difference in carbon inputs i.e take derivatives of everything well if you doing that just use the totals.
I think perhaps this is the mistake a lot of people are making assume that the total carbon burned equals the change in C02. Thats not true because you have to saturate the sink then get your total. We do saturate every year but basically the earth soaks up what it can then the rest is left in the atmosphere.
Think about it this way if we where burning no fossil fuels at all and the earths C02 absorpbtion capacity was not saturated then for a while the C02 levels would not rise at all despite how much we burned. In the real world the sink consists of a complex number of processes at varying rates so your would probably get the rise just its rate is heavily influenced by the unsaturated sink process many of the slower ones actually being very large sinks.
I don't really care about all this as all I need is that over a given year I'm certain the sinks where saturated and the longer cycle sinks simply add long slowly varying corrections.
In any case this is certainly something I'd love to discuss one of the problems is its hard to talk about except with Chemical Engineers as most people are not trained in mass balance. Its not hard just not common. Obviously your average poster on the TOD seems to not have a clue not that they should but its clear most of the pundits did not bother to read the paper or they would be discussing mass balance. So nothing against them but I make the prerequisite of spending some time understanding mass balance clear in my paper. Its just that it makes it easy for me to tell who is just attacking me and who actually read what I wrote. In general as your aware most people simply attack what I say you included without bothering to understand.
Regardless because C02 levels are increasing the carbon sinks are saturated and thus you can make a few simple assumptions to calculate one of the inputs assuming the others are correct. I did look at some other sources such as cement etc but they are down in the noise vs the primary fossil fuels.
Plenty of room for discussion and critique but as I said the areas of "concern" are so huge that I don't see how my basic thesis can be flawed the numbers are simply seriously wrong in two important places. And in the bigger picture it does look like we burned a lot more oil than we thought before 1970 and we also conserved a lot better than we though through the 90's. Certainly there are other differences but thats secondary.
I am keen to see if its possible to extend back into the past before the sixties however I'm not convinced this method is reliable as you go back because we don't have the C02 data nor do I think the estimates for Coal and NG are as reliable and of course there is enough even in my paper to suggest that estimates of oil consumption before the crisis period of the 1970's where little more than a WAG for the world.
All kinds of good stuff to think about but you have to start with the basics which already highlight serious problems.
For me at least my own pet Shark Fin model had to be corrected so I gotta wait and see if the "adjusted" version is right.
I think then new improved one is better but also it got shifted out into a prediction not and observable past event.
I'm not ready to give up as the nature of the model allowed such a correction however understand that right now given my data
we would be facing two highly divergent outcomes. Either we hit the cliff after a gentle decline or decline rates should be slowing
dramatically aka fat tail effects. Not that there is not eventually a fat tail but now how its connected to the present is important.
At this moment there is still not enough evidence accumulated to pick one over the other however there is enough to know its comming right now either the rate of decline in oil production begins to slow down and flatten or we went over and edge aka shark fin.
Whats really interesting is if the rate of decline is actually starting to slow then the claims of oil trading in some sort of fairly narrow band price are valid. It seems that TPTB have bet everything on this being true or at least have done so publicly.
The reason I think I'm still right is from my partial data set into the past that I see no easy way to reconstruct. If I'm right and oil consumption was substantially higher than was estimated during this period 1920-1960 on the order of 2mbd to eventally 10mbd then we burned a hell of a lot more oil than we thought which means we are significantly more depleted than we think and technical advances played a larger role than most people realize in increasing extraction rate at the expense of depletion. And this includes simply drilling to many wells with current technology of a given period to many holes can be used to create a super straw also.
As of now I have no easy way to prove or even really support this so there is still a big hole however I don't see that it needs proving as even the next several months will clarify the issue certainly by the end of the year.
So I'm just going to kick back and watch the grand experiment unfold. The only sad part is if I am right then good chance some major above ground events will unfold rapidly completely turning everything upside down but thats one of the issues with collecting data to prove you have fallen off a cliff as having done it makes the collection period fairly short :)
Was it ever submitted? If so what were the reasons for turning it down? I think it would make a fine subject for a debate stimulating key post. That way it's more likely folks would read what Mike had actually done as all they would have to do is scroll up.
Publication could easily be with a disclaimer along the lines of "this post does not represent the view of TOD staff" (assuming it doesn't). It could be updated with input received so far including links to previous attempts to match fossil fuel use with CO2 levels and where they differ.
Well, Memmel didn't respond to that question, and he went off on some tangent.
I gave his paper a quick review because he asked me to, and then I just assumed it would have gotten posted because Memmel said he submitted it. It deserved to get posted because it had some merit for discussion, yet I don't know why it didn't.
Apparently he posted it to his blog, which you can get to by clicking on his name.
There was a big push by the utilities for the "total electric home" in the 80s (which continues today). Electric companies offered big incentives for "all electric". Free water heaters, incentives for electric heat, etc helped discourage fuel oil use. My sister built a home 2 years ago and the local power company put together an entire package of all electric stuff. It saved her a couple of thousand $s. (Since then she has had 2 significant increases in her rates.)
Ah, yes, descended from the Gold Medallion Home program, which started in the early 1960s (click on the picture for a larger version.) The juice had to come from somewhere, so let's not forget the even older Reddy Kilowatt, at your service.
JDs has picked on me for years (and I'm not even a Real doomer) but at least he sometimes adds more to the discussion than mindlessly quoting press releases proclaiming the Energy Fairy has pulled another "huge" find out of her ear or that the conservation of energy statutes have been repealed.
I find JD, his blog and his mindless retinue of sycophants generally offensive. Granted he isn't quite the low brow nonsense the TheAntiDoomer is or even dieoffdebunked (Authored by DB who *actually* thinks the ecosystem is 'dispensable' in favour of algae grown in vats), but the constant whining about 'doomers' as if that was the actual problem at hand is just childish. I think his blog has generally done untold damage to people who are new to the upcoming problems we face and are lead into a sense of false security by the constant bias feel-good stories.
JD hasn't updated his blog in some time, and most of what he writes is nonsense. He's a nobody, and soon nobody will be listening to him.
I lived through that era and remember it vividly. Don't underestimate the role of experience and emotion in this story. The winters of the late 70s were fiercely cold, and the entire nation was terrified that we would run out of heating oil. This experience was enough to convince just about anyone who could to replace their oil fired furnace with just about anything else - gas, if it was available, otherwise electric heat pumps. This movement was as much fear-driven as it was price-driven.
People also remembered standing in line to get gasoline, and they knew that rationing coupons had already been printed up and were ready for distribution. They knew that the entire Middle East was a tinderbox. People weren't fools, they knew that the chances were that sooner or later, gasoline supplies would be tight again. Having a car that could go longer between refills, and that got good mileage, had as much to do as anything with pushing people toward smaller and more fuel-efficient cars. Again, that was as much fear-driven as it was price-driven.
I was there, and I can tell you that is how it actually was.
And don't forget that the long-lines and shortage of supplies was caused by impulse-driven "topping-off" by gasoline consumers. Somebody did the calculation here (elwood maybe?) and found that all shortage of inventory was related to the fact that the delta in supplies was being held in people's gas tanks. That is a factoid that JD would never mention because it doesn't advance his agenda.
Fortunately, this fear-driven response did spur on conservation measures. It may again, but as Will said elsewhere in this thread, the low-hanging fruit is gone.
Web -- Exactly. It was none other then the GAO that confirmed that sudden "missing" inventory was rolling around in everyone's car. There were no tankers stgeaming around in circles waiting for prices to rise. We just had another confirmation of human nature when Houston was hit by the recent hurricane. Not uncommon to see 100+ cars sitting in line in the pre-dawn hours waiting for fuel. Having filled up before the storm hit I just passed them by. Even living across the highway from the largest refinery in the western hemisphere didn't help. Then just 3 days later the tankers were able to refill all that suddenly "missing" fuel and the lines were gone. In fact, the stations were unusually empty for a few days since every had topped off and didn't need to refill for a while.
Nate Hagens had an article here about that: The Oil Drum | A 1979 GAO Energy Report - A Template for the Future? Looking at monthly gasoline stocks there was a fairly tepid build in '78, so Prudhoe and deregulated prices for domestic production must have been greeted with open arms; who knew the Shah was about to exit stage left?
Snooping around for info on '79 I found this All Hail The Free Market piece by Bob Prechter on the '08 shortages; the word "pipeline" doesn't appear, except in reference to our needing to allow the marketplace to build more of them, natch:Gas Shortage: Irrational Herding or Economics? - Robert R. Prechter, Jr. - Mises Institute May give some a titter.
With Prudhoe and Mexico approaching full bore at the time, did we (the USA) even get that affected much about OPEC reducing availability?
I ask this because I just don't understand the conspiracy theory by JD that somehow all those 70's/80's production numbers were cooked or imaginary.
Do you mean memmel? He seems to be the chief book cooker conspiracist around here. And hey, Leanan's top post today shores up his arguments - thank you, World Brain! Shortcomings Exposed in Oil Data
The Energy Policy and Conservation Act in 1975 tamped down domestic production, leading to that weak supply build in '78 that I posted about elsewhere here. The subsequent trough was nowhere near what MOL would've been, I think; it suggests to me that temporary panic buying spree can cause a rash of spot shortages, but things blow over within a month or so. Yergin comments on this in the Prize, the actual shortfall world wide was pretty mild, but panicking exacerbated things greatly.
This line of his "That's exactly what 1983 looked like. I was gassing up as usual, totally oblivious. The 'crisis' had such a minor impact on daily life" suggests that period of time was a collusion of sorts to affect some change. The would-be conspirators are the ones that assert that this time around things won't be that easy. Perhaps I am using the term conspiracy in the wrong way, all I know is that JD has an agenda and those opposed to his agenda (doomers, etc) are therefore by definition part of some larger conspiracy. They are working together, i.e. conspiring, to work toward a different agenda.
According to the Shock Model, during the 70's/80's oil extraction rates fell from above 6% of reserves to below 4% which is pretty significant in my book. I doubt Yergin did any modeling, and these pundits don't need to; all they need is a plausible narrative and they can coast on that for years. I don't know what MOL means.
MOL = Minimum operating level, the point below which a distribution system breaks down; with oil, lack of adequate pressure in pipelines or volumes at racks for jobbers to maintain daily deliveries, resulting in spot shortages.
JD's point was that the last bout of conservation happened utterly transparently to almost everyone; Yergin pointed out that few dedicated forecasters saw it coming, either. I came across some Tom Friedman op ed from the mid 80s talking about the huge drop in demand that had occurred, if you want me to put yet another pundit on display here.
Conspiracies: JD mostly is railing against the mindset of Doomers; by definition they - we? - aren't organized, right? Every man to himself, in his personal bunker with AR15 and MREs. Or into his veggie garden, which he's happy to point out are less efficient than cardboard flavored supermarket fodder. I think he bought into the Doom at first as well, with attendant bitterness later on. Buying wholesale into the mindset of Cornucopianism - "Corn"? - isn't an improvement. Truth is somewhere in between.
Thanks for the insight. I didn't realize JD had some underlying bitterness. Now his actions makes some sense, as that can explain a lot about personal motivations.
(deleted)
Point already made
it wasnt me. my theory de jour relates to the disconnect between ng production, storage and comsumption i.e. that the missing inventory is nothing more than compressibility of ng in the ng transmission system. i certainly did not invent that idea, but i can not understand why the doe doesn't make a correction, or more accurately throws it in the bogus sounding "balancing items" .
Another thing I've noticed about product supplied back then was how seasonal demand was - every winter there was a surge of about 4 mb/d, with ca. 2.5 mb/d of that in distillates. I imagine someone has examined the degree to which this created volatility in prices; but paradoxically their was much lower volatility then; all the flush supply canceled it out, or perhaps in the interim much more seasonal demand has appeared worldwide to drive volatility - look at Rembrandt's graphs of demand, some of them look like saw teeth, OPEC nations piling it on in the summer to drive A/C.
Heating oil supplied dropped 1.17 mgal in 2006, people are moving away from it finally. I wonder if the rate of decline in end uses like this has picked up in the last 5 years - your fear factor at work. Or perhaps houses with furnaces are just empty. Or - in Drumbeat a few weeks back someone mentioned an acquaintance who was just filling his furnace tank with diesel instead of buying hundreds of gallons of #2 heating oil. Seems to work so why not?
I would venture to guess that almost all of the houses in places like inner-city Detroit that have been burned down were oil heated. That's one way to destroy demand.
EIA has distillate supplied by state: Michigan Sales of Distillate Fuel Oil by End Use; doesn't look like Michigan's decline went exponential in '08, when there were 6,748 cases of arson. The significance of that would have to be stacked up against the total size of housing stock, how many vacancies, etc.
'05 to '06 the decline was much steeper. Likely granite countertops have a greater effect on use of heating oil than recessions. Will be interesting to check this when EIA has '09 annual data.
Actually, since most of the houses burned down had been standing empty for a little while, the pattern you described is exactly what one would expect.
The heating oil problem brings up that low hanging fruit concept again.
The conversion is either easy, or....Not so much.
For my house, thirty years ago, all my mom had to do was to have her favorite general contractor change the orifice in the furnace and hook up the gas line....Voila! Oil furnace now a gas furnace.
For my sister, she's still burning oil and would love to convert her furnace to gas, but even though she lives in a significantly large town, there was never a gas line laid down in her part of town. Not much she can do but wait for the borough to get around to laying the pipes. They obviously aren't in any hurry.
I'd guess the number of houses heated by oil has contracted about 30-35%; 35% is the spread between 2003 and 2008 numbers for residential supplied; some homes may be vacant or doing without, or using diesel on the sly as I related elsewhere. In 2003 EIA was using that 8.1 million figure we're familiar with: Residential Heating Oil Prices: What Consumers Should Know. So figure perhaps 5 to 5.5 million now? Making it even less of a priority now, and especially with cash strapped munis.
It seems more likely that one would go the opposite direction with fuel. That is, burning #2 oil in the diesel car/truck to avoid the road tax. I think that #2 fuel oil and diesel are virtually the same.
Offroad (untaxed, dyed) diesel has been much cheaper (at least in our area) than delivered heating oil. They are the same except that diesel has regulated cetane and sulfur levels. When I checked for a post about 2 weeks ago, delivered heating oil was near $3.00. I've been paying below $2.50 at the pump for untaxed diesel for over a year. My point was that a guy strapped for cash can go get 50 bucks worth of diesel at the pump, good for a couple of weeks, while the oil companies have a minimum delivery (usually 100 gals.or more), a big outlay for someone on unemployment or under-employed, living check to check.
-- Sorry, gotta call you on that one. An oil furnace burner is NOTHING AT ALL like a gas furnace burner. Though it MAY be possible to substitute a gas burner for the electric oil pump / air blower / filter / orfice system of an oil furnace, chances are it would be cheaper and much more efficient to just replace the furnace.
Umm, you probably know more about this than I do, but it definitely is a conversion job. I live there. I know. And it wasn't difficult. I remember talking it over with my mom's contractor for her (although it was a long time ago). Didn't even take a full day's work to make the changes. Maybe it's because "furnace" might not have been the correct term? The "furnace" heats a water boiler. At any rate, the old oil tank is still in the basement, but the heating system is gas fired:)
Hi Jabberwock,
One of our homes in Toronto years ago had an old oil-fired boiler that had been converted to natural gas; the replacement burner unit looked much like this: http://www.waynecombustion.com/pdfs/pages/P250AF%20P265F.pdf. I may be wrong, but I believe Consumers Gas, the local utility, use to lease these retrofit burners ($5.00/month?), but they were subsequently legislated out of the market due to their lower efficiency.
Our Slant/Fin "L Series" boiler is a dual-fuel certified model. If, at some future point, natural gas were to arrive in our area, the existing burner head can be [legally] swapped-out for one that uses natural gas.
Cheers,
Paul
She could go to propane - that is what many of us do who are not living near gas lines.
Since propane is derived in part from oil, it does share some of the same supply vulnerabilities as fuel oil. On the other hand, since it is also derived in part from NG condensates, it is not quite as vulnerable as fuel oil, and does share some of the advantages of NG.
There is a further advantage: since you've got your own tank, IF you keep it reasonably full, then you've got some buffer that people on the NG lines don't have if there are NG supply disruptions or cutbacks.
I don't know about converting an oil furnace to run NG, but I do know that converting from LPG to NG or vice versa is a piece of cake. There are adjustments involved, but they are simple and any competent HVAC maintenance tech should be able to do it.
If one thinks there is any chance at all that those gas lines presently out of reach of one's home might eventually extended in one's direction, then I would think that would weigh in favor of going with propane, with the idea that you could convert over later when the NG lines come by.
Propane runs the kitchen stove.
It's a little bit amazing to me really. She lives in the county seat, biggest town in the county, 25,000 people, with million dollar homes one block up the street, but no natural gas lines. I was surprised as heck when she told me that.
Most (not all) of the US heating oil demand is in the northeast, not the midwest. There are, as Jabberwock describes, many towns without NG. For the gas company, to be worth extending a pipeline, they normally want some large industrial/commercial loads, that use gas year round, a mainly residential community is not worth the trouble, unless they people are prepared to pay the up fronts costs. Even back then, that up front cost would have been something, and many people would have chosen the (then cheap) option of staying with oil.
Propane, an elec heat pump or a wood pellet or firewood furnace/stove/boiler are all valid options, they are all somewhat cheaper fuel than oil, but none of them are nearly as cheap as NG. BUt if you had to pay the capital costs for a town to be plumbed for gas, you are looking at $10k plus per house just to get the lines in the ground, let alone change the appliances.
Ultimately, all the options are expensive, but continuing to use heating oil is the only one that results in more oil imports from the middle east, and for that reason alone, use of heating oil should be phased out.
The Gov of Sweden made that a goal a fews years back, to be off heating oil by 2020, I think, and they are almost there, already, so it can be done.
Where I live on west coast BC there are still some houses on heating oil, and the local realtors estimate at least a $10k devaluation if they are, as no one wants to heat with oil, and a buyer wants the conversion done already. Some houses have underground oil tanks, which are known for leaks, and these typically devalue a house by $20k, but more importantly, are a red flag for a buyer - who wants to buy a potentially large liability for a tank that could have been contaminating soil and groundwater for decades? And the banks aren't too keen about lending for such properties either.
One other point about propane/pellets/wood, is that Iike oil, you can buy it when you want and store lots of it. For propane, it's always worth it to get a larger tank, or two smaller ones, so that you never have to fill up in winter, and can pick the seasonal price trends. Same with pellets and firewood - cheaper in early summer than early winter.
Hi Paul,
Invariably, there are exceptions to the rule and, lucky us, we're one of them. Natural gas in our area is currently $12.73 per GJ (source: http://www.heritagegas.com/residential/residential-rates.html). This rate is reset from one month to the next, e.g., in January, 2010 it was $15.00 and at one point it exceeded $20.00.
The net heat content of one GJ of natural gas is equal to 250 kWh of electricity, assuming a boiler AFUE of 90 per cent. At $12.73/GJ, its cost per kWh(e) is a hair below 5.1 cents. The cost of electricity locally is just under $0.12/kWh, and a high efficiency heat pump with a seasonal COP of 3.5 effectively drops this down to 3.4 cents. In fact, natural gas is only cost competitive if the seasonal COP falls below 2.3 (a HSPF < 8.0). Factor in the $18.00 per month account charge and natural gas is even less competitive as a heating fuel.
Cheers,
Paul
JD is the quintessential soft-lander. In his mind, if everyone simply started using less energy and transitioned away from oil, then "what's the problem"?
Things are very different now than they were in the 1970s;
Then:
- Large percentage of homes with oil heat
- Cars lasted 5 years (short turnover)
- Significant electrical generation with oi
- Low insulation, high infiltration homes
- Suburbanization still minor
- US predominant oil consumer
Now:
- Very low percentage homes with oil heat
- Car now last 15-18 years (long turnover)
- Almost no electrical generation with oil
- Larger homes constructed with good insulation, low infiltration (still require heating)
- Suburbanization far in excess of 1970s levels (non-retractable demand)
- Globalized oil demand (many nations using oil heat do not have the extensive grid infrastructure of the US to quickly change over to electrical heating)
As Hirsch et all discovered (to their surprise), there really is very little low hanging fruit nowadays. Sure, we could get people to carpool at much higher levels than they are now. With oil in the $80/bbl area, one would think that would be the case. However, US February gasoline sales hit a record, even with the current economic situation, so even driving habits have rebounded back to their previously high-consumptive levels. The slow economy is the only thing keeping the rest of the oil consumption down (i.e., manufacturing, freight, and airline travel).
So will the US and other OECD countries cut way back on oil consumption to transition to an oil decline? Anything's possible, but just look at the warnings about overeating and obesity; have those warnings been followed? No.
As WNC mentions above, the Middle East in the 1970s was a tinderbox, the winters were colder and stockpiles of heating oil were in danger of running out. Long lines at the gas station begin to create a realization, if not a desperation.
Now, we are frogs in a pot that is slowly being warmed. We don't know enough to jump out, at least in critical numbers. "Drill, baby, drill!" There's no sense of urgency. The quote by a former US energy Secretary rings true, "Americans have two modes: complacency and panic". Our drug pushers want to make sure we never quite get to the panic point like we did in the 70s.
The change must come from individuals who are educated on oil projections, with leaders calling for reason in our energy consumption (instead of promising a clinging to BAU). The human element is what JD has always missed and I see this hasn't changed.
I think this is an excellent comment, Will.
I am always curious to hear about the significant oil conservations we started practicing in the 1970's
Here is a continuation of your list:
-- We used to regularly spread huge amounts of oil on dirt parking lots to suppress dust.
-- We had open air heating on many storefronts.
-- We had outside air conditioning (we still do this actually in resort areas).
All those items contributed to a "behind the scenes" reduction in the use of oil that made it less apparent to all the people using oil for transportation. That is basically why JD doesn't understand his own observation "the crisis had such a minor impact on daily life". It did actually, but it was imperceptible to him because the conservation measures at the time were like picking cherries. Alas, the cherry-picking days are over and JD doesn't see this.
And let's not forget that the 1979-1980 time frame was recessionary and employment/manufacturing slowdowns contributed to dropping oil demand;
The Annual Energy Review has long term annual numbers for industrial consumption of oil. Peak was 1979, bottoming out in 1983; 1993 was 85% of peak, it's never surpassed that 1979 figure though.
Yesterday I posted a chart in Drumbeat of monthly distillate (=diesel) supplied in California vs container traffic in the Port of Long Beach, it was fairly eye opening, by and large diesel is containers. With the converse being true, one imagines.
The recession of the early 1980s was when industrial oil consumption dropped off.
By 2005, it had rebounded to almost 5500 thousand barrels per day, very close to the 1979 peaks of 5845. It has since declined.
I should slap all those numbers into one spreadsheet/chart. It's a bit labor intensive since for some reason I can't download the .xls direct from the EIA, so have to copy/paste into blank documents, format headers, etc. But it would be illuminating, giving us some idea of how deindustrialized the country has became.
"But it would be illuminating, giving us some idea of how deindustrialized the country has became."
Ah, good point...at least a fair portion of the industrial consumption did not "go away" but was shipped offshore...same is true of natural gas consumption by the way...we in the U.S. decided we could become the bankers and managers to the world and let them wrestle with the problems of actually getting energy and building things...but we turned out to be really sucky at banking and management too...
RC
Yes, we always have to think of the global picture. Even something as solid as ELM turns out to be a zero-sum game that doesn't really tell us anything unless we take global (i.e. non-zero sum) depletion into account.
JD doesn't see this because he doesn't want to; all that matters is his imaginary tilting-at-windmills quest against those damn 'doomers'
While energy/oil was a major player in growth (or in inhibiting growth) during the 80s and into the 90s, how much was this "crisis" offset by other factors? Reaganomics, deregulation, growth of credit/borrowing and offshoring of production, all combined with the dotcom boom, a shifting of energy sources from oil to natural gas, and globalization of financial markets to enable our growth meme to continue, buying the economy some time.
As these non-energy stimuli are reaching the end of their usefullness and we are paying the price for the overshoot-effect of borrowing from the future, economically, resourcefully, financially, I ask; what now? The bills are coming due. We can no longer pump, borrow, build, outsource and plant our way into future growth. Some limits are purely physical and the Ponzi scheme has run its course.
From memory, VMT for motorcycles quintupled after 1973 (two steps 1973/4 and early 1980s).
Certainly one response, although a Yaris or Fit gets gas mileage comparable to a larger motorcycle.
I think a bicycling response is more likely this time. Adding bikes lanes to Pennsylvania Avenue in DC is part of a larger trend.
I talked to the woman responsible for new bike paths and trails in DC (she gave a brief talk) at the Rails to Trails conference in New Orleans. I asked her, with an unlimited budget (say $1+ billion for bike parking, trails, etc.), $10 gasoline and 20 years to acclimate & build, what % of DC workers would bicycle to work ?
Her answer was "30% and it would not take 20 years. The terrain, the weather, the urban form and the culture all work towards Amsterdam type #s".
Add a couple more subway lines and ten light rail and streetcar lines and the drive alone to work in DC may approach single digit percentages.
Best Hopes for Efficient Non-Oil Transportation,
Alan
Checking up on this motorcycle VMT wallowed around .3-.4% 1970-77, then showed .1% growth for 3 years before slowly tailing off again. Not a major factor; Chapter 3 All Highway Vehicles and Characteristics - Transportation Energy Data Book, Table 3.6.
Table 8.20 is bicycle sales - 30% gain 1981 to 1987. There was a TV program about a cyclist/bus rider/driver's commute to work in DC, attempting to see which mode of travel was swiftest; think the driver won, but barely.
Biking was huge in the 1970's but in retrospect it now looks like the stone ages. The 10-speed of that era is now the carbon or titanium frame road bike of today and I still can't believe the difference that technology makes. To me a modern road bike feels like a second skin whereas then it felt like a clunky appendage. If we can regain the popularity of cycling and rid the old people of their 1970's era preconceptions we can possibly make some headway.
BTW, the same holds true for other odd transportation methods. Cross-country skiing had a mini-peak of popularity in the late 1970's (due to silver medalist Bill Koch), but the modern carbon-fiber ski is amazing compared to the knickers and wood of that era. Same goes for roller blades, as the original ones were heavy and clunky. Don't forget mountain bikes, same deal.
I know people get older and they get less athletically inclined, but I never got over it.
I'm thinking of getting back into cross country skiing. I'm in my 60's, still backpacking, biking, etc., but haven't been on skis for a while. Did a serious amount of cross country in the 70's, but I was living in Mammoth and Montana.
I occasionally snow shoe (talk about technological improvements, the new snow shoes are incredible!)
If you are into backcountry I would recommend trying the XCD-style skis popularized by Karhu and now offered by Fischer and Rossignol. What is neat about these skis is they are light and have fish-scales but also have the parabolic cut and steel edges so you can also use these for certain downhill runs. Last week I mounted Rottefela bindings on a pair of Fischer Snowbound skis and got to test them out and am very impressed. Good boots too, way better than the old days.
I agree on the snow-shoes but would go the ski route myself as you can cover more ground faster.
I agree that technology in biking has been GREAT and it is unfortunate that Golf Technology gets more play but hey times will change. In flat areas the technology is not as evident, but climbing hills with gears and aluminum/carbon frames is revolutionary. In addition, for the novice, it behooves them to get a good bike so the newbie understands how a good bike can make a difference. We should encourage a one time tax credit per person for each person who buys a bike in excess of 1000.00 dollars. If you are just getting into biking, buying cheap will discourage a great number of people.
I got a Trek 1.2 with my Amex points from flying all over the place and I rationalize this purchase a my Carbon offset. As a marketing ploy the airlines and the bike manufacturers should offer a bike as a carbon offset in exchange for frequent flyer points.
The airlines are part-way there. Even though skis are oversize, we don't have to pay extra for the transport. They arguably could do the same for bikes and treat a bike as one piece of luggage. This is a different kind of carbon offset, but it may be a better place to start. I have seen people go to ridiculous extremes to get a road bike to fit inside an allowable piece of luggage (BTW, it can be done with the smaller 650 wheel diameters and a smallish frame).
The oil crisis of the 70s-80s produced a tremendous amount of fear for about a month until the price tripled and everyone parked their cars until they could buy a Toyota or Honda. That month or so was terrible. Lines backed up a half mile and when you reach the tank they would close it down. Women trading sex for gasoline and men fighting at the pumbs. It was real scary for about a month. Next time we might not be so lucky.
hotrod
"Women trading sex for gasoline..."
Did you get that from the EIA? How many examples can you point to? And why didn't you write, men trading gasoline for sex?
Do another line; it might offer you some perspective.
[dp]
Leanan had some retrospective article on the shortages; forget what the title was. gasoline shortage 1979 fights - Google Search First link is about punch outs in Asheville NC late '08.
I've read that in 1979 we were wasting something like 150 kb/d in oil idling motors, too.
KLR -- Now that you bring it up I don't recall one report of gas line violence in Houstion during those several days of near empty stations during tghe last hurricane. Perhaps that says something about the patience and evem temperment of Texans. Or maybe something about knowing there are many 10s of thousands of concealed carry permits issued in Houston.
A good portion of the male population will trade anything for sex so it seemed more appropriate since I was speaking of gasoline that women traded sex for gasoline, but if it makes you happy..... men traded gasoline for sex.
hotrod
lineman said, "It was real scary for about a month."
Gee, ya' think? I was a 15 year old kid standing at the pump of a Gulf oil station in those days, my first paying job...(under the age to get a work permit so it was paid in cash, $1.00 per hour), and yeah, scary is an understatement...the owner kept a loaded revolver in the desk drawer just in case we needed it, and if you could provide gasoline you could have gotten about anything (sex included) but the stations were hoarding just as much as anybody, measuring it out by the drop so as to try and have enough to take care of long loyal customers...no fun to a pump jockey in those days, but I learned a lot about being tough (or at least how to talk tough) and negotiation in those days.
RC
I could not find a good place to comment on the efficiency of electrical generation, but let me put this here.
First, on the nuclear side of things, the percent availability have gotten much better in recent years. This helps, in some sense, the overall efficiency. The nuclear steam cycle being what it is, whether BWR or PWR, you just don't have really large thermodynamic efficiencies associated with that cycle. But it helps if you can run low periods of time at smooth loads.
Second, the gradual replacement of older subcritical boilers with newer (and optimally sized) supercritical boilers is incredibly important to the dispatch duty. Although you are still constrained by your turbine condenser water temperatures, the improved thermodynamics of the supercritical cycle can add 5 percent or more to the efficiency compared to a comparable subcritical boiler. Duke's Belews Creek Units (which I have crawled around in a number of times when they've been shutdown) and TVA's Bull Run are examples of really efficient coal-fired supercritical boilers that happen to have a good, stable "coldwater" source of cooling water.
What has not happened is the ability to raise both the operating steam temperature and steam pressure of the boiler. Most operate at 1000 °F for both the primary and reheat superheated steam temperatures. There are a few that operate at 1050 °F and only a couple that try to run at 1100 °F. Above that temperature the metallurgy of high temperature operation becomes a limiting factor at high pressures. You don't want tubes rupturing ("fishmouthing") because it is hard on a lot of things and can be very damaging to the boiler components.
A couple of years ago on a conference call with developers of IGCC looking to improve efficiencies, they brought this up again. I trotted out the POWER magazine articles from the 1970's that show that this has been an illusive hope because of the nature of the materials involved.
Third, there is less tolerance for tube leaks than there use to be (again part of this is a function of the operating pressure). Years ago when I first broke into this business you used to hear about leaking economizers all the time where people tried to limp along until they could get to a prolonged shutdown to repair or reduce the leaks. Although leaks do still occur, the loss in efficiency eats up the repair and maintenance costs in pretty short order.
Fourth, boiler controls have greatly improved and the use of PLCs and the ability of various microprocessors to respond quickly and with a whole lot less lag and hysteresis makes a difference. However, it was (and still is) possible to chase one's tail with these controllers. You don't want to be running so close to the bleeding edge that a little hiccup cause you a nightmare scenario.
Fifth, and this is really a huge difference in efficiency, is in the use of oil and particularly gas in combustion turbines. There are so many improvements it's hard to know where to begin, but here goes: the use of single crystal blade designs that allow for much closer tolerances within the turbine and the blade/bucket designs, the use of high bypass turbofan technology which provide for much more efficient fuel usage, pressure recovery and cooling of the internal components, the ability to operate in pre-mix rather than diffusion flame mode for gas (it's tricky particularly at "switchover" and shock/flamefront characterisitics in the combustion cans is completely different, but is an efficient way to operate for long periods of time), and the increased use and incomporation of combined cycle turbines (with and without additional/supplemental fuel for the steam cycle).
It is possible to get thermodynamic conversion efficiencies in excess of 50% (but you've got to be careful of your basis for comparison. Turbine manufacturers like to use the LHV which make the numbers look better. I always use the HHV for comparisons).
Finally, the increased usage of cogeneration though it can "hurt" the turbine efficiency on the elctrical generation side of things because of the need for both a back-pressure turbine with some unused superheat for process uses (or chillers or facilitiy heating). Where you can't condense the steam vapor into water droplets on a spinning turbine (a real no-no), cogeneration gives you a place to use all that latent heat and the unused superheat.
There are other improvements as well, but these are the major ones I've watched develop over the 35 years I've been dealing with the electrical energy generation side of the house. I remember the first time I ever saw a GE Frame 7 dry-low NOx simple cycle turbine with a Mark 6 controller and saw the operational numbers on the thing (~10 years ago). Except for the issue of the natural gas supply, I wondered out loud why anyone would consider "conventional fuel burning"and the conventional steam cycle given the sorts of efficiency that was possible with one these machines. The US saw a huge spike in orders after that.
Thanks, Trooper. At the bottom of the comments I passed along a remark from a World Bank doc suggesting 34% worldwide efficiency, but lamenting low efficiencies in less wealthy countries; any thoughts as to how low those efficiencies are, how difficult it is adoption of newer tech like IGCC, or any other roadblocks in dissemination of better quality power generation around the world?
The World Energy Council has a page of "Energy Efficiency Indicators," with regional entries for power plant thermal efficiency; unfortunately these seem a bit high perhaps, here's Africa, for instance:
EU27 is 38.4% for 2007. For the US in 2000 they say 36.8%, some 4% higher than the EIA doc I linked to in the article states. I must be missing something here.
I guess most of the oil used in power generation is only in OPEC.
Most developing countries are in hot tropics and do not need home heating. Even in places where heating is needed (like in north India or China) - people do not have central heating. From what I've seen people just use room heaters that use electricity. Central heating using oil is a rich country's concept.
There is some usage of Kerosene for cooking. But that is quite small and will move to gas / electricity as people get affluent - ofcource they will be replaced by someone poorer who now use wood.
Well, in many instances but not all. Top 10 oil burners for 2006, by percent of total generation mix:
Top 10 by volume is at the end of the article, it is 1/2 OPEC. However, tabulating up oil burners >50kb/d it's 1,102,030 bbl/d OPEC vs
2,369,930 bbl/d Non. This is even with including as OPEC belated OPECers like Indonesia and Iraq. But there are plenty of other major producers using a lot of oil for electricity, obviously.
I think there might some placement of the cart before the horse going on with JD and CERA.
I Agree with those who point out that Jevon's paradox is clearly at work. Efficiency has it's benefits, but it isn't going to reduce consumption. The only way to reduce consumption is for a substitute to be more economical than oil.
The drop in consumption in the US during the late '70s coincides with the Volcker Fed tackling inflation. Granted, the oil shocks of the time contributed to that inflation, but the main dynamic was a wage price spiral. To counter-act it, the Fed raised rates to almost 20%, the US went into a severe recession and there was very high unemployment. Of course demand for oil dropped!
The slow recovery of demand to the previous peak also coincides with the onset of globalization. I'd be interesting to have data for worldwide oil consumption. Are we sure the oil wasn't simply being consumed elsewhere?
Finally, the recent cratering of demand also coincides with the whole world falling into a severe recession brought about by a near collapse of the world financial system. Sure, very high oil prices played into that, and there was probably a recession baked on that score alone, but the catastrophic drop in worldwide industrial production was caused by more than just high oil prices (insert litany of issues about credit contraction, debt overhang, etc).
Patrick wrote "Agree with those who point out that Jevon's paradox is clearly at work. Efficiency has it's benefits, but it isn't going to reduce consumption. The only way to reduce consumption is for a substitute to be more economical than oil."
I would suggest you are both wrong and right here. Jevon's paradox is not really at work right now with oil/gasoline, because there are not major leaps in the efficiency of it's use being made. See the discussion upthread on this. A Prius gets twice the mileage, but that doesn't mean they are being driven twice as much as the cars they have replaced. In the developed world, most non transport oil uses have been substantially reduced, and in the oil producing countries, many of them have few alternatives to oil for power generation, and the efficiency gains, such as combined cycle turbines, are already available, and unlikely to go much higher.
So, as you point out, wee must substitute to decrease oil usage. That part will be Jevon's paradox at work.. For example, IF (and only if) a breakthrough in battery technology (price and power to weight ratio) occurs, then EV's will suddenly become that economical alternative, because they are more efficient, and their usage will increase dramatically, at the expense of gasoline cars. This is as Jevon predicts, and is analagous to the steam engine replacing horses - it became more cost effective, by efficiently using a different energy source, and so was widely deployed.
I think to say that oil demand has "cratered" is a bit dramatic. It has gone down, but worldwide oil usage is still more than 90% of it's peak. If you want an example of demand cratering, look at auto sales, or the property market in Florida, etc. Oil may have peaked, but a 10% decline is hardly cratering. In fact, I would go so far as to say it's demand has probably dropped less than most other commodities (metals, pulp, lumber, etc). You need these other commodities to produce, but economies need oil just to live, even when producing less.
Patrick - note that the drop in US demand took place a year ahead of the 1980 recession in the case of overall product supplied, which was at 86.54% of peak level when the 1st recession kicked off in Jan 1980. Fed funds rate was ca. 11% in 1979 too, I read. How that all interplayed will take some more researching.
World consumption rebounded in 1984, was at 96.7% of the 1979 peak value in 1989. That was quick. Where the additional oil was being consumed would be a subject for a whole other article.
I'm sure that oil rationing (odd-even) was active in early 1979 because I changed jobs and moved in June of that year and I remember quite well having to worry about that both interviewing for and travelling to my new job.
Found a source for more info on power plant efficiency: Energy Efficiency Policies - World Energy Council. From the Executive Summary:
1 Mtoe = 7.4 Mboe, 420 Mtoe is 3,108 Mboe. 8.52 mboe/d? Did I get that right? Not quite Groppe's number but that's still a lot.
Later I'll post a screen shot of electricity by source by income level/region, from the WDI document I mentioned in the article.
Promised screen shot:
Efficiency improvements in burning oil for power don't have a very big impact given how much less oil is burned for power generation right? At least here in the US.
In terms of the % of our power derived from oil the US is #79; in terms of total volume burned for power we are #3. The discussion of efficiency in power plants is with crude antiquated plants in poorer countries which collectively seem to take up quite a fair amount of demand; if those could be done away with or improved upon it would free up some oil for export, in theory anyway. It also would hurt simple refineries who can't afford the very expensive upgrades to refine more lighter products instead of the resid used in power generation.
On TOD Australia/NZ there is a discussion concerning the electric and hybrid car market and it's impact on Australian auto manufacturing. The photo heading the article is a fascinating one, a Porsche concept supercar called the Porsche 918. Not everyday you see a Porsche super exotic on any TOD discussion thread! But this is a very special vehicle, and the youtube link below is fascinating in demonstrating the incredible levels of engineering and workmanship that is now being applied to the hybrid car idea. This is design that rises to the level of art:
http://www.youtube.com/watch?v=0_KemHBQ88c
Of course we know the average buyer is not going to be able to purchase a vehicle like this, but the technological breakthroughs are already trickling outward into the broader market, and downward into cheaper cars. More stunning is to think how young this area of development is (and the original Lohmer Porsche was NOT a plug hybrid) the idea of bringing the grid based power system into direct competition with liquid onboard fuel was barely considered realistic only a few years (with the exception of a small number of visionary designers and planners). Yet to be applied is the use of other fuels (methanol, CNG, propane,recaptured methane,etc.) as the onboard range/performance extending fuel, the use of small gas turbine or Stirling engines as the recharging engine (a role they are more suited for due to the relatively constant engine speed).
One would think that as the hour of doom approaches (at least as described some) firms such as Porsche would be terrified, but none of it for them, they have things to do. I worry about the more fearful crisis: Where has this kind of positive effort, positive energy and belief in human intelligence gone in the U.S.?
There is no doubt that we suffer from a horrific energy crisis. Somehow we have depleted the energy of the human mind and spirit. A history professor lectured me thusly regarding the collapse of the Roman empire..."the biggest problem was, they lost interest in it." At the time I laughed, taking what he said for a joke. After years I now have cause to reconsider, and realize how correct he may have been.
Still it is fun to watch our German friends put on a fantastic performance, the sheer art of it is worth the effort. :-)
RC
By the way, a brief aside, am I the only one who is slightly annoyed by CERA's "johny come lately" attachment to the "peak demand" discussion? I was discussing this right here on TOD almost 2 years ago...no applause necassary, thank you.
RC
This is off topic but check it out.
This goes to the discussion we had last week.
From the Energy Bulletin website.
http://www.energybulletin.net/node/52048
porge,
Thanks for the link, I find this to be exactly the direction we should be going. Local and regional banks and credit unions have incentive to invest wisely in their own geographic area because they depend on the success of the area around them. The large multi national banks are now essentially rootless and nationless, and operate as privateers (some would even say pirates) in the financial system...they can as easily pull the financial plug on an area and sell it out as easily as sailing ship can swing it's sails about and change direction.
This may be good for the bank (although that has not proven to be true in the recent past) but it makes the large multi national banks absolutely unreliable as co-parties in any transaction. This is the core of the message, and this is the message we must all understand and make known for our own financial survival: The large banks are simply NOT reliable co-parties.
RC
Given that a Cayman already costs $49k you can file this one with the Tesla. Heh, 3.6 times the Cayman's mileage.
1st mention of PHEV was in the July 1969 issue of Pop Sci. I really want to know more about historical sales of luxury cars like these. Notice that the BYD F3DM PHEV-60 sold <100 units in 1st 8 months, despite BYD being behind electrification all the way. Price? The princely sum of $22k USD equivalent. If that's a deal breaker in the PRC how much higher can people in developed economies go?
What hour is that? Toyota have had peak oil aware people on board for quite a while, which has paid off for them, but I'm not aware of any other makers actively speaking out about fuel supply limits any time soon, no sooner than promised by government agencies anyway.
KLR,
My reference to those who are believers in the hour of doom being NOW, or even yesterday was mainly intended as a reference to some of the darker voices here on TOD, but since you mention the auto industry, it must be admitted that in the American industry, our U.S. auto firms have confronted the changing environment with the standard seige mentality...lay off workers and shutter plants.
While we have been told that we must "offshore" about everything, Japanese and even European companies were coming to the same U.S. states abandoned by the U.S. auto industry and building new plants. Does this not give us reason to question the logic of our American auto execs and their dark view of the American worker and the future?
Bob Lutz of General Motors famously referred to the whole Hybrid electric car idea as "just show business" only about 5 years ago.
General Motors is now having to try to play catch up with the Volt, and there is no doubt that many in the company still feel the hybrid is nothing but novelty, even as they feel forced to adapt to the idea simply to shut up their critics (who still have never forgotten the great hoopla and then complete abandonment of the EV-1 just at the moement it was gaining acceptance and just before fuel prices skyrocketed (again, GM with it's wonderful ability to project market trends...how much do they pay their market planners and analysts?)
Toyota, what can we say? Being a Kentuckian, I have yet other reasons to be loyal to them in their hour of need, but leaving that aside, what can we say about how far sighted they have been from day one? They understood what supposedly educated people should have understood all along, that the hybrid electric car was a bridge toward a whole different energy market place, that we would see a massive and holistic restructuring of transportation, energy production and energy use in upcoming years, and that the firm that made the first real breakthroughs in not only developing the hybrid idea but in bringing it to market scale (read Robert Rapier's columns on how important that step is and how difficult to accomplish) would be the firm who would be able to control the direction of the upcoming revolution. While American doomers were once again predicting we would all be riding horses soon, the technicians of Toyota were building the future.
And yes, there were articles around in Pop Sci and other magazines, right along side the "flying car" and "fusion reactor" articles, but it is Toyota who made the hybrid REAL, and only recently so...
In reading posts both here on TOD and on the string discussing the electric car on TOD Australia/NZ and other energy/technology sites on the web, I am more and more convinced that you could put the number of people who actually understand the radical nature of the upcoming technology revolution in a very small room, and most of the people who do understand are in Japan, China or Europe. And that is among a relatively technically well educated audience...out in the American general public, most people actually have no idea how the hybrid, plug hybrid and full electric vehicle even differ one from the other. They cannot understand what can be done because they simply cannot grasp what is already being done.
As far as BYD goes, I do not know their exact situation, but I can recall the laughter when the Tandy and Commedore home computers hit the market..."what are you going to DO with it?"..."it's an $800 box to store recipes!" You could hear the laughter in every magazine as the "experts" pronounced derision...that is what "experts" are so good at, ridicule and derision...but the technicians at places like Toyota and Porsche and BYD don't have time to ridicule and deride others, they are actually building something. Could there be a lesson there for us?
RC
"Amateurs talk about tactics, but professionals study logistics."
- Gen. Robert H. Barrow, USMC (Commandant of the Marine Corps) noted in 1980
In the article I WAGGED that if the hybrids sold to date would've been PHEVs or EVs they would have collectively displaced ca. 60 kb/d. Golly. I'll keep examining this, of course; given that new cars are driven the most some manner of sliding scale applies to their utility, etc. But this is a start.
I'll be dubious of their potential until I have more numbers concerning the economics of cars in re: the MSRP. Hybrids remain luxury cars by and large, and this puts a ceiling on how widespread their adoption can be, whatever their utility in the face of fuel premiums or shortages. If you know of a study I'd be very grateful.
If hybrid or especially PHEV tech can be scaled up and the premium in the MSRP negated that would obviate my concerns, obviously. Till then they will remain at <3% of yearly sales and <1% of total fleet for some time, meaning in the end they will have little impact on overall fuel demand. I suspect this is the thinking behind EIA forecasts of minimal impact from hybrids in the future, and mostly mild hybrids at that.
You could consider the converse, as is being popularized by Tato: fuel sipping cheap mass produced vehicles. Yeah yeah, Jeavon this and Jeavon that. One author suggested we do as much: Lisa Margonelli small cars - Google Search Where is that &*%($*%&*$( link? Out of time here.
Back in the early 1980s the impact on the economy was felt mostly by those near the bottom of the economy as relatively well paid manufacturing jobs disappeared. All those high tech new jobs paid considerably less than the jobs which disappeared. Those times were golden for the upper middle class business managers particularly those importing Japanese cars. Whole manufacturing sectors of the economy like typewriters and televisions disappeared from the USA. The deregulated Savings and Loan business had a big bubble in the mid 1980s as the crooks took over and the sector collapsed at the end of the decade. It was a preview of what happened over the last decade in the unregulated derivatives market. The collapse of the S&L bubble triggered the 3rd recession of the decade and true recovery didn't happen until the early Clinton years. The recession filled 1980s was the reason oil use didn't return to late 1970s level until 1993.
The lesson is that as oil supply drops those at the bottom of the economy will feel it the most. Those higher up in the economic ladder may not even notice peak oil's onset for many years. What I am seeing now is the disappearance of public sector jobs at the local and state levels. Some states are releasing prisoners early and laying off prison employees. Public school jobs in some cities are being cut by 50% as property tax revenue disappears. The private sector has increased its productivity and the lost jobs there may never come back.
Pretty much. I'll add your basically laying the ground work for how demand destruction actually happens. Its not some middle class person buying and EV and conserving while making the mortgage payment on the McMansion is forcing a certain percentage of the population into poverty. The problem is that this time around I'd argue a good percentage of the population if the US is going to be reduced to third world poverty levels and at some point the safety net will be withdrawn. To some extent this withdrawal of the safety net has already started as state and local governments cut programs they also cut the number of employee's processing valid claims for aid. This slow down in processing is itself and effective cut.
People not squeezed out of the system will simply continue to pay as needed. The price of oil itself is determined by the rate demand is destructed through impoverishment they baseline oil usage by even the very poor which is infrastructure dependent and the way people with significant cash flow manager their money. Do they conserve on oil to pay their debts or default and buy oil ?
If I'm right and they choose to default then the price of oil can rise very high indeed swamping the impoverishment rate. The underlying problem is actually interesting as I argue that crushing former middle class people down to third world living standards is a slow affair and takes time all the way down their oil usage is very sticky the last major article they give up is their car.
At the very least the fact oil prices rose steadily even as the number of people without jobs increased should tell you that demand destruction via impoverishment is a slow process.
The truth is thus pretty ugly and people with money voluntarily reducing consumption via the purchase of high efficiency cars are really not part of the picture.
Thomas and Memmel,
The economic issues you guys point out are very real, but I would like to ask, what was going to keep that from happening anyway? Let us assume just for the sake of argument that there is no danger of immediate peak for...pick a number, say 40 years. I am not saying that, but just consider it for a moment...how would that help the economy?
I work for a firm that is outsourcing as much work as it can to India..because oil is short? No, because they can get a better price there and jack up the profit margin. They would do the same no matter what, the technology now allows it.
In my own circle of family and friends, I know of at least 5 large homes that have been sold in exchange for small apartments or condos. Because of energy concerns? No, the houses belonged to couples or women who raised their children in them and now no longer need a huge quarter million dollar home. They don't want the expense, the high taxes, the lawn care. So the traded down, often from a quarter million dollar home to a 90 or 100 thousand dollar condo, or rent an apartment. What do you think that does to tax reciepts for the local government?
Many aging boomers had children at a lower than replacement rate (and consider the ones who had no children and the childless gay and lesbian couples, who are now much freer to live their lives the way they want to). There is an aging population who do not need these giant homes and not so many young couples to replace them as home shoppers...all a person had to do to see this coming was look at an actuarial table...Gail are you out there to help us out on this? And now white collar/management/accounting/bookeeping/software jobs can be shipped out of the country at the speed of light to be handled in third world countries. You would assume that would not be good for the local tax reciepts...
Folks, peak oil may have happened yesterday, but all of the economic woes the nation faces can very easily be explained without it. And even if find ways to manage the peak oil issue, the economic problems are still not going to go away, because they stem from roots that are completely non energy related and that are built right into the population structure and the technology of the world as it is.
RC
Well where to start first your Boomer friends that traded down well they sold their house to some sucker. And I say sucker because that person probably won't sell. Certainly the number of bagholders stuck with houses they cannot sell is increasing but boomer downsizing simply changes who the fall guy is.
I point this out because its a flawed argument.
As far as outsourcing to India goes well now how can they pull that off. Certainly these Indians are not buying their own products they don't make enough to afford them. Who is the buyer and how are they buying. Nothing wrong with importing a product that be made cheaper elsewhere thats life however your buyers better be able to afford it. How do they do that ?
Well for the US at least its via issuing debt or promises to pay in the future.
Well thats fine as long as you can pay but this pretty inflationary and generally not something you can do for long. Yet we got away with it for decades.
How ?
Figure out how and what we did. Well you know where to look for the start of this game it was in the 1980's however just because the timings fairly easy to figure out its still if you think about it and amazing feat.
Edit: Reagan claimed deficits do not matter this is 100% true why ?
Now most Americans are pretty complacent about the situation for many they where either to young to understand (me) or they had experienced life before the great magic act was performed and where more than willing to not look behind the curtain.
Having looked myself I'm not sure you want to.
In any case to understand today you have to go all the way back to then and work your way forward once you do then you will understand that your claim that all these problems have nothing to do with oil are wrong its all about oil.
To be clearer perhaps its all about our rulers selling us as common drug addicted whores on the open market for their own enrichment. In the 1980's the American people where literally sold as slaves all of us using our own addiction to oil and stuff to enslave us utterly. Once we are no longer able to increase our consumption to enrich our masters I suspect we will simply be tossed in a ditch.
Just because most people have been happy contented slaves most of their life unwilling to understand what happened to them does not change their circumstance in life. Peoples views on reality are not necessarily the truth.
In general we all went along with the game. For me at least I recall at least thinking about it but I did not understand our financial system really and what little I did understand made it even harder to figure out. It was well like magic to me but hey I was doing ok and I trusted the smart guys at the top so ..
Could I be wrong sure of course.
However I have made some pretty strong prediction that follow from my own understanding. If I'm right then quite a few things pretty much have to happen spanning the range from really crummy to horrific indeed some I don't even really want to think about.
The root of my concern is actually not really the public data if you will deficits peak oil etc etc its the underlying mentality that would allow people to decide to take the course we have chosen. Thus if I'm right America is a far sicker and diseased nation than most realize its a perverted mockery of the ideas it claims to support. And if I'm right then this perversion will not remain hidden and thats the scary part.
Yeah, Mike. What you said is what the information age gave them the tools to do.
They control your credit and they buy and sell YOUR NAME, your strawman. And all with our permission. What happens when the the pusher man runs out of the good stuff?
memmel,
Where to start...well,
You said,
"Well where to start first your Boomer friends that traded down well they sold their house to some sucker"
Probably so, but they didn't mind...given that many of them bought the house in the 1960's or 1970's they still came out very nicely thank you, even if they had to sell the house off the old highs. Frankly, they are not going to worry about how the buyer came out on the deal, the buyer bought of their own free will.
memmel, you ask,
"As far as outsourcing to India goes well now how can they pull that off. Certainly these Indians are not buying their own products they don't make enough to afford them. Who is the buyer and how are they buying. Nothing wrong with importing a product that be made cheaper elsewhere thats life however your buyers better be able to afford it. How do they do that?"
You and I agree absolutely on that one, it is a point I have made in other posts, but it does the white collar worker who has just lost his job of 12 years no good to worry about how it will work against his former employer in the long run, because he is unemployed NOW. His city and county are doing without his tax reciepts NOW. Poetic justice may indeed strike down his former employer at some point in the future but it will be too late to do him or his city/county any good, it will be hollow vengeance.
(Example...BX (Blackstone Group) has made a career of coming into firms and essentially gutting them out and outsourcing the employment overseas and then selling the firm either all at once or piecemeal in IPO's...from the bottom of the market one year ago they have gone from just over $2.00 per share to $15.00 per share...I tried to buy all I could and come out nicely but just didn't have enough money to really take advantage...now the model of gutting and exporting American business is NOT sustainable, but do you think folks who made 700% in less than a year on the shares care? The way they see it that will be somebody elses problem as they put the money in Canadian bonds, land and/or annuities.
memmel, you say,
"Well you know where to look for the start of this game it was in the 1980's however just because the timings fairly easy to figure out its still if you think about it and amazing feat."
I would actually go back a bit earlier for the start when Lyndon Johnson told the Americans you could fight the war on poverty and the war in Vietnam at the same time with no sacrifice...essentially the same argument G.W. Bush made about the "war of weeks" in Iraq.
Johnson and G.W. Bush embarked on the two most expensive military adventures in modern history and floated no designated war bonds, endorsed no rationing or austerity programs on the home front and essentially mixed the billing into the general budget and told the Americans to "go shopping". Look at the "go go" high power cars, oh so adorable fashions and giant non productive university class of the late 1960's, and compare to the still roaring Bush economy with the SUV'S, "hyper performance" 3/4 megawatt cars, and soaring house prices...who would believe in either case that we were involved in an expensive bloody war? Will the historians be able to fathom how either president thought it was possible? At least Franklin Roosevelt sold war bonds so the costs of WWII could be made clearly visable, and expected the home front to endure sacrifices such as rationing and austerity...it was a far more honest and decent path he took.
memmel, you say,
"To be clearer perhaps its all about our rulers selling us as common drug addicted whores on the open market for their own enrichment."
I absolutely CANNOT disagree with your point there...but again, would they be doing that regardless of the energy situation? I don't see what would be stopping them...
Lastly, until proven otherwise, I have to stick to my contention: There are simply too many large suburban homes in the nation for the market to support...peak oil or not, the demographic WILL NOT support them, the people who needed them 20 years ago no longer have any use for them...it would be as cheap to live in a luxury hotel and be waited on hand and foot as to try to support these giant homes until prices for them come down SUBSTANTIALLY.
The people who felt they needed giant SUV's and trucks no longer want them, the kids are grown, and driving the beasts is now a chore instead of a joy...the market simply would not exsist for nearly as many of them as existed 20 years ago even if gasoline was a buck a gallon, and there are MILLIONS of used ones out there competing against the new ones...
The companies will look out for themselves in the short term and farm jobs out to the cheapest bidder, they feel no obligation to the nations that birthed them, and I see no reason they would stop doing so even if oil were $20 per barrel...the technology now allows for information jobs to be shipped overseas...what would stop the firms from doing it? As for the long term, I think you are right memmel that it is not sustainable, but the view of the firms is to make all they can, get out before the roof caves in and let the shit fall where it may. High oil prices do not seem to be a deciding factor in this (remember that our European and Japanese competitors have NO home energy resources...how are they not in far worse than we in the U.S.?)
memmel, you close by saying,
"Thus if I'm right America is a far sicker and diseased nation than most realize its a perverted mockery of the ideas it claims to support. And if I'm right then this perversion will not remain hidden and thats the scary part."
Oh are you SO CORRECT on that point, we are in absolute agreement! And I don't think it is now hidden...the distrust of the banks, the brokers, the "financial advisors", the ratings agencies, the fund managers (mutual,bond and hedge funds alike), and the so called "financial media" (Fortune, Forbes, Money, Bloomberg, CNBC, CBS Market Watch) the brand name financial firms (Merril Lynch, Fidelity, Warburg, Smith Barney, AIG, Morgan Stanley, UBS, and on and on into infinity)...the distrust of ALL FINANCIAL FIRMS is as bad as it has been since the Great Depression, and the public considers the Congress and President who defend them as essentially harlots of the financial community. The "perversion" is out in the open, and it will take DECADES to restore any level of trust in the financial community. It is lost for this generation.
Polling on this is SO informative, in which you get replies from the public (if you give them an open ended question such as "How do you feel about the Wall St. or financial community?", a very common reply is "they make me want to puke." The "perversion" is out there and the trust is GONE. Sorry if anyone in the financial community reads this, but that is just the way it is right now so we may as well face it straight on.
The sad truth is this somewhat irrational (in many cases) misplaced hatred and distrust of the financial community will cause people to miss out on some real opportunities IF they are astute and deal with the financial community as one would deal with wolves, there will be many opportunities...but much of the public is now cowering in the corner, angry, sickened, and confused by what they have seen, and will not be able to judge promising opportunities...
And guess what? If by some miracle oil were to drop to $20 per barrel and natural gas were to go to $2.00 per mm/btu, it wouldn't change one damn thing...the distrust and disgust with the financial barons would still be every bit as strong. The damage has already been done. The demographic change is built in. The technology is out in the world. Pandora's box is open, and all the cheap energy you could whip up IF you could whip it up will not fix the horrific structural and trust issues we face. Sorry, that's just the way it is.
RC
Well how to say this. Oil and money are tightly intertwined I don't treat them as to different entities any more one I stopped doing that it was much easier to understand stuff. However trying to explain oil money if you will is a pain in the arse.
Maybe this will work. Consider nation A with money of some sort does not really matter what but demand for oil and at least enough cash flow to pay the monthly bill.
The interest could be a cumulating on the bill sure but in general if you think about it you can pay your monthly nut for a long time as long as you have cash flow even if its by taking out new cards and transferring the balance etc. This is important because in the long run obviously this fails if you simply fundamentally cannot pay but also its in the long run. And I think we both agree no matter what the long run has run out for the US or is close enough aka < 10 years probably less than five that it does not matter.
However on the other side of the coin so to speak regardless of how the oil producer is paid he needs a customer i.e no customer no money and at least a reasonable belief the customer will pay for a while for the oil even if he eventually does not pay the full bill. Esp if he can earn interest on the outstanding credit.
Next for the US the problem is interesting and its funny you mention Lyndon B Johnson because yes in deed your 100% correct that the vietnam war was the first variant of and attempt to get your cake and eat it to or get the free lunch whatever you want to call it. However this first attempt failed because it lead naturally to inflation as it always had. That was the historical snafu that plagued governments throughout history.
Its almost 3 am so I'll skip quickly to the grand trick.
In any case the problem is not really printing money thats easy to do and done routinely the problem is preventing the follow on inflation. We failed like everyone did throughout history right up into the 1970's to solve this problem.
However drumroll we figured out the magic method. The problem and what causes inflation is not the printing of the money but the spending of the printed money if its spent out in the general economy you get good old fashioned inflation. What you have to do is figure out how to print a ton of money have it reasonably hold its value and give it to someone who won't spend it right away.
The only people in the world capable of doing this sort of thing on any large scale are the insanely rich. If I printed 10 billion dollars and gave it to Bill Gates it would simply sit in his bank account assuming he accepted it. He is one of the few people in the world who you can be reasonable sure that you can give billions too via printing and have it not result in pretty much instant inflation if spent into the economy.
Obviously you can now see that its vital for the US to have a number of insanely rich effective dictators floating around the world willing to accept our money for resources and then and this is the important part don't spend it or at least not right away.
Now of course we are smarter than that and they don't want the money simply sitting their devaluing even if they don't spend it themselves the resources bought with printed money will enter the economy and cause inflation as its a fundamental wealth injection. Your gonna get inflation. The icing on the trick is to turn around and sell government debt with interest in exchange for this cash I just gave you. The ultra wealthy get interest bearing government debt in exchange for cash of equal value. I.e both are worthless if the US Government defaults so its no real difference.
But here is the astounding beauty of the crime. The US government prints money buys resources with or other imports then the sellers turn around and give the money right back to the Government to spend in exchange for interest bearing treasuries that help protect against the inevitable inflation simply from the influx of effectively free raw materials and these days finished goods.
Now they are of course super ultra filthy rich but they can freely spend some of their ever growing hoard of cash and treasuries in any given year. Not enough to cause the scheme to collapse but they are not locked out completely.
On the other side the US government can spend money generally internally but also by expanding private debt to spur demand for the raw materials and keep the cycle going. Obviously over time the Government has to inject more and more cash back into the economy to keep it going as its really a complete farce the whole cycle is not really real outside of whatever cash was actually spent in any given your by our super uber rich partners in crime.
So that the magic trick small wonder that the US has a love affair with tyrants and crooks we have to have them to play our game and we have to make them so stinking rich we can give them more money then they can ever spend as long of course as the send us resources and finished goods.
One day of course the ever expanding Government balance sheet will get so large that these partners in crime will begin to think about hitting the exits and not playing any more. They are ready to cash in their chips and get out. For us it means no more buying of treasuries to extinguish the printed money.
That day is rapidly approaching as you see and no commodities don't fall to really low prices indeed as I've said before there is really no limit to the price in dollars and any other fiat currency as they are all these days tied into this grand scheme. Part of cashing out is of course to start charging massive interest this can be in the form of higher interest rate or rising dollar prices for resources and goods or eventually both. Regardless the dollars are not then used for treasuries but exchanged themselves for internal use aka good old export land kicking into high gear as these former tyrants try to diversify their economies and break their ties with the US.
As I said its late and I'll expand on this over time but I think you can see the grand game now and also see that we are very close to the end of the game.
And hopefully you can see the key role that both commodities and far more importantly uber rich who can't spend the money play in the great game.
The absolute brilliant trick was recognizing that the only way to print money and get away with it and not fall right into hyper inflation was to give it to people who had it coming out of their ears all ready it had to be in exchange for goods to make the whole thing actually do something useful but other than that
Deficits don't matter..
And I'll finish Reagan's statement.
Until they do.
Your almost seeing it all I hope this helps you put all the pieces in place to finish the game. Your right now but only because the game is now ending not because it was not played.
"Voodoo Economics Part II - The Final Reckoning"
I reckon you should call up Oliver Stone with a script. Better make it quick though because if you are even half right then we could all be dead this time next year :-(
Mind you, you might find the release date mysteriously slips
Wall Street: Money Never Sleeps release pushed back
Karma strikes again.
http://blogs.reuters.com/great-debate/2009/01/13/global-imbalances-and-t...
Read the part about the Triffen Dilema.
Can I be a Harvard economist for figuring out the Uber Wealthy Dictator solution to the problem :)
I knew the problem was understood but this was the best and clearest explanation of the problem. We chose the blue pill.
As this key post begins with a 70s mouse pad I thought I'd see what other mouse pads I could find. I think I found one to award you :-)
http://www.cafepress.co.uk/+peak_oil_alarmist_mousepad,276459482

However I'm not so sure about this one!
http://www.cafepress.co.uk/+i_peak_oil_mousepad,55435176

Alan, the Congo is a bit unique - there's a good article in Nat Geo about it - it is ancient, hundreds of feet deep & divided ecologically by many cascades with heavy current. Hundreds of species of fish, many new to science, many unique to short stretches of river, isolated by rapids above and below. Also - the point of damming the Congo is ultimately to increase demand for goods, not to replace high CO2 power sources. I suspect a dam on the Congo will ultimately indirectly result in more CO2 production.
Grand Inga will replace a natural cascade with a mechanical one. Roughly (eyeball map) 15 km of valley will replace 23 km of cascades (much diminished flow).
Grand Inga and the associated HV DC lines could enable most of Africa to go to non-carbon generation. And some aluminum production locally (displacing coal fired Al smelters in Kentucky and oil# & NG fired in the Persian Gulf for example).
I see no way that can lead to increased CO2 emissions (unless it somehow prevents a die-off in Africa). Cheap electricity will also promote more electrified railroads in Africa.
# WSJ reports that Saudi Arabia burns 60,000 b/day to support Al smelter and related employment.
Alan
Alan, I admire your advocacy of non-ff energy sources, always have, and agree with your passion/sense of urgency. This is also an African resource that can't be exported/stolen in any big way...... or can it?. Most of the elec produced will/should be used in Africa, hopefully to the benefit of Africans. This will only be true if BAU in Africa changes. Historically, the average African has realized a disproportionately tiny benefit from the resources the continent has produced, wealth that can never be recovered. I have several concerns:
This project is/will be expensive. How much debt will Africans' incure? If it is financed by private foreign concerns, what are their motives? 40 GW can exploit a lot of resources. How much of this wealth will stay in Africa?
Jevons', and your aside "(unless it somehow prevents a die-off in Africa)" lead to my concern that this energy source will enable a continued disfunctional meme and a continued increase in population and consumption, the last thing Africa (and the planet) needs. My concerns are akin to giving cultures technology or advanced weapons before they are mature enough to deal with the implications. Patronizing, I know. Think Nigeria and Chad. Their relationship with oil hasn't been entirely beneficial to the little guy. How much better will things get in Somalia just because they have clean/cheap? electricity? This energy isn't replacing other sources of energy. It's growth, of a positive sort, I hope.
The Congo River system is indeed a unique, largely pristine ecosystem. How well will the PTB in Africa protect it going forward. Are they willing to exercize the restraint, and invest in the management, that will be required to protect what is already a great national treasure?
Will this project make or break Africa? I'll give you even odds at this point.
One more issue concerning the 1970's-1980's was the move to two income households that Mish mentions in his report.
http://globaleconomicanalysis.blogspot.com/2010/03/unemployment-bet-mish...
This demographic change resulting in a significant increase in household income probably play a role in people not understanding the period.
Those that tried to stick with single income households experienced tremendous pain while those that chose dual income did well.
Indeed given this was women going to work and obviously car sales had slowed it probably goes a long way to explaining the perception of heavy use of mass transit. It was not people not driving it was and influx of new workers. And of course this was deflationary to wages so the original work force experienced pain even as new income was coming in from new "cheaper" women entering the work force.
I thought I'd mention this because I've not really payed much attention to individual perceptions during the period but I'd argue that this is a factor to be considered when you try and interpret what you saw with your own eyes.