| Tech Talk - Iran As an Exporter of Natural Gas | The Oil Drum | Hofmeister: A Difficult Decade Ahead For Oil Prices and Supplies |
Comments on Maugeri's Oil Revolution - Part II
Posted by Luis de Sousa on October 17, 2012 - 2:14pm
This is part II of a guest post by Jean Laherrère, long-term contributor to The Oil Drum. Jean worked 37 years for TOTAL on exploration and production of oil and gas, and since his retirement, has worked tirelessly to analyse the world's oil & gas data and developments.
In part I of this article, Jean looked into Maugeri's concepts of production capacity and reserve growth. It showed how Maugeri's bottom-up analysis is based on optimistic assumptions regarding Iraq and by taking at face value the data published by OPEC. Furthermore, Jean pointed out that man of Maugeri's oil production forecasts are above any projections by any agency, most notably in the case of the US.
In this second part, Jean dissects Maugeri's assumption on reserves growth, on which his optimistic production forecasts relay. It his shown how Maugeri wrongly extrapolates the effects of flawed reserve accounting in the US to the rest of the world. Maugeri's also fails to acknowledge the conflicting reports and reporting practices of the several agencies producing oil data at world level. There are also some important remarks on the Maugeri's concept of conventional oil and other details that bring into doubt the knowledge of this author on the field.
Reserve growth in OPEC members
On page 13 Maugeri starts addressing reserve growth at a global scale:
Reserve growth is a crucial element in the evolution of oil supply, and is often ignored or underestimated. Most analyses on oil reserves and supplies focus primarily on depletion rates of already producing oil basins, subtracting from reserves, and assuming a reduction of future production, without adequately factoring in their reserve growth. This underestimates the production of several oilfields, particularly the larger ones.
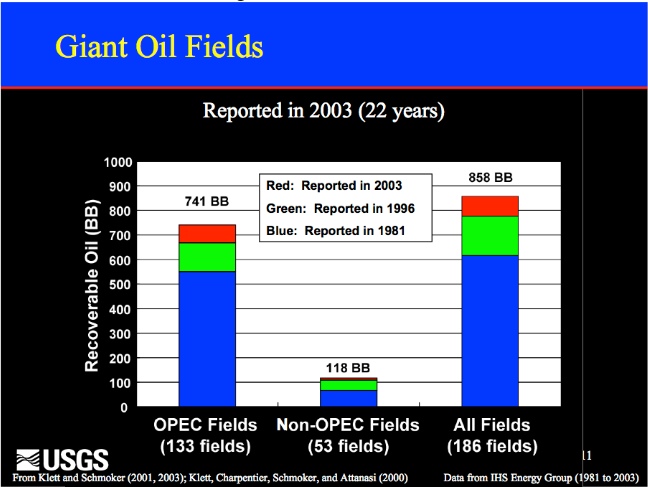
Two prominent geologists from the U.S. Geological Survey conducted a brilliant examination of “reserve growth” on a global scale. According to their extensive analysis, the estimated proven volume of oil in 186 well-known giant fields in the world (holding reserves higher than 0.5 billion barrels of oil, discovered prior to 1981) increased from 617 billion barrels to 777 billion barrels between 1981 and 1996. (Klett and Schmoker, 2003)
Because of “reserve growth,” a country or a company may increase its oil reserves without tapping new areas if it can recover more oil from its known fields. One of the best examples of the ability to squeeze more oil from the ground comes from the Kern River Field in California.
The 2004 USGS paper entitled “Justification for proposing a study of large petroleum fields”, authored by T.R. Klett, displays reserve growth for giant oil fields between 1981, 1996 and 2003. This growth was negligible outside OPEC by 2003.
| Figure 26: USGS 2004: reserves change for 186 fields in 1981, 1996 & 2003 |
|
It is over 100 Gb from 1981 to 1996, but it is well known that during the period 1985-1989, the increase of 300 Gb for OPEC proved reserves represents in fact speculative resources. In the wake of the oil counter shock, OPEC members fought for market quotas expanding their declared deserves, as described in 2007 by the former Saudi Aramco Vice Presidente Sadad al-Husseini. Scout reserves databases are today obliged to report field estimates provided by NOCs since the NOCs are their customers, which was not the case in the past.
Reserve growth is confused by the reporting of remaining proved oil reserves. The only world official oil reserves are those reported by USDOE/EIA, IEA, OPEC and BP. Only EIA and BP provide a friendly updated database for proved reserves for every producing country since 1980. The remaining reserves are reported by the OGJ in January of every year, compiled from an inquiry difused in December, leaving no time for any technical study to be carried out. It is mainly a political statement and when the national agency does not answer (majority of cases), the last value from the previous year is kept. In its latest issue of this, from the 1st of January of 2012, the OGJ reports data updates for only 32 countries, with 109 countries left unchanged, showing clearly that this data has nothing to do with reality!
The source of confusion is that all IOCs are listed in the US stock market and they must follow the SEC (Security and Exchange Commission) rules, which up to 2010 forbade the reporting of probable reserves. Only proved reserves, with the ambiguous definition of reasonable certainty to exist, could be reported; but these figures must be audited. OPEC countries report also proved reserves but without any audit, and the data is completely political.
The most amazing is that it is recognized by the SPE (see my analysis here) that adding field by field proved reserves of a country underestimates the proved reserves of the whole country. It is wrong to add proved reserves but, being this a rule of the SEC, it is done by every one. Only mean field reserves can be added arithmetically to obtain the mean reserves of the country (or of the world). SEC rules were written to protect bankers and shareholders, not to satisfy science!
IOCs keep their oil field reserves data confidential and there are only a few countries that oblige operators to report field estimates: the UK, Norway, the US federal Gulf of Mexico and some other US States such as California. Scout companies sell field reserves data that are 2P estimates because it is the data which is used to decide the development of their fields, based on the net present value computed on the mean reserves. The IOC's 2P reserves satisfy science!
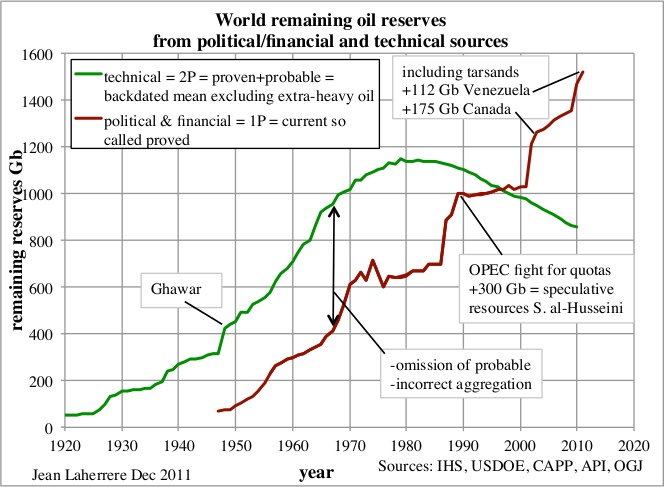
There is a huge difference between the political (OPEC)/financial (SEC) proved oil reserves (as reported by EIA) and the technical 2P figures, as shown by the following graph.
| Figure 27: World remaining reserves from political/financial and technical sources |
|
Conflicting reporting
The most amazing is to find that the USDOE/EIA table of world crude oil proved reserves since 1980, published in July of 2012, provides no definition of the year of report, but the data for every country, except the US, corresponds to the OGJ data published in the 1st of January. For the US the last value is 20.682 Gb for 2009, with NA (not available) for 2010, 2011 and 2012. The comparison with the EIA domestic data indicates that 20.682 Gb corresponds to 2009, but it is on the 31st of December (as indicated on the web version, while in the spreadsheet version it's unclear). The domestic site also reports the value for 2010 being 23.267 Gb. It seems that the international EIA site ignores the EIA domestic site, and no one bothers to check why the definition for the US is different from OGJ data. The EIA reports exactly the OGJ data for the world outside the US, except that the OGJ reports the Neutral Zone (50/50 Kuwait and Saudi Arabia), when the EIA reports Kuwait and Saudi Arabia including their share of the Neutral Zone.
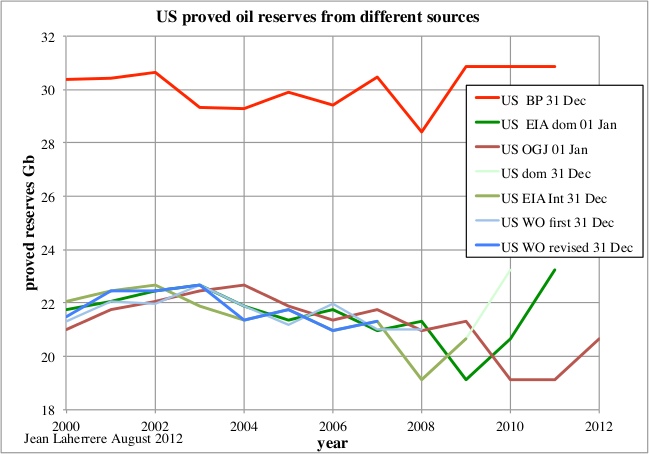
In conclusion, EIA reports reserves at the end of the year for the US and for the rest of the world at the beginning of the year: it is a poor practice! The difference is small because the small variation of the US reserves in front of the uncertainty of the estimate, but the practice is flawed. The value for US proved oil reserves from different sources shows the chaotic EIA reports for crude oil (domestic site at the 1st of January, while the international at the 31st of December) and OGJ (which wrongly repeats the same value for 2000 and 2001) and the large difference with BP, which reports crude oil and NGL at end year. WO reported also reserves at end year and revised reserves for the previous year, but WO stopped reporting world oil reserves in 2009.
| Figure 28: US proved oil reserves from different sources |
|
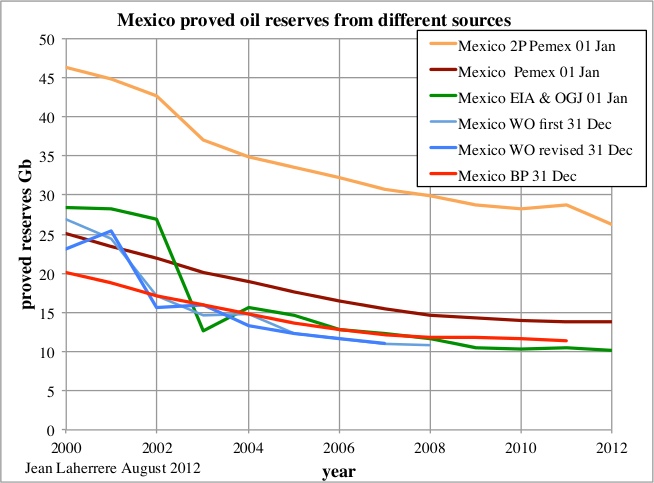
The comparison for Mexico oil reserves shows the difference between EIA/OGJ, WO, BP and Pemex, which also reportes the 2P. Pemex 1P is smooth compared to the erratic EIA/OGJ. It is strange for the EIA to trust more the obviously political and unreliable (reported too early to be technical and never revised) OGJ values than the official Pemex values.
| Figure 29: Mexico proved oil reserves from different sources |
|
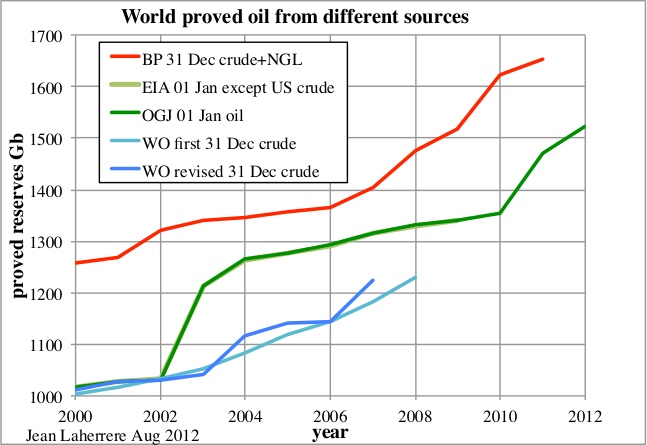
For world proved oil reserves, the difference between the EIA and OGJ is very small, but it is huge compared with BP and WO because of the partial inclusion of the extra-heavy oil. The latter should be reported separately because both the trapping and production are different.
| Figure 30: World proved oil reserves from different sources |
|
All OPEC reserves are unaudited. Only Kuwait values were audited at the request of the Parliament after a paper in 2006 by Petroleum Intelligence Weekly (PIW) reported that Kuwait's proven reserves were about half of what the government claimed. The result was kept confidential, but Kuwait did not change their reserves, likely changing the definition: the rumour was that the audit diminished the proven reserves, but the 2P (proven + probable) was close to the Kuwait value.
In the article “Why Kuwait should keep its oil reserves secret” from the 11th of July of 2007 by Jamie Etheridge we read:
In 1985, OPEC decided to tie proven reserves (the 90 percent category) to production quotas. Under its agreement with other OPEC producers, Kuwait has the right to produce nearly 2 million barrels per day. Its quota is based on Kuwait's official statement that it has 99 billion barrels of proven (remember the 90 percent) oil reserves.
In other words, Kuwait is allowed to produce 2.247 million barrels per day because it has nearly 100 billion barrels in proven reserves. In reality, Kuwait produces around 2.6 million bbl/d, according to the US Department of Energy and official OPEC statistics.
The EIA simply recopies the OGJ data; the only change is that the EIA includes the Neutral Zone (50/50) within Kuwait and Saudi Arabia, when the OGJ reports the Neutral (or Divided) Zone separately. The Neutral Zone proved reserves have been at 5 Gb since 1990, despite significant production in the meantime, and no discovery since 1998!
The case of the Neutral Zone
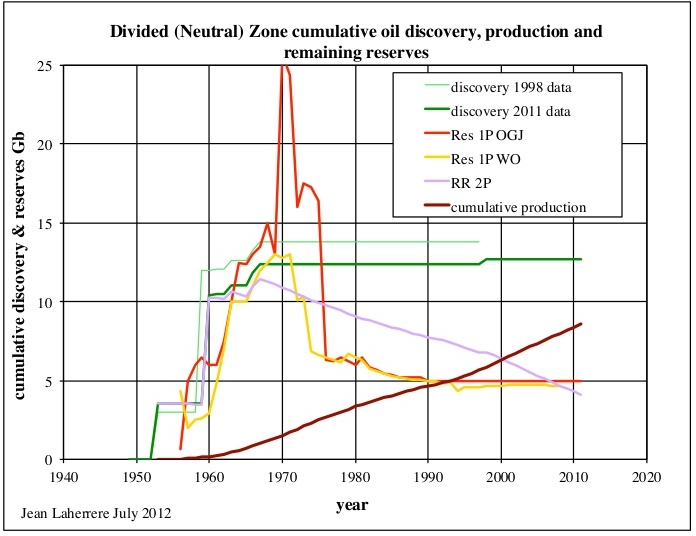
The Neutral Zone cumulative 2P oil discovery is 12.7 Gb in 2011 data, but 13.8 Gb in 1998 data, showing a surprising negative reserve growth. We assume that the oil ultimate is 13 Gb. The Neutral Zone is the only place in OPEC which did not display a large reserve growth during the 1985-1990 period, because its reserves are not involved in the political fight on quotas. Also because the owners of the Neutral Zone (Kuwait and Saudi Arabia) increased their reserves at different moments in time.
| Figure 31: Divided (Neutral) Zone cumulative discovery, production and remaining reserves |
|
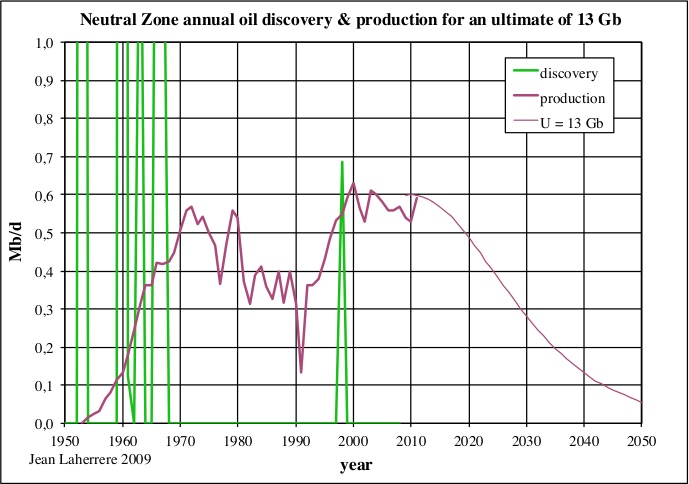
The Neutral Zone production is modelled using an ultimate of 13 Gb, this figure being the asymptote of the cumulative discovery.
| Figure 32: Neutral Zone annual discovery, production for an ultimate of 13 Gb |
|
For Kuwait, the creaming curve with data from 1998, 2009 and 2011 shows an obvious flattening since 1965, and there is no hope for deepwater discovery! Political growth seems to exist in 2009 and 2011 data and we believe that 2011 data should be corrected by 10 %, leading to an oil ultimate of 90 Gb.
| Figure 33: Kuwait excluding NZ creaming curve 1938-2011 |

|
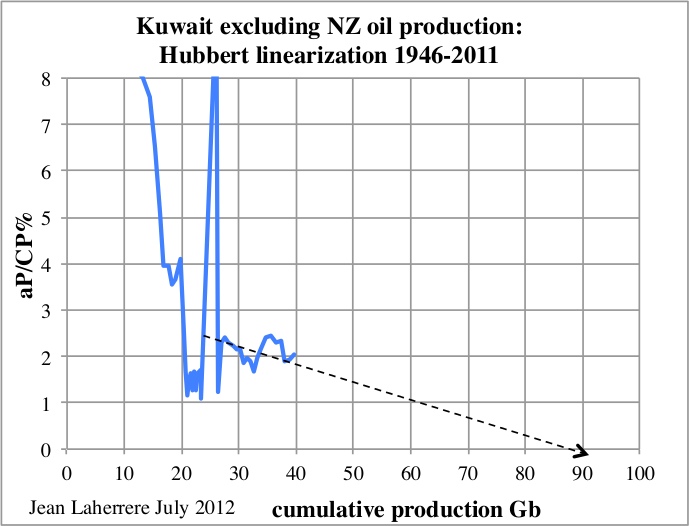
The Hubbert linearization of Kuwait oil production is hopeless for any extrapolation; the data is chaotic because of OPEC quotas and the several wars in the region.
| Figure 34: Kuwait excluding NZ oil production: Hubbert linearization |
|
Kuwait in the larger picture
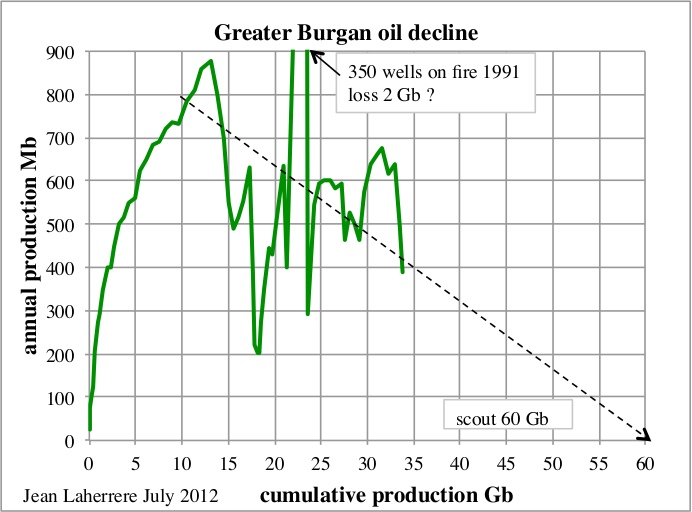
The main Kuwaiti field (and the first found in 1938) is the Greater Burgan. Its annual production data is hard to find and chaotic for the same reasons above (in particular with 350 wells set on fire in 1991). Its ultimate is reported to be 60 Gb, but it is impossible to confirm with reasonable accuracy regarding its present oil decline.
| Figure 35: Greater Burgan oil decline |
|
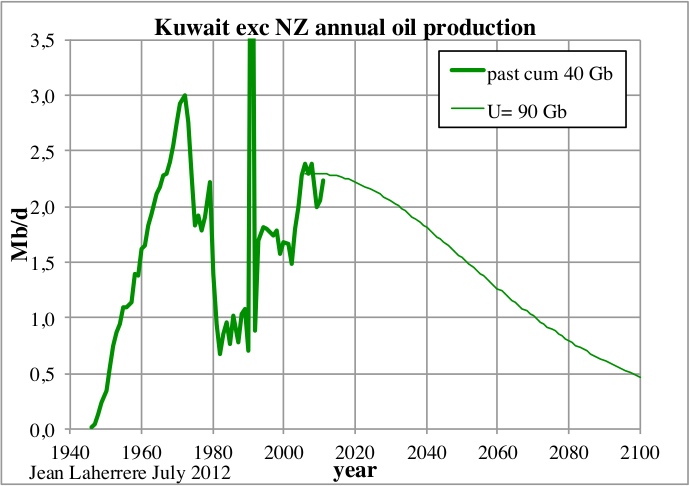
Assuming an oil ultimate of 90 Gb with a cumulative production of 40 Gb at the end of 2011, the forecast of annual oil production shows that in 2100 Kuwait will still be producing 0.5 Mb/d.
| Figure 36: Kuwait excluding NZ annual oil production & forecast for an ultimate of 90 Mb |
|
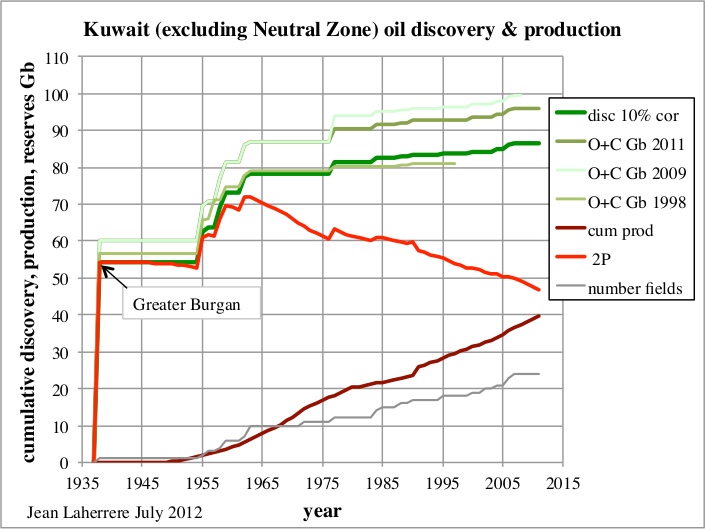
Following is the cumulative oil discovery and production for Kuwait without the Neutral Zone with the data from 1998, 2009 and 2011 editions (in green) for a total of 24 fields.
| Figure 37: Kuwait (excluding NZ) cumulative discovery, production and remaining reserves 2P |
|
There is a significant increase from 1998 to 2009 data due to the fact that more and more scout field databases are obliged to report OPEC values in order to not upset national agencies. It is the same for BP which reports only national agencies reserves and not their own. But in 2011 there is a surprising negative reserve growth, as it is shown for the Neutral Zone. The comparison of remaining 1P reserves (OGJ & WO) and the technical (correction of last data by 10%) 2P shows clearly that the reserves increase by Kuwait in 1984 of 50% is merely political.
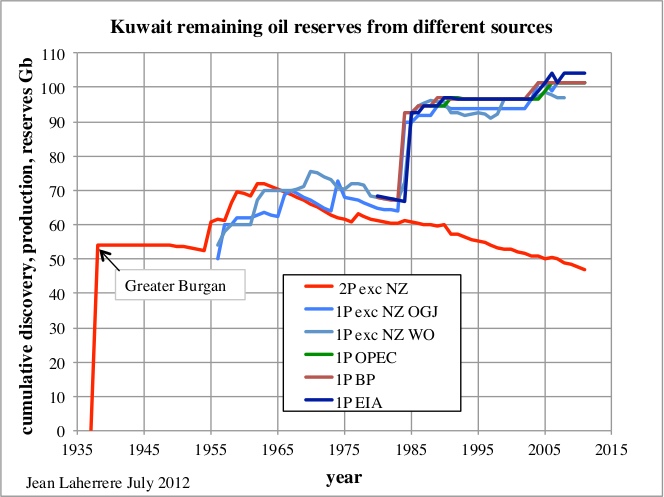
Kuwait's oil reserves from different sources vary, including or not the Neutral Zone, suffering also from the discrepancy between the 1st of January and the 31st of December. Confusion is the rule in order, to avoid comparison.
| Figure 38: Kuwait remaining reserves from different sources |
|
The fires set by Saddam Hussein in 1991 burnt somewhere between 4 Mb/d and 6 Mb/d, mainly in Burgan, summing to estimated total of 2 Gb , but this is hardly noticeable in the 2P values.
The reserves display by country (with over 10 Gb of proved oil reserves) from the OGJ shows clearly the drastic step increases, when in reality reserves vary slowly, except when supergiant fields are discovered. This data is strictly political and should be ignored! But it is the only data shown by the OPEC countries, still constrained by their fight on quotas? Might we have to wait for OPEC quotas to disappear, so that the truth can be known?
| Figure 39: remaining proved oil reserves by country >10 Gb from OGJ |

|
The reserve growth in OPEC claimed by Maugeri is very questionable because of political fights between OPEC members over quotas. The political increase of 300 Gb in OPEC reserves between 1984 to 1989 has been described by ASPO as political, but is attributed to technological progress by most analysts. In 2007 the retired Vice-President of Suadi Aramco, Sadad al-Husseini, stated in London at the Oil and Money conference that these 300 Gb were speculative resources, confirming the ASP0 claims! Scout databases (in particular IHS) are obliged to report OPEC field data when reported by OPEC members.
Kern River and accounting rules in the US
Maugeri’s claims of reserve growth in the US, by taking as example Kern River, is also comparing apples and oranges. The reserve growth at Kern River is due to SEC rules, which is a very poor practice to represent the truth. Maugeri used already Kern River in his 2009 Scientific American paper and I criticized it.
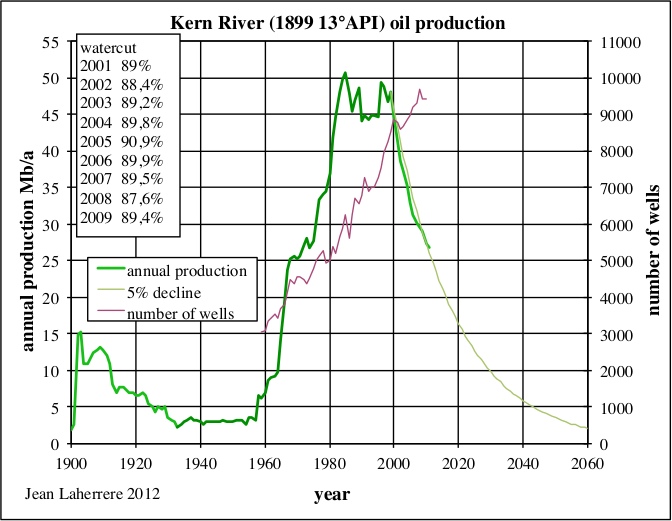
Kern River was discovered in 1899, containing heavy oil (13% API), as is Midway-Sunset, discovered in the same basin in 1894. Its production needs steam injection (tertiary recovery, which makes it an unconventional field) and started to increase in significant quantities in 1960, with an increase of producing wells, from 3000 to 9500 in 2010. The peak of production was between 1982 and 2000 (one century after discovery) and since 2000 production declines by 5 %/a, despite a still rising number of wells. Its present watercut is around 90%.
The California Department of Conservation provides all the data since the start. Here there is no problem with data.
| Figure 40: Kern River annual oil production 1900-2010 |
|
Following SEC rules, only proved reserves around producing wells are allowed to be reported (a change since 2010), while the known undeveloped part of the field cannot be reported as reserves. So reserves grow with the number of wells and this reserve growth is merely due to poor rules and accounting practices. A rule of thumb often used in the US (even by the USGS) is to report as reserves ten times the present annual production.
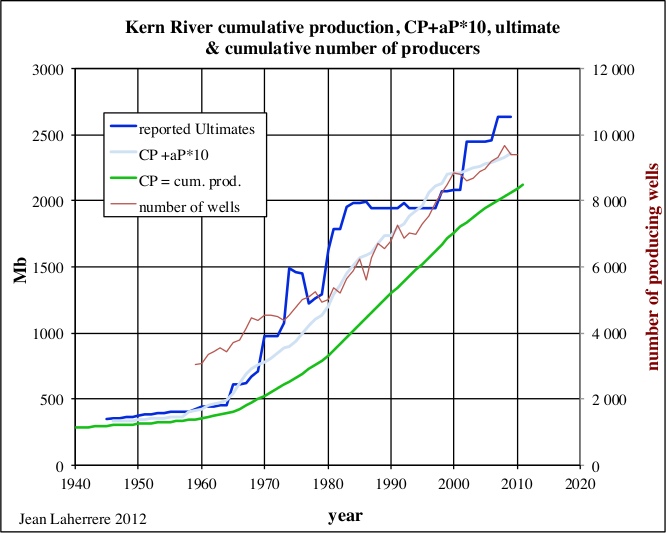
The reported ultimates for Kern River from 1945 to 2009 can be compared with the number of producers, the cumulative production and the ultimate computed by adding the cumulative production with ten times the annual production. This plot (light blue) follows the trend of the reported ultimates (dark blue), but whenever it is larger than the reported ultimate, this value is increased.
| Figure 41: Kern River cumulative production, number of wells & ultimate 1940-2011 |
|
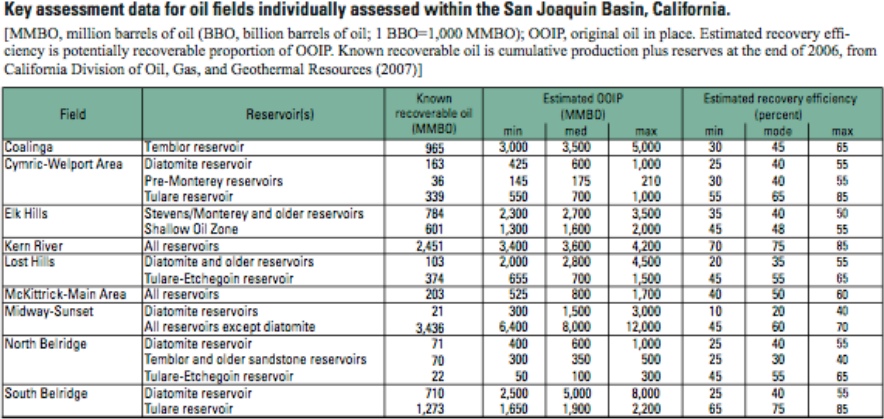
In the USGS report "Reserve Growth Assessment Fact Sheet-Assessment of Remaining Recoverable Oil in Selected Major Oil Fields of the San Joaquin Basin, California", from April of 2012, we read:
In the 1960s, introduction of thermal recovery technologies (application of steam technology) caused abrupt and substantial additions to reserves in fields that contain heavy oil (American Petroleum Institute (API) gravity less than 20 degrees). Similar additions to reserves have continued to the present. During the 1980s, reserve additions began to be made using hydraulic fracturing in Monterey Formation diatomites (sedimentary rock made up of the tiny silica skeletons of diatoms) on the west side of the basin. These additions have increased as production from diatomite replaces declining, but still substantial, production from overlying steam-flooded reservoirs. Since 1965, more than 8 billion barrels of recoverable oil have been added to reserves within existing fields.
| Figure 42: USGS 2012: reserves, oil in place & recovery factor in San Joaquin basin (click for full version) |
|
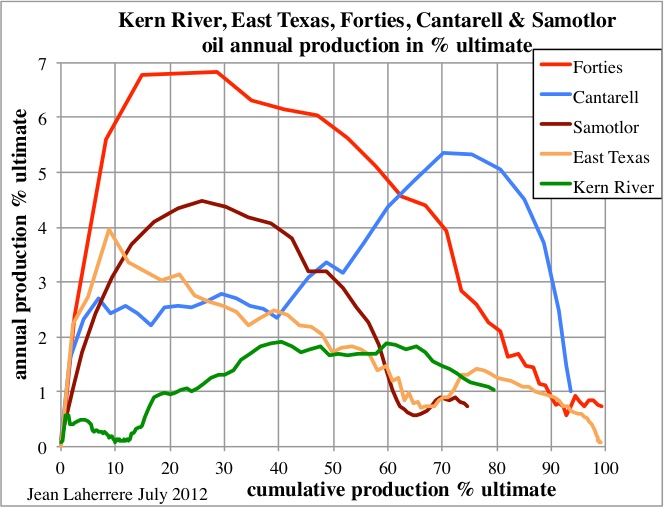
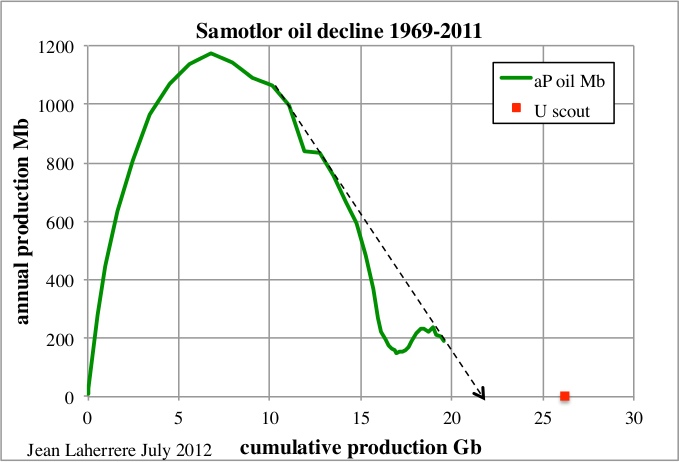
Kern River displays a different pattern when annual production is plotted as percentage of its ultimate from production start, when compared to East Texas, Forties or Samotlor or even Cantarell (Akal-Nohoch field using an unconventional nitrogen injection). The ultimates are estimated to be 2.6 Gb for Kern River, 2.7 Gb for Forties, 5.4 Gb for East Texas, 14 Gb for Akal/Cantarell and 26 Gb for Samotlor.
Kern River is a very poor reference for claiming reserve growth, for it is an unconventional field with a completely different behaviour. Maugeri should have taken a conventional field as East Texas for reference, but he has preferred not to, because East Texas is the case of a large negative reserve growth, with the present estimate at 5.4 Gb (almost depleted) when from 1970 to 1990 the OGJ ultimate was 6 Gb, 10% higher than reality. It is the same negative growth for Brent oil reserves estimated by the Brown Book 2000 at 368 M.m3, when now the estimate (Brent is almost depleted) is 322 M.m3, or 13% less.
| Figure 43: annual oil production in % ultimate for Kern River, East Texas, Forties, Cantarell & Samotlor |

|
The plot of these five fields in annual production as percentage of the ultimate versus cumulative production as percentage of the ultimate shows clearly that Cantarell and Kern River are unconventional fields. They contrast with East Texas, Forties and Samotlor, that display similar behaviour among themselves. Forties, being offshore, is recovered faster, with a 7% rate at peak, when this value is less than 5% for Samotlor and 4% for East Texas (using only primary recovery because secondary recovery with water injection started after 70% of the cumulative production was produced). Cantarell used nitrogen injection only after 50% of cumulative production.
| Figure 44: annual oil production in % ultimate versus cumulative production in % ultimate for Kern River, East Texas, Forties, Cantarell & Samotlor |
|
The reported ultimate of 26 Gb for Samotlor is difficult to be confirmed by the oil decline, because of the collapse at the breakdown of the Soviet Union. A smaller ultimate is possible!
| Figure 45: Samotlor annual oil decline 1969-2011 |
|
Important details
From page 20 of Maugeri's report:
From 2000 on, for example, crude oil depletion rates gauged by most forecasters have ranged between 6 and 10 percent: yet even the lower end of this range would involve the almost complete loss of the world’s “old” production in 10 years (2000 crude production capacity = about 70 mbd)
Maugeri confuses depletion and decline. And his computation seems loose, according to this comment by Heading Out, here at TheOilDrum in the 1st of July:
A 6% decline rate over 10 years would amount to 54% of the original amount, not "the almost complete loss...." Mistake or propaganda?
From the available annual oil production by field, it appears to me that the databases are to questionable, contradictory and incomplete to get a reliable estimate of the world decline rate.
In page 22 Maugeri produces the following graph:
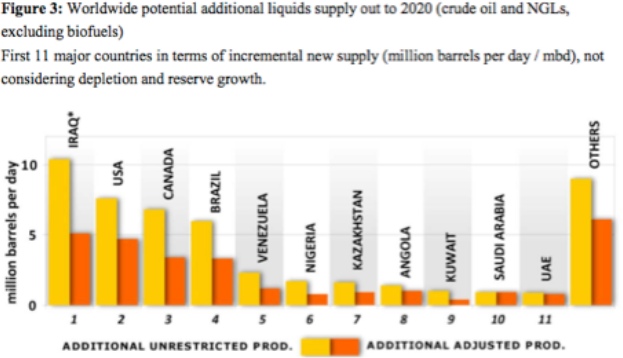
The additional adjusted production from 2011 to 2020 for the US is given by Maugeri on his Figure 3 as 4.7 Mb/d. But USDOE/EIA AEO 2012 forecasts only for crude oil production an increase of about 1 Mb/d for the same period, 2020 being a secondary peak, as shown on this graph displaying AEO forecasts from AEO 2000 to AEO 2012. The display looks chaotic, showing clearly that the forecast is unreliable!
| Figure 46: change of EIA forecasts on US crude oil production from AEO2000 to AEO2012 |

|
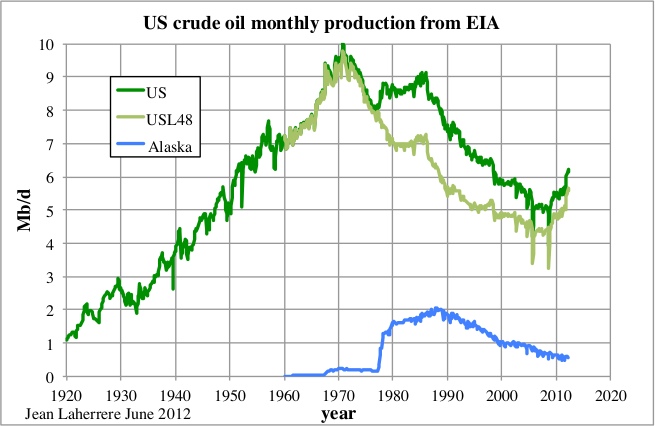
This forecast annual peak at 6.7 Mb/d for 2020 should be compared to the previous peak in 1970 which was close to 10 Mb/d.
| Figure 47: US crude oil monthly production from EIA |
|
In page 55 we find the following table:
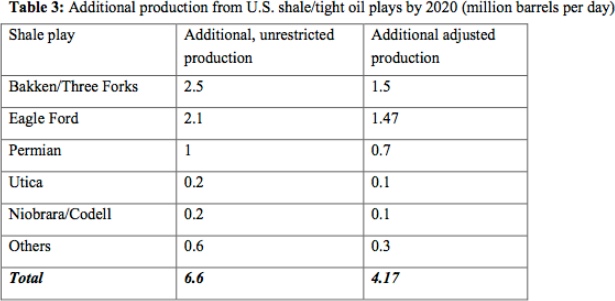
The term shale oil is now old fashion and replaced by tight oil! The word shale is now associated to hydraulic fracturation (called fracking in the medias) and has gained a bad reputation. It is time to use a better term!
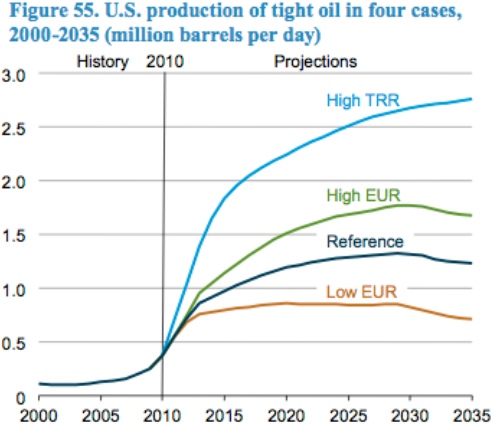
Maugeri forecasts an increase of tight oil production of 4.17 Mb/d (admire the accuracy!) from 2010 to 2020, when AEO 2012 (figure 55) forecasts an increase of 0.8 Mb/d in its reference case and a maximum of 1.9 Mb/d, less than half of Maugeri’s claim!
Like I always say, when more than two significant digits are given, it means that the second is surely wrong and likely also the first one, because the author has a very poor understanding of the accuracy of the data!
| Figure 48: AEO 2012 forecast on US tight oil production 2000-2035 |
|
From page 64:
The oil market is already adequately supplied with spare capacity of around 4 mbd [...]
The IEA Oil market report for July 2012 states: "OPEC's effective spare capacity in June was 2.35 mb/d", far from Maugeri’s 4 Mb/d. But this 2.35 Mb/d is also wrong!
And in page 66:
The shale/tight oil boom in the United States is not a temporary bubble, but the most important revolution in the oil sector in decades.
Bakken production in Montana (see figure 17 in part I) looks like a temporary bubble, as it was for the peak in 1968. The most important revolution in discovery was first the anticline model in surface geology, then the seismic common depth point and lately the deepwater.
In the aggregate, conventional oil production is also growing throughout the world, although some areas (the North Sea, face an apparently irreversible decline of the production capacity. In most traditional producing countries, old oilfields go through a production revival thanks to better techniques and knowledge, or advanced exploration and production technologies, so far used only in the U.S. and in the North Sea. Huge parts of the world are still relatively unexplored for conventional oil (for example, the Arctic Sea or most of sub-Saharan Africa).
The production of crude excluding extra-heavy oil, which is beyond conventional for most, is plateauing since 2005 as seen in figure 13: it is wrong to claim that the world conventional oil production is growing. It is difficult to say that the Arctic sea is conventional oil!
From page 70:
Usually, once a company (or country) determines the producible reserves of a field (after having assessed its proven reserves, its initial rate of recoverability, and its costs) and begins to invest in its development, it is rarely wrong.
Maugeri seems to ignore that the decision of developing a field is taken from the "net present value" of the estimated entire production based on mean reserves. Mean value (probability of about 45%) is far from proved value (probability assumed to be 90%). The proved reserves are only considered for not being too negative in the unlikely case that it occurs (there is a 10 % probability that the reserves could be lower), with a bad impact on the company assets.
Presentation at CSIS
Maugeri's presentation at CSIS also contains remarks worthy of further reflexion.
Slide 2
Limited Exploration Only 1/3 of world’s sedimentary basins has been explored
This is a poor stand in front of claiming that technology has greatly improved. If only one third of the world‘s sedimentary basins are explored, it is because geochemistry (which can quickly estimate how much oil or gas the basin has generated with few samples of the source-rocks) has recognized that there is little potential to explore in two thirds of the world sedimentary basins. Every sedimentary basin has been drilled (even Antarctica with JOIDES/OPD wells) or sampled. Antarctica (exploration is forbidden for a while) has a poor oil potential as far as I know.
No current technology is capable to give an answer to the question "how much oil lies beneath?"
Maugeri seems unaware that geochemistry, using Rock-Eval equipment and source-rocks samples, can evaluate the amount of oil and gas generated by the source-rock.
Slide 3
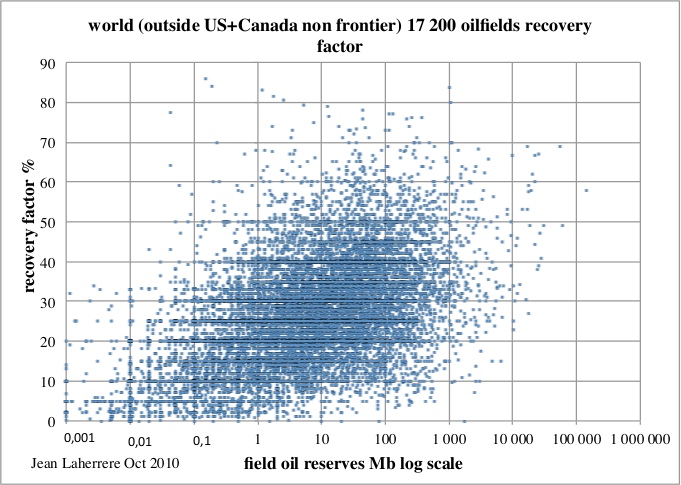
On average, less than 35% of already known oil is extracted today using business-as-usual technologies.
More expensive tech may dramatically increase oil recovery.
The range of the oil recovery factor is from 0.1% to 86% (East Texas) and the cloud is so large that an average has no meaning and varies form the way it is computed. The median value is 41% when calculated from cumulative reserves or 25% if calculated from the cumulative number of fields.
| Figure 49: world (outside US & Canada onshore) 17 200 oilfields recovery factor |
|
Business as usual is for economists but production engineers do not care for BAU because the recovery factor depends mainly upon the geology of the reservoir. Technology cannot change the geology of the reservoir, but technology (horizontal drilling in particular) can help to produce faster, but no more (sometimes less) and with many examples like Yibal, the largest field in Oman, Rabi-Kounga, the largest field in Gabon, like Cantarell (figures 41 & 42) yielding a sharp decline.
Further reading
There are few papers which agree with Maugeri’s oil revolution, like George Monbiot (who speaks about enough oil to fry us all!), but there are many papers which disagree:
Richard Heinberg, "Peak denial" 2 July 2012
Dave Summers "Tech Talk - New Energy Report from Harvard Makes Unsupportable Assumptions" 2 July 2012
Steve Sorrell "Commentary on Maugeri’s decline rate assumptions" 6 July 2012
Sadad al Husseini "Commentary: Dr. Leonardo Maugeri’s "Oil: The Next Revolution"" 14 July 2012
Olivier Rech "«Nier l’imminence du pic pétrolier est une erreur tragique», dit l’ancien expert pétrolier de l’AIE" 9 juillet 2012, par Matthieu Auzanneau
Olivier Rech "«Denying the imminence of Peak Oil is a Tragic Error», says ex- IEA petroleum expert". 09 juillet 2012
Chris Nelder "Is peak oil dead?" 24 July 2012
David Strahan ""Oil glut forecaster Maugeri admit duff maths" 30 July 2012
Ugo Bardi "Ugo Bardi: Strahan demolishes Maugeri" 30 July 2012
Ugo Bardi "Peak oil debunked? The mechanisms of denial at work" 17 July 2012
Contact
- Content: editors at theoildrum dot com
- Tech support: support at theoildrum dot com
License

This work is licensed under a Creative Commons Attribution-Share Alike 3.0 United States License.
Jean, thanks for a very detailed and painstaking article!
Ok, so here's a crazy suggestion... the official figures for oil production and reserves are unreliable at best: So how about TOD produces an open-source database of best-guess peer-reviewed scientific numbers? We could raise the cash to subscribe to the proprietary data sources right? And persuade some other people to open up their data?
Seems to me a decent database would be a good jumping-off point for many future papers, so people like Jean don't have to do this hard 'debunking' work every time.
Jon.
I do like the last figure, which is something I have never seen before. Modeling the recovery factor is the only part that I am not satisfied with. We know that the recovery factors can be anywhere from 0% to 100% but don't have a good understanding of the statistical distribution.
I took a shot at this in The Oil Conundrum and did offer up a stochastic model (see page 148), and now should be able to check it against the scatter plot that Jean Laherrere has provided. I will plot it up and compare against this particular chart within the next day or two. Watch this space.
Original Oil in Place 'estimates' are all over the map too, usually more of a problem with smaller fields.
Sometimes OOIP is apparently underestimated, as in the case where the operator wants to make Polymer Enhanced Waterflooding look real good, for example:
http://www.onepetro.org/mslib/app/Preview.do?paperNumber=00020234&societ...
Sometimes OOIP is apparently overestimated to increase equity in a proposed unit, for example:
http://wogcc.state.wy.us/UnitMenu.cfm
You will have to select "Bronco" as Unit name and open the feasibility study pdf.
Sometimes OOIP is underestimated or overestimated because later drilling proved or disproved interpreted reservoir volumes. Sometimes OOIP is misstated because the operator relied on faulty electrical logging parameters, or used the wrong logging suite for the mud type.
When I generate an estimate of OOIP I produce a probability distribution ranging from 1% (the highest plausible volume) to 99% (the lowest plausible volume), and there is often a 10:1 variation between these extremes. In between is a 50% value, which is a best guess kind of figure.
You must be refering to variations that occur early in the field development or for 'unconventional' reservoirs. My references were 'conventional fields' with development complete or apparently complete.
And there is another article out today touting the Maugeri paper:
Global Oil Production Set to Skyrocket
This is astonishing. The paper is so shallow and just plain wrong in so many places. Maugeri has Iraq producing 7.6 barrels per day by 2020. But even the IEA has debunked this silly notion: Iraq oil: More realism from IEA
Ron P.
But Ron, where is your sense of optimism?
When you read stuff like that, you really wonder what will happen after the first few years at minus few percents ?
- big wave of grasping what is going on ?
- disbelief and finger pointing ?
- economy in such a state that there will be enough and price not necessarily much higher so that "it's only for a while" (probably the case)
Thanks for those links, Ron. They dropped my jaw big time! I'd figured Iraqi investment was a bit short of the mark, but nowhere near that low.
What most people fail to realize is that Iraq is not putting up anything, all the investment is supposed to come the oil companies. And their cut is to be, in most cases, less than $2.00 a barrel for all new produced. The oil companies are just unwilling to make such a gamble for such a small return.
I have read that the oil companies hope to renegotiate their contracts for a larger cut. I don't know what kind of luck they are having with that. At any rate I don't see them sinking billions upon billions into such a shaky proposition. Iraq is still very politically unstable you know.
Ron P.
Ron,
The 2$/barrel revenue paid to the IOCs is for production (above target thresholds) on established giant fields, such as Rumaila. The IOCs can also recover costs associated with any redevelopment work. As you say, the Iraqi government plan is to bring in IOC expertise (and finance) to get these fields producing at levels more in line with their undoubted huge potential. Even so, it is a slim profit and has a high cost start up.
In the north, in the Kurdistan area, they offer more generous cut (I seem to recall a figure of 10%-15% on new contracts, after cost recovery, being mentioned by the Kurdistan Natural Resources Minister, Ashti Hawrami, at a talk in London - someone else may have more up-to-date info on this). This is for new discoveries.
The result is that IOCs are being tempted to the Kurdish area (even risking barring by the official Iraqi government), because it offers the following:
a) the opportunity to partner in new discoveries
b) a reasonable return on future production
c) Implementation of petroleum laws, in line with typical western modes of operation.
By inference, these IOCs have probably assumed that the south, having failed to sort out petroleum laws for 9 years, are unlikely to change soon, and it is also unlikely that the political stalemate between the Iraqi government and the Kurdish authorities will be resolved quickly.
http://www.forbes.com/sites/christopherhelman/2012/08/02/its-big-oil-ver...
From Stuart Staniford's Oil Drum Thread: Iraq Could Delay Peak Oil a Decade
The depletion figure is the amount that the field would be depleted if those reserve numbers are correct and the plateau figures were actually reached. Neither is accurate.
Ron P.
The 1968 peak reflects the developement of Bell Creek Field. That is a Cretaceous 'muddy' field, not Bakken. Bell Creek offers a case study in reserve growth, however. The 1968 estimate* of OOIP was 325 e6 stb and recoverable oil was 130 e6 stb.
Cumulative production to date is 133 e6 stb and is still producing at an economic rate. The operator currently estimates OOIP at 353 e6 stb and expects to recover an additional 30-50 e6 stb by CO2 EOR. That would amount to a 9% increase in OOIP and 25 % increase in recoverable oil.
I believe the 30 e6 stb figure is proven undeveloped pending completion of the 'Greencore' pipeline which is expected by year-end(pdf):
http://www.uwyo.edu/eori/_files/co2conference12/russ_denbury_bell%20cree...
Denbury recently swapped ND Bakken acerage for $.$ e9cash plus Exxon's interest in Hartzog Draw Field, another CO2 EOR project.
*1968 estimates are from 'Development History, Bell Creek Field, Powder River County Montana' by Fred A Haddenhorst, Published in the 1968 Wyoming Geological Association Guidebook.
Tony - A little bit of trivia about Hartzog Draw. Back in 2000 I geosteered 4 horizontal wells in the field for XOM. Terrible vert recovery; over 500 wells doing about 10 bold per well. Poor water flood results. They thought the hz wells might do 40 - 60 bold. But they were coming in at 300 - 400 hope. XOM never did anything after those 4 wells and sold the field a year later. Back then there was talk of layinga big CO2 line from SW WYO.
I am curious about your acronym Rockman. I assume "bold" is barrels of oil per day but I have no idea what "hope" is.
Ron P.
LOL. Sorry Ron. Been on a drilling location since early Sunday morning. Between not enough sleep and fingers too fat for an iPhone I'm a tad sloppy at the moment. Also a tad distracted at the moment: yesterday morning had a big drug bust start about 200 yds from my rig. Local cops did a traffic stop and caught a truck with a load of drugs. Had Home Land Security chopper buzzing the area, mounted local deputies, DOJ bloodhounds (yep: didn't know DOJ had dogs either) looking for the 2 of 7 that ran on foot into the mesquite. Still hunting them now I think. Times like this I really appreciate my concealed carry permit. LOL.
If you search "Victoria drug bust" you'll probably find the story.
Okay, I assume you did not mean to type "hope" at all but meant to type "bold" instead and those wells really come in at 300 to 400 barrels per day, several times what they had hoped for. With success like that why did they do nothing after those four wells then sell the whole project?
Interesting story about the drug bust.
Ron P.
Ron - Difficult to believe but this is how the big guys function some times. They had the 4 hz wells budgeted and that was it. The local field production hands told Houston they had about 70 more hz wells they wanted to drill. Afterwards I got a message from Houston: if I talked to the field folks again my contract would immediately terminated. IOW stop stirring up the locals. Honest injun...I'm not kidding. IMHO the only reason XOM survives today is because of their size due to their old heritage fields that real oilmen discovered.
Yes, Exxon sold that one to XTO, then got it back when they bought XTO. The CO2 pipeline from SW Wyo was extended to Salt Creek, maybe 10 years ago. Anadarko is doing a CO2 project at Salt Creek and Teapot* and claim success.
The Greencore pipeline, mentioned above, ties in to the SW Wyo pipeline at Salt Creek.
http://www.denbury.com/files/doc_presentations/2012-10%20IR%20Presentati...
Anadarko and Devon are also partners in Hartzog Draw.
*Teapot of Teapot dome scandal (in)famy, during the Harding Administration.
I don't know what you are talking about.
The Hartzog Draw Unit committee estimated volumetric OOIP of 353 e6stb. 'Effective' OOIP (effective to 160 acre spacing) was estimated at 262 e6stb.
Ultimate primary was estimated at 40.7 e6stb(16% of effective OOIP) and 30.5 e6stb(12% of effective OOIP) incremental for secondary waterflooding ,a total of 71.2 e6stb, 27% of effective OOIP.
Production through 2010 was 116 e6 stb which is 44% of effective OOIP or 33% of volumetric OOIP. Based on the technical committee's estimates, this was at least a modest success. I sure dont' see where that amounts to 'poor' waterflood results ?
I don't have extensive experience with Hartzog draw, but based on readily available data, this sounds like a reasonable prospect for additional infill drilling and CO2 EOR.
The data is all here 1)feasibility pdf and 2) ye 2010 plan of development:
http://wogcc.state.wy.us/UnitMenu.cfm
Tony - XOM engineer's words not mine. Don't know anything about reserve volumes...I was just well site geologist. But they did have over 500 wells doing a total of around 5,000 bold at that time. Infield drilling for sure. My 4 hz were drilled in an area of the field where they stopped vert drilling due to poor results. The IP's were impressive but I have no idea if the held up. Re: XTO a Denver geologist who tried to buy the field told me XTO bought it for coal bed methane more so than the oil.
Coalbed methane, that is a quaint concept. It was the only game in town and engineers and geologists reinvented themselves as 'coalbed methane experts'. Companies were getting methane tax credits which could be traded around.
All in all, I dont think it did the oil and gas industry much good(refering to wyoming), although the numbers are/were impressive. What we have now is excessive plugging liabilities. It wasn't much of a fit for Exxon, and to their credit, they got out.
Companies are still drilling a few of these coalbed methane wells.
Tony - Yep, CBM was hot for a while. Was one factor that helped destroy one of my former companies: Transco Exploration. Too long a story but they dropped $100 million in Mississippi before they discovered a foolish mistake in their strategy. I also geosteered the first hz CBM well in Alabama: a 1,200' lateral in a 3' seam. El Paso thought they would be the Queen of CBM a d talked of drilling 600 more once they proved their model. Not positive but I don't think they drilled anymore st least in that area. One problem they didn't anticipate: being able to stay in a 3' window in an area with 10' to 20' faults they couldn't may. I had to side track that well 3 times.
The more I read superb analyses like Luis' here, and the more I go back through Maugeri's report, the more strongly I feel that "Oil: The Next Revolution" is not so much mistake-ridden as a positive act of intellectual fraud. I'm no oil market professional like many on this site--merely an interested observer, and this is only my impression, but I'm familiar enough with literature in general to be aware of when a writer is making hackish mistakes versus deliberately conflating concepts. On pages 19-20 Maugeri comes close to equating decline rate and depletion rate--a point which has been raised on this site more than once--and it seems to me, in combination with all the other analytical problems in this report, that this almost-equating two very different things is intentional. I'm becoming convinced that Maugeri's report is a deliberate attempt to advance a known-false argument of cornucopia.
Agramante, credit where credit is due. This is not Luis' analysis, that honor belongs to Jean Laherrère.
Also I must disagree with you on the "known-false argument" part of your argument. True, I think it is a deliberate attempt to discredit the peak oil argument, but I think Maugeri really believes the crap he wrote. Maugeri, though he was a Senior Executive Vice President at Eni, his degrees are in Political Science and Economics. Apparently he knows beans about geology. After all, few economist do.
I have read a few of Maugeri's articles. They show a man completely devoid of any knowledge of oil geology at all. for instance: The Crude Truth About Oil Reserves: The coming century will overflow with petroleum.
Now I know he apparently got this data from the National Petroleum Council, whomever they are, but apparently he believes the US actually have 374 billion barrels of recoverable crude oil reserves. Only a fool would take that at face value.
What I am saying is I don't think Maugeri is engaged in any kind of conspiracy to discredit peak oil. He is only writing what he truly believes, the same thing all such right wing cornucopians believe.
I just looked up the "National Petroleum Council", they are: "An Oil and Natural Gas Advisory Committee to the Secretary of Energy". No wonder our energy policy is so screwed up.
Ron P.
Oops--quite right, Darwinian, the post is Jean Laherrere's. My error.
Perhaps it's too strong of me to impute a motive into Maugeri, but I've become accustomed in recent days to very cynical and misleading public discourse. Given the fundamental importance of the global energy market, I might have been wrong to apply the reasoning I apply to other sectors of discourse.
Still, not all of that paper is about geology. I'm no hard-rock geological prospector, but I have studied marine sedimentology and I'm not ignorant of the physical processes involved in the creation, storage and production of oil. And terms like "depletion rate" and "decline rate" seem as much economic as geologic to me--really, those concepts are the point of contact between the geological world of oil in the ground, and the economic of product available to market. And even if Maugeri is no geologist, it seems somewhat incredible to me that he could innocently mix those terms up. But it's very possible he did.
In any event, it's quite depressing that such flawed analysis is touted so highly. But it's hardly the first time!
a - I won't offer a judgement call on the sincerity issue. But along the lines of Ron's comment: there is a long standing truism in the oil patch: there are few things as dangerous as a geologist (or reservoir engineer too, I suppose) that believes his own crap. Really. We'll pound the table and beat you into submission with tons of data supporting our position. I've known geologists who were so sure they invested their own money into what was actually a poor idea. Unlike me many geologist have big egos that can cloud their judgement. But I've seen more than one geologist push projects they had little faith in just so they could get a paycheck out of it.
.
What did Deep Throat tell W and B in All the President's Men? Follow the money. Why is this article being written and who for? I believe in many things, really believe in them, and seldom write about them.
He is going to this effort for something and someone, IMO. It is too flawed to be anything else.
Regards...Paulo
Yes I think it is clearly the case, and one has to admire Jean's patience in going over this, which is for sure valuable for people having some doubts about it.
I read part of his book about oil history (on google books), and quite characteristic that he is able to write :
And a few pages down :
and :
I'm just starting to read comments and was going to post this in its own thread but noticed the text you highlighted, and think this will serve better as a reply; it's a graph I made of state-by-state production for the US:
"Louisiana" includes both that state and all offshore GOM. Data from James Hamilton. It's intriguing that the late 60s/early 70s saw peaks both local and ultimate for various major producing states. Arab OPEC took note of this fact and were more confident when unsheathing the Oil Weapon for the 2nd time, I'd reckon.
KLR - OPEC wasn't the only aware of the shift. You may have seen me mention it before but during my first week with Mobil Oil in 1975 my mentor told me the party was over in the long term. He was talking not just about PO ( he called it the reserve replacement problem...not PO) but who was going to be controlling the oil: the NOC's. Especially in the ME. Kinda shocked me when he suggested I look for another company in few years. In his opinion Mobil Oil was not in a good position to go forward. And sure enough not long after I bailed Exxon gobbled them up.
Interesting chart thanks. Hope you don't mind if I make it a bit bigger here on the main page. Maybe someone could add in a North Dakota/Montana daily production line and bring everything forward into 2012.
kudos to Jean on his top flight handling of the bulk of Maugeri's piece
Hamilton has a series for North Dakota + Montana, as is the case with many other states. Even in tandem they wouldn't spice up my graph much; local peaks in 1969 and 1984 at 201 and 226 kb/d respectively; at 379 kb/d in 2010 they'd barely be working their way out of the basement. I was trying to illustrate the behavior of the major producers, whose ranks ND is only now joining.
I can upload the data if you want to play around with these numbers. Hamilton really did halcyon work here.
Was mistaken about LA, forgot that I have a separate series on there for the Fed GOM.
Thanks for the data offer but I'm happy to let others handle the spreadsheet work.
I understood that in 2010 ND/MT would have been creeping along with the bunch at the bottom of the chart but as of June 2012 their combined total was about 726 kb/d. Of course MT is down to about 60% of its 2006 peak and falling and now produces less than 10% of ND total so it could probably just be left out. Just thought it might be interesting to see the trajectory of that upward curve as it passed by the down slopes of Alaska and California, and to see Texas closing back in on the 2mb/d mark (1.9mb/d in June 2012) for the first time since it and Alaska were in a dead heat when AK peaked there back in 1988.
Well that may have underscored Jean's points or just pointed up problems in the 'beta' I was looking at. In the 'couldn't sleep wee hours' I pulled up an EIA's state by state oil production rank chart and it had Texas at 57 million barrels for June 2012 which came to the 1.9 mb/d average I gave above.
I just pulled up the RRC numbers
JUNE CRUDE OIL PRODUCTION Texas preliminary June 2012 crude oil production averaged 1,285,561 barrels daily, up from the 968,328 barrels daily average of June 2011.The preliminary Texas crude oil production figure for June 2012 is 38,566,821 barrels, up from 29,049,829 barrels reported during June 2011.
(my emphasis)
The 57 mb/d Texas number I got came from here
http://www.eia.gov/beta/state/rankings/?sid=TX#/series/46
Anyone have a clue as to where EIA gets that 57 mb/d Texas June 2012 crude oil production number? Does it include offshore oil that is somehow out of the purview of the RCC? Big difference between 38.5 million and 57 million barrels. 57 million barrels for June 2012 shows up on the EIA Texas field production chart as well.
It turns out that the RRC does not include condensate in their crude oil production numbers. Also, they don't report production numbers for leases, for which they have data, but that have not yet been assigned RRC numbers. When you include condensate production and new leases, the discrepancy between the two data bases narrows quite a bit (the EIA uses a sampling approach to estimate production).
In any case, Texas has clearly shown a significant increase in crude oil production, to a level well below our 1972 peak; however, there is an absolutely crucial difference between the runup to the 1972 Texas peak and the recent significant rebound in Texas crude oil production.
A major contributor to the 1972 Texas peak was an increase in production from old fields like the East Texas Field, as it hit its final (secondary) peak in 1972, and started a terminal decline in 1973. However, note that the updip wells, on the east side of the East Texas Field, in most cases were capable of making virtually the same amount of oil in 1972 that they produced in 1932 (in any case, the eastern wells above the Oil/Water contact would easily make their allowable in 1972).
In contrast, my guess is that at least 90% of the shale oil wells currently producing will be down to 10 bpd or less, or will be plugged and abandoned, 10 years from now.
Also, Texas has the longest recent history of intensive modern drilling and completion efforts in Shale Gas plays, and for example it resulted in a steady year over year increase in annual Barnett Shale gas production, through 2011. However, overall Texas natural gas well production started declining in 2009, as rising gas production from the Barnett and from other shale gas plays could no longer offset the overall decline in Texas natural gas well production (Texas RCC data for Barnett and overall natural gas well production).
The very interesting question is once the shale gas players have materially slowed their drilling--which they have now done--will the industry ever again be able to fully offset the overall underlying decline, given the very high decline rates from shale gas plays? In other words, as Art Berman has noted, I don't think that the industry has ever had such a high overall decline rate.
As noted above, the 2008 to 2011 Texas natural gas well decline, with a higher drilling rate than we are presently seeing, is not encouraging for either the longer term US Shale Gas outlook or for the Shale Oil outlook.
Thanks westexas and ROCKMAN
With in the neighborhood of half trillion (give or take a hundred billion or so) cubic feet of monthly natural gas production the Texas condensate number certainly must be significant.
It will be interesting to see how tight oil production holds up over time. As I understand it water contact is not an issue in shale plays (please correct me if I'm mistaken) but I do wonder how slow an oil drip can be pulled out of those long horizontal runs.
Rune modeled what sort of drilling effort would be required to maintain a production plateau in the Marcellus and postulated how the Bakken effort would have to be somewhat greater over time to maintain such plateau in this reply in his own 'Red Queen' key post threads
Yellow dots using scale on left show how many new wells have been/would be needed monthly to reach/maintain a gas production plateau through 2020. Dark colored portion of chart shows actual production from actual monthly drilling effort--yellow dots connected by irregular black line. Faded portion (future production) projected from more evenly stair-stepped groups of yellow dots (future monthly drilling effort) beginning in mid 2012
Do you know much of Montana's current production is tight oil? That state's production last peaked in 2006 a bit north of 100 kb/d and is now slipping quickly toward (or possible past by now) the 60 kb/d mark if I recall correctly.
Luke – For about the first 10 miles from the shoreline in the GOM those minerals belong to the state of Texas. The TRRC accounts for production out there no different than onshore wells…same regs and reporting rules. The EIA numbers for Texas don’t include federal offshore production. You can tell because in their data base they show June Texas at 59 million bo and June Federal at 39 million bo. Both are shown in PADD 3 compilation.
It been discussed theorized before that condensate production may be part of the reason for the variance: The EIA includes it but Texas doesn’t. But I think westexas found that the TRRC oil production number includes condensate.
"OPEC took note of this fact and were more confident when unsheathing the Oil Weapon for the 2nd time, I'd reckon."
What oil weapon ? Prices went up, which was good both for OPEC and for oil majors (especially to develop Alaka, GOM, North Sea) but the embargo is mostly a myth (numbers of barrels taken out of the market ridiculous).
Plus prices went up also due to dropping of Bretton Woods and ensuing dollar devaluation.
The first oil shock was 100% about the US 1971 production peak, maybe time to realize ...
Y - The "oil weapon" was also a useful tool for seperating fools from their money even for the small independent companies. I've mentioned one promoter in the Gulf Coast that sucked investors into a joint venture using the "embargo" hype. They drilled 18 wells all of which were dry holes. And the senior guys with the promoter retired millionaires. Saw dozen of similar (but not as ridiculous) examples. I saw folks send checks into post office boxes to invest in wells advertised in the back of the Wall Street Journal and the Oil&Gas Journal and then complain about their "mail box " money not showing up. Another one of my compaies swallowed the hype and spent $550 million to find $60 worth of hydrocarbons. A public company with no oil patch experience that thought all they had to do was drill anywhere and make a profit. I've said it before: the "embargo" hype and high oil prices resulted in more damage to the oil patch then I've seen as a result of low price periods. Consider the 2008 shale hype of skyrocketing NG prices. Put dozens of companies out of business and came close to destroying two of our largest independents: Devon and Chesspeake. Again the old oil patch saying on how to make money in a hyped up boom: roll into town with the first wagon load of whores and roll out before the first wagon load of production equipment hits the ground. Petrohawk provided a good example of that recently by selling out their Eagle Ford acreage for $12 billion.
R - Thanks for the info, and again I'm not saying that the "embargo" (or let's say the "declaration of an embargo") hadn't any effect on the barrel price, in fact Maugeri book is quite interesting for the historical aspects, he mentions for instance that when Yom Kippur war broke out, OPEC canceled a meeting which aimed at discussing higher prices with oil companies, and the "embargo" declared a few days after, but the embargo never truly effective in terms of number of barrels :
And even more so if you add to that that the Saudis were cheating the "embargo" towards the US thoughout its duration, as Akins clearly explains in this documentary "la face cachée du pétrole".
And the problem with that is really this "political event" image that the first oil shock has, when it was really the first "peak oil" event, and a major one.
(was a kid at the time, but remember it quite well, especially from TV news and messages on "energy savings", and also some discussions between an aunt who was working as an economist around oil/energy for a government agency and my father (not in oil at all but in minerals transformation industry) about whether it was an "economical issue" or a "geophysical one" ...)
I can mention that Maugeri's analysis is now been taught / referenced at universities as near gossip truth - US election only a month away....
Of course! It gives credence to the never ending promotion of economic growth as a solution to all our problems.
Either these people are scientifically and mathematically ignorant fools or they are liars. Both Romney and Obama are touting strong economic growth... yeah right! >:-(
"gossip truth"; I like that. Makes a change from just swearing on the bible. ;)
I was referring a colleague to this site recently concerning high decline rates in the Bakken. He has a business up there related to the "boom". This was his comment and IM WONDERING WHAT OTHERS HERE think about his premise on TOD only having "half the story".
http://en.wikipedia.org/wiki/Psychological_projection
If I may slightly rephrase your colleague's comments, in my opinion the following might more accurately reflect his feelings on the issue:
Incidentally, I suppose it's news to yours truly, the "Rock" and Art Berman--shale realists all--with a 100 years plus of collective experience in the Oil Patch, that we want to "outlaw hydraulic fracturing."
In any case, rising production from the Bakken in 2012 has been sufficient to offset the decline from Alaska over the same time frame, and it has of course contributed to what will be an increase in annual US crude oil production from 2011 to 2012.
However, my guesstimate is that at least 90% of the shale oil wells currently producing will be down to 10 bpd or less, or will be plugged and abandoned, 10 years from now.
Also, Texas has the longest recent history of intensive modern drilling and completion efforts in Shale Gas plays, and for example it resulted in a steady year over year increase in annual Barnett Shale gas production, through 2011.
However, overall Texas natural gas well production started declining in 2009, as rising gas production from the Barnett and from other shale gas plays could no longer offset declines elsewhere in Texas natural gas well production (Texas RCC data for Barnett and overall natural gas well production).
The very interesting question is once the shale gas players have materially slowed their drilling--which they have now done--will the industry ever again be able to fully offset the overall underlying decline, given the very high decline rates from shale gas plays? In other words, as Art Berman has noted, I don't think that the industry has ever had such a high overall decline rate.
As noted above, the 2008 to 2011 Texas natural gas well decline, with a higher natural gas well drilling rate than we are presently seeing, is not encouraging for either the longer term US Shale Gas outlook or for the Shale Oil outlook, especially since the permeability relative to gas is higher than the permeability relative to oil.
From Rune's latest piece on the Bakken
SCOPE OF THE STUDY
The scope of the study incorporated companies/areas that had a specific average production (Bbls/day/well) above the average for the Bakken formation, see also figure 06. Further the study concentrated on newer wells where there were reported starts of production as from January 2010 and later. This was also to make sure that effects from those newer wells with “state of the art” technologies (technological innovations/improvements like horizontal wells also with laterals, multistaged hydraulic fracking, to name a few) were incorporated. This was done to document recent trends. Normally it takes somewhere between 5 to 6 months from start of drilling of a well until it starts flowing. Then add time for planning and approvals.
Now I'm guessing as Hess and Continental are the largest operators their wells will be producing at the average their effort is creating. Rune focussed on companies with wells producing above the average. I'm sure Rune could elaborate if he is looking in.
How focussing on the higher than average producers skews the data would be good to know and I believe a couple years down the road Rune will have enough data to show that as well. Rune lives in Norway so you might understand his interest in Brigham now that Statoil owns it.
To suggest TOD has political purposes that align with an EPA friendly agenda is way more than laughable, but a person would have to read more than one or two isolated posts here to realize that.
In my article I used data for companies/areas that have had a specific production (Bbls/day/well) above average for Bakken.
Given time I will look at Hess and/or Continental. I just completed a similar analysis for Slawson Exploration and it came up with a similar picture as I presented in my article.
Another thing I did not touch upon in my article, what capacity do the companies have to tie up capital literally in the ground before they have to start repairing their balance sheets?
For the period January 2009 - August 2012 the net cash flow for all Bakken was an estimated total (negative) $12 - $14 Billion, in other words these are money the companies have diverted from other sectors and/or borrowed.
Question is at what point will the companies start adjusting investments in line with net cash flow (i.e. without outside funding)?
Rune
"Figure 27: World remaining reserves from political/financial and technical sources"
What is the reason for excluding extra-heavy oil from the technical "proven + probable" reserves?
I assume this refers to the Canadian and Venezuelan tar sands and if included would push the 2P reserves figure to around 1200 Gb.
This is an answer from Jean Laherrère: