DrumBeat: October 6, 2006
Posted by threadbot on October 6, 2006 - 9:52am
Official: China starts filling strategic oil reserve
BEIJING China has started filling the tanks of a strategic oil reserve meant to insulate the country from disruptions in supplies, an official said Friday.The tanks in Zhenhai, a city in the coastal province of Zhejiang, south of Shanghai, are being filled with domestically produced oil, said Xu Dingming, deputy director of the Cabinet's State Energy Office.
Oil falls under $60, investors doubt OPEC
Oil fell below $60 on Friday as investors doubted OPEC's resolve to carry out supply cuts and focused instead on brimming fuel stockpiles in top consumer the United States.
Oil Market Underestimated Supply Limits, Barclays Capital Says
Crude-oil traders who sold the commodity below $60 a barrel underestimated potential supply constraints from OPEC and producers like Iran and Nigeria, a Barclays Capital research analyst said.
OPEC's $60 sweet spot: Why OPEC's production cut may not be bad for consumers
If OPEC follows through on the talk that it will cut oil production by a million barrels a day, it will send a clear signal that the cartel feels the world can handle $60 oil.But it could also undermine prices in the long run, by encouraging investments in conservation and alternative energy sources as well as by reducing some of the so-called security premium.
U.S. says world doesn't need OPEC oil cut
With hefty winter demand for heating fuels just around the corner, the world still needs all the crude oil that OPEC can pump and the cartel should not overreact to lower oil prices by cutting production, U.S. Energy Secretary Sam Bodman said on Thursday.
Shell Among Companies Preparing Oil Sand Reserve Cases for SEC
Royal Dutch Shell PLC is one of several oil companies preparing a case to convince the U.S. Securities and Exchange Commission to allow it to book reserves from Canadian oil sands.Although a significant portion of Canada's oil sands are bookable under SEC guidelines, much are not. If granted, SEC approval could open the door to radical reserve revisions for many companies.
Gas prices may be at bottom: Many drivers who are hoping for sub-$2 a gallon gasoline in the near future will likely be disappointed.
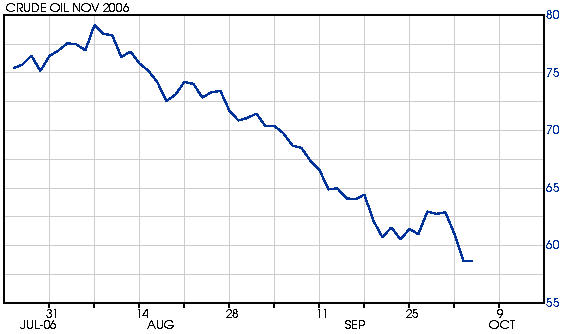
The oil bears must be in their glory.November '06 crude prices have plunged some 28.4% since mid-July trading all the way down to $57.76/barrel yesterday.
Today's USA Today Snapshot (with poll!): Who are the world's biggest oil consumers?
US, China, India flex muscle over energy-critical sea lanes
The United States, China and India are moving to assert control over the sea lanes through which they receive critical energy supplies amid fears in Beijing of a US blockade of the Malacca Strait in the event of a crisis over Taiwan, experts said.The United States at present has vast control over the major so-called "choke points" on the world's sea lanes, said experts at a recent forum in Washington.
Almost all of China's energy imports are obtained through sea and it is worried the United States could hold its oil supply hostage.
Power pool puts plans in place to avert Southern African energy crisis
Bangladesh: Violence against power outage
People angered by power outage blocked traffic in two important areas of the city, namely, Tejgaon Industrial Area and Jatrabari. They blocked Dhaka-Chittagong Highway near Jatrabari creating a gridlock of hundreds of vehicles. People surrounding the industrial area came out on the streets with sticks. Protesters even broke a number of private and public vehicles near the FDC gate and Shatrasta intersection.
Canada in Quandary Over Gas Emissions: Push for New Policy Puts Oil-Rich West At Odds With Big Automakers in East.
Nigeria troops look for missing soldiers
PORT HARCOURT, Nigeria - Troops launched a search-and-rescue mission Thursday for Nigerian soldiers missing after militants ambushed a military-escorted supply convoy in the oil-rich south, and the president called an emergency meeting with security chiefs.
Biofuels 'will not lead to hunger'
British farmers can meet the nation's demand for both food and fuel crops, argues Peter Kendall, president of the National Farmers' Union. In this week's Green Room, he says UK agriculture already has enough capacity to fill fuel tanks and dining tables.
Norway Details US$3 Billion Renewable Energy Plan
Norway's government detailed subsidy plans for renewable energy and power savings projects on Thursday under a 20 billion crown (US$3.02 billion) fund promoting clean energy to meet a looming electricity shortage.
In Russian Far East, concern for environment
Syria grants Shell oil rights, seeks higher output
Syria has awarded Royal Dutch Shell oil and gas exploration rights in two blocs as part of efforts to reverse a decline in production that could squeeze the government financially.
Geothermal Resources Could Meet California's Power Needs But New Approach Needed
Technology Can Solve Energy Supply And Security Problems
America's energy future is choice, not fate, and U.S. dependence on oil can be eliminated with proven technologies that create wealth and strengthen security. That's the message Nathan Glasgow of the Rocky Mountain Institute (RMI) will bring to New Jersey Institute of Technology (NJIT) in his presentation on Oct. 25, 2006, at NJIT's Technology and Society Forum. Admission is free and the public is invited.
Contact
- Content: editors at theoildrum dot com
- Tech support: support at theoildrum dot com
License

This work is licensed under a Creative Commons Attribution-Share Alike 3.0 United States License.
I thought this article was great. It is in the Washington Post, so you may or may not have to register, but it is free.
http://p088.ezboard.com/fdownstreamventurespetroleummarkets.showMessage?topicID=18375.topic
I then posted a couple on The Goldman/Sachs thing.
Don't look behind the curtain, listen to the Wizard.
I Posted those Goldman things here a few days ago.
SPIN SPIN SPIN...
John
I never thought to give you credit - sorry. Way back I used to post to that forum until you had to register and I was tired of registering for stuff. But I still look at it every day.
Todd
It's doesnt matter how many dems or reps there are in Goldman Sachs b/c they all want to make money. I see this more as a way for the sell/buy side to make some money since they know what they're going to do. They've got positions everywhere too. It's not like these people don't talk. There's a reason that Goldman is the largest iBank ranked by Hedge Fund Assets. They are leveraging themselves as well and it's work fantastically. It can't last indefinatly.
I won't know until the 7 weeks after the election. I think we'll all be able to perceive this a bit clearer.
http://www.financialsense.com/fsn/BP/2006/0513.html
I'm not an economist though, so I'd be very interested in hearing anyone else's expert opinion on this . . .
Someone pointed out that the essence of fascism is service to the state--statist/corporatist. Now keeping that thought in mind, revisit this JFK quote: "Ask not what your contry can do for you; ask what you can do for your country." Now relate that to this, "We the People of the United States, in Order to form a more perfect Union, establish Justice, insure domestic Tranquility, provide for the common defense, promote the general Welfare, and secure the Blessings of Liberty to ourselves and our Posterity, do ordain and establish this Constitution for the United States of America." Sounds to me that we established the state to serve us, not the other way around.
"Nation" refers to a group of people linked culturally
"State" refers to a political entity with boundaries and a government
"Country" is a term for our present top-level diplomatic understanding of the state - emphasis on being recognised by international consensus
Kurdistan is a nation. Iraq, Turkey, and Iran are a state. Poland has always been a nation - and it was made a state as well after WW2. Hezbullah is a somewhere in between a nation and a state, but it is not a country. Sealand was a state without any aspect of a nation or country whatsoever.
As you can see, geographers, political scientists, historians, etc., use the two terms interchangably. And while the US isn't a unitary state (http://en.wikipedia.org/wiki/Unitary_state), it has many trappings of a unitary state, especially regarding concentration of power and its ability to create an empire and operate lawlessly. It also helps to remember the context of the JFK quote, which was and still is hailed bipartisanly as inspired, as part of the Democrats' escalation of the anti-communist crusade.
If ultimate sovereignty rests with the people, as it does in theory in the USA, then the state exists to serve us as it exists at our pleasure. If we are to serve the state, then ultimate sovereignty rests elsewhere, we exist at the pleasure of the state, which means we no longer have a republic. This is an old argument that precedes 1776, and one that is as yet unsettled as current events prove.
Keep wishing on that star ;)
http://news.bbc.co.uk/2/hi/americas/5413676.stm
And later in the same article:
"Residents staying at home were urged to close all windows, turn off their air conditioning units and look out for symptoms of chemical poisoning."
I guess looking for symptoms of chemical poisoning passes for "nothing alarming" these days.
A large-scale biorefinery would be one of the first to use stalks and cobs.
Cellulose-based ethanol, yet another reason peak oil is a non-event.
http://www.radioiowa.com/gestalt/go.cfm?objectid=0EF33C00-36D8-4F70-8E01BBEB74C00E01&dbtranslato r=local.cfm
Surely stubble and cobs eventually revert to the soil? Or at least aerate the soil.
If only you give me more money, I will solve all your problems.
50 years from now.
It still doesn't work though, does it? It's 'developmet', not production. They're clever in their PR, got to give them that.
"wood wastes" ? Are you talking about what is left over from de-barking and de-limbing operations in the forests?
????
To answer your question: Not long. Of course, the vast majority of the world's agricultural land is already in an advanced state of depletion. I'm trying to remove 135 acres from that class of land, but it takes time and isn't as profitable as conventional soil mining.
I and others have posted about Terra Preta soils on TOD; do a search. I posted a lot of links. In essence, they are soils in the Amazon that are high in carbon because charcoal was added either on purpose or incidentially.
FWIW, I started tests in our own garden two years ago. They aren't scientific since I'm not doing replicated plots but results to date are impressive.
Todd
You are correct about the inputs and the carbon , hydrogen and oxygen echange on farm land. The stated goal of biorefineries (including biomass to ethanol) is to capture the C,H, & O and leave the rest.
The state of Iowa is clearly headed in this direction. The BECON Energy Center is a bricks and mortar facility working the bugs out of these processes. This is run by ISU and funded by a state surcharge on electricity. I think 7 cents for every $1000 dollars of electricy sales goes to BECON to staff and run the facility. I have toured this facility and talked to the Ag engineers and chemists that run it.
Iowa currently exports a lot of its topsoil every year in the form of grain. The mineral nutrition is removed from the soil by the plants and stored in the grain which is shipped all over the world. The goal of biorefineries is to process the grain on site. Capture the N,C,H & O as liquid and dry feedstocks for industry using a number of processes. The ultimate waste products of this are inorganic slag made up of Ca, K, Phosphorous, metals and micro-nutrients, which are put back on the fields.
The N,C, H and O all are recycled out of the atmosphere via gasses and rain. A lot of nitrogen compounds such as NH4 are pulled out early in the processing and are feedstock for N fertilizers. The hydrocarbon chains are used for or result from ethanol, biodiesel, and polymer feedstock processes.
The stated goal of the researchers at BECON is to have the sun power the conversion of N,C, H & O into usable forms. There is ultimately no net gain or loss of N,C, H or O just cycling into and out of the atmosphere through plants in the process. Not all the plant capture is removed from the soil since the plant root mass stays. Putting the fertilizer slag and some nitrogen compounds back maintains the soil fertility and jump starts fertility. Nitrogen fixing bacteria can supply a lot of the needed N if the soil is healthy. This is the goal, not yet a reality, and there is clearly a well thought out pathway that is net energy postive.
The green plants themselves are hugely net postive while they grow, converting light energy to chemical energy. What we need to do is uses some of that stored potential chemical energy to do work before releasing the gases back into the atmosphere to be recycled. Will this provide an unlimited energy supply, No. Will it solve all our energy problems, No. Can it supply a significant energy output while simultaneously reducing fossil inputs to farming, Yes.
Experts see worldwide obesity pandemic
'As big a threat as global warming and bird flu,' conference is told By Rohan Sullivan
- no one is suggesting (nor is there the need) to replace all petroleum usage with that of biofuels
- 3rd world agro economies have been decimated by 1st world protectionist trade policies
- 1st world export surplus used for biofuel would exceed government biofuel quotas
- 1st world export surplus used for biofuels would raise the global price of crops and provide 2 markets (food/fuel) for farmers
- raised crop prices and dual markets would enable 3rd world agro economies the opportunity to be profitable
The above notwithstanding, you also fail to take into account best practices, conservation and 2nd/3rd gen biofuel production paths among other variables.
Again... Food Vs. Fuel is a myth.
How do you seperate industrial users of silver from those who want it for it's perceioved value? Where is the article you pulled this from?
Not to belittle the threat that GW presents us by any means; I submit that local climates aren't exactly flipping upside down. And the productivity trend you mention has been consistently up long-term. Case in point: 2006 is set to be a banner year for US corn and Brazilian cane production respectively.
What other crops are there grow in volume for which we can compare YoY and really get at this. Soybeans? Where would I find info? Last I recalled most of the midwest (soybean country) was in a drought. That was a few weeks ago so things may have changed. An article specifically mentioned the state I'm stuck in, Missouri - rather Misery as we like to say.
MO is looking at $1 Billion in crop damage via drought. This would be the largest ever loss of crops. Here in STL, GW matters since we no longer seem capable of producing snow during the winter. Our local climate is changing and it's not for the better.
As far as this years crop goes, it is a bit late to worry about drought. If the soy doesn't have a chance to dry in the field...it can be harvested wet, then natural gas will be used to dry it.
"no one is suggesting (nor is there the need) to replace all petroleum usage with that of biofuels"
If you mean there will always be petroleum, you aren't thinking long enough term. If you mean that we'll have to settle for less energy, I agree, but the public is led to believe that biofuels will seamlessly replace petroleum, so the pressure to reduce consumption is miniscule, while the pressure to continue business as usual is enourmous. If this pressure exists as biofuel production scales up there will absolutely be a food vs. fuel situation. A gallon of gasoline has over 30000 calories. A car can burn that in 30 minutes. You cannot compete against a voracious appetite like that.
Your comments about prices and markets are completely irrelevant unless you can prove that biofuels can replace petroleum consumption. If there isn't enough food to go around, the price doesn't matter. Furthermore, there will be far less total wealth to go around as energy becomes more scarce.
"The above notwithstanding, you also fail to take into account best practices, conservation and 2nd/3rd gen biofuel production paths among other variables."
I'm still waiting for some real numbers on these other biofuel production methods. Numbers where all of the energy inputs have been counted. I mean all of them. If a recombinant cellulase is used, I want the growth media that grew the recombinant bacteria that produced the enzyme counted. A completely closed system experiment would be interesting. Until somebody has the guts to actually do the experiment this sounds like another false promise.
http://www.onlineconversion.com/energy.htm
I use nutritional calories for biofuel because it gives a sense of scale that most people can relate to.
maintain its health when the stover is no longer
returned to the soil. If man breaks the cycle of
vegetation being returned to the soil you will
soon have nothing left but sand.Iowa will probably
begin to look like Libya in short order.
I have never heard the biofuel gang address this
issue satisfactorily.
For the previous post concerning wood...
Wood waste is a combination of residual by-products from the timber and pulp & paper industries. Forest residue is also in this category - typically culls from fire prevention or beetle infested areas (a BIG problem for boreal forests).
Wood waste makes up a significant portion of the DOE's Billion Ton Vision and it's the bulk of Canadian biomass available for bioenergy production.
The US housing collapse is going to free up a significant amount of this feedstock and labor through plant closures and lost jobs.
There will never be a better time for Forestry on both sides of the border to make the transition to biofuel production.
I am turning your comments around though, and stating that anyone who thinks that "Iowa will look like Libya in short order", should provide their own research to prove it.
Which is what is happening today. We don't return food waste (trash, sewage) to the fields. The fields must deplete. We balance it by adding chemicals. But that cannot be sustained without oil.
So any biofuel based technology must include a transfer of wastes back to the fields. And in the future, food production must also implement the same cycle.
Because elites have always needed to provide "cheap bread" to the masses in order to maintain position and privilege, most farmland will continue to be dedicated to the provision of affordabe food. The Reign of Terror in the course of the French Revolution speaks to the fate of elites who fail to meet this requirement. But I believe it is reasonable to assume that some land, especially marginal farmland, will be available for biofuel production.
There is at present a fixation with alternative sources of liquid fuel. There is at the same time, a numbingly naive expectation that current space heating fuel is limitless.
I believe that the evidence supports the conclusion that it is only a matter of short time before North American natural gas production enters the same downward spiral as UK gas production. Effort per unit of gas recovered is a primary indicator of this inevitability. LNG from the Barents Sea, if it ever happens, or from any source is not going to keep prices below levels that make solid fuel from crops such as switchgrass a viable alternative to natural gas heating.
Once the supply of natural gas is constrained and price moves over a certain threshold, demand for bioheat will rise. Farmland owners will then face buyers from the ethanol industry and new buyers from the solid fuel industry. They will sell the 'use' of their land to the industry which pays the higher price.
In this light, the EROEI of the relative technologies, one providing a transport fuel and the other a way to keep blood and pipes from freezing in the winter for tens of millions of people and households, businesses and factories, becomes the key factor. It will be a question of how much the buyers representing either transport or heating have in spending money. This will reflect the btu's ultimately available for sale to the end consumer and the price per btu consumers are willing to pay for solid vs liquid fuel.
On this latter point, one can note that the crop producing areas nearly all promise sure death to people who can't find heated space in winter.
Switchgrass pellets for space heating has in the analysis of REAP-Canada is an energy conversion process with an EROEI of more than 20 - 1.
Perhaps further analysis will reduce the claimed energy return, but I note these comments from Pimental:
"BIOHEAT offers the best energy and greenhouse gas balances of the available options and is the most efficient way to produce energy from farmland," says David Pimentel, a keynote speaker at the Guelph Organic Agriculture Conference being held this weekend."
http://www.reap-canada.blogspot.com/ Scroll down to Jan 27/06
What in comparison is the EROEI of the subsidized corn based ethanol industry? Perhaps Keithster knows the potential EROEI of the potential cellulose-based ethanol industry.
I don't think ethanol will survive the shakeout. I do fear that bio-diesel will have tragic environmental consequences for tropical areas, but that is another story.
Keithster states:
"yet another reason peak oil is a non-event"
It is apparent that Keithster has no idea of the real import of peak oil, which is a radical diminishment of the spread between the entropy of resource inputs and economic output. For persons not grasping this point, I recommend reading Georgescu-Roegen's "The Entropy Law and the Economic Process". G-R was in the words of Paul A. Samuelson, "a scholar's scholar, an economist's economist". Among other accomplishments, G-R ably deconstructs the delusion that technological advance can permit 'entropy bootlegging'. This analysis is key to enabling us to make the best decisions regarding our energy future.
The book is hard to find, but perhaps if enough people start making requests, Harvard University Press, will make another printing.
It is not a primary energy-source. Rather it is an energy-carrier. Because the entire process does not return energy (see Pimentel and Patzek (Natural Resources Research, Vol. 14, No. 1, March 2005) alcohol production must rely on primary energies (including natural gas fertilizers, coal-generated electricity for fermentation, etc) that would be best used in original form. Why loose output to conversion inefficiency.
A second problem there is not waste. in agricultural. Carbon, especially cellulose, must returned to the ground soil for without it soil becomes dirt.
There is virtually no waste in timber or papermaking operations. Chips are used to plywood and oriented strandboard, sawdust goes into paper, and bark is used for compost. The little amount of slash left in the woods is chipped or burned on the spot to return a little something to the forest floor.
This leads to a comment identifying a problem with your analysis.
How is it that "natural gas fertilizers, coal-generated electricity for fermentation, etc" are primary energies but cellulose alcohol is an energy carrier? Electricity is a way to carry the energy that was released by burning coal, in your example. The coal carried the solar energy that nature compressed into its rock-like form and 'contained', in a manner of speaking, the energy consumed to mine, transport and burn it productively.
Like coal, natural gas or oil, cellulose is also converted solar energy.
After a comment of yours some days ago, I made a mental note about your confusion about the second law of thermodynamics and agricultural production. I have the impression that you don't appreciate that the second law applies to closed systems and not an open system like agricultural, which daily receives energy from a source external to the bio-sphere. A gift from Ra. Of course you could choose to define the system to include Ra, but then you must recognize the scale of time involved in the wait for heat death.
Take a look at "The Refrigerator and the Universe--Understanding the Laws of Energy" by Martin Goldstein and Inge F. Goldstein, Harvard University Press, 1993.
When we integrate the area under a production rate versus time graph, we get the URR for the region. The primary purpose of the HL method is to estimate the URR, or what Deffeyes calls Qt.
Khebab and I (my idea, Khebab did all the work) looked the post-1970 Lower 48 cumulative production and the post-1984 cumulative Russian production using the HL method. These years corresponded to the two regions respective 50% of Qt marks.
The Lower 48 had the classic bell shaped decline curve. Russia has a very complex production history, because of the collapse of the Soviet Union.
Using only production data through 1970 for the Lower 48 and through 1984 for Russia, Khebab predicted post-1970 Lower 48 and post-1984 cumulative Russian production. Actual (post-1970 and post-1984) cumulative production for the two regions, through 2005, was about 100% of what the HL models predicted it would be.
Kenneth Deffeyes estimates that the world hit the 50% of Qt (crude + condensate) mark in December, 2005. He estimates that as of December we had about 1,000 Gb of conventional crude + condensate left.
Since the primary purpose of the HL method is to estimate the area under the curve, and not the production rate, it occurred to me that a better way to evaluate Deffeyes' prediction is in terms of the cumulative increase or the cumulative decrease in production, relative to December.
For example, the average cumulative production for the first seven months of 2004 was about 5 million barrels less than if we had simply maintained the December, 2003 production level.
The average cumulative production for the first seven months of 2006 was about 142 million barrels (subject to revision) less than if we had simply maintained the December, 2005 production level.
At 74 mbpd (the 12/05 level), we would use half of our remaining conventional crude + condensate reserves in 18.5 years. This suggests that the production rate has to fall. Note the 142 million barrel cumulative shortfall relative to December.
Using an estimated net daily increase of about 220,000 people per day, we may have on the order of 46 million more people worldwide than in December, with a cumulative shortfall of about 142 million barrels less oil than if we had simply maintained the December production level. In other words, more people and less oil.
An observation that few people, if any, have noticed. Crude oil is still below the December peak and the average production for 2006 is still below the average production for 2005, for both crude and all liquids. Yet the price is falling. This tells me that the world is demanding less oil. That is, people are simply using less oil due to high prices, driving the price down.
So I would make another modest proposal, that we concentrate on production and not price. Of course I would agree that we look at cumulative production as well.
My idea is to simply take the post-12/05 average crude + condensate production, times the number of days, and compare that to the 12/05 production number times the same number of days.
More people and more oil is worse.
Houston,we have a problem!
peace
What views can we take of this and, in particular, of the drop-off in Saudi production in the last 2 months? In no particular order, here are some observations to guide the discussion.
- is having production problems
- is managing their resources for the long term
- has made some premature "voluntary" production cuts anticipating lower demand
In the case of #1 or #2, you can kiss your lifestyle goodbye. In the case of #3, the question is Why? The only possible answer is lower demand. It was not reported much, but the EIA revised U.S. demand down for July. On the other hand, China's demand has remained very strong. There is still no good explanation for these cuts.Meanwhile, the current low prices are temporary. When the seasonal adjustment kicks in near the year's end -- and combined with actual OPEC production cuts should these actually occur -- the price of oil could go sky high in 2007.
Statements from the Saudi's have been muted or non-existent. Their lips are not moving. This image has been long overdue.
Esteemed & Beloved
But that's all I'll say for now.
I would also point out that refineries have been doing the same thing. I saw no discussion from this week's EIA report about refinery utilization being down. What's happening there is that refiners are seeing their margins slip (and inventories rise), and so they are cutting back on refinery utilization. They may have been postponing maintenance while margins were good, and now they have decided that this is the time to do it.
One other thing I wanted to mention. I saw the question a few days ago, but the discussion was already stale so I didn't answer it. Someone asked why Europe would still be shipping gasoline to the U.S. in light of the very high inventories. I think the implication was that someone is trying to flood the market and crash the price. However, those ships don't show up here overnight. They started that trip when margins were still very fat. European refiners are watching the prices crash now, and I guarantee you they won't be so quick to send ships until margins recover. I predict that you will see finished product imports start to decline rapidly in the near future.
Yes, but the central question is, why did oil prices go up by close to 30% from 12/05 to 7/06?
IMO, there are 142 million reasons--the cumulative difference between what we would have produced if we had simply maintained the 12/05 EIA crude + condensate production rate and actual cumulative production.
Which leads to another question. Why the shortfall?
IMO, just like the Lower 48 (in 1970), Russia (in 1984) and the North Sea (in 1999), worldwide we have consumed half of our conventional crude + condensate reserves. As I noted up the thread, the cumulative post-50% Lower 48 and Russian production was basically exactly what the HL models predicted, and the North Sea has peaked, and is rapidly declining, exactly as predicted by the HL model.
For a number of reasons, which I have mentioned before. Reasons that don't necessarily have anything to do with a peak in oil production: Hurricane Katrina knocked some gulf production offline; the situation in Nigeria flared up and took a lot of production offline (this happened in January or February); the situation in Iran started to worry people; a lot of speculators exacerbated this situation by jumping into the market. This also explains to a large extent why prices have been falling recently: Gulf production is all back online, the rhetoric between us and Iran has started to cool, and the speculators started bailing out when the worst case did not materialize. The only piece that is not significantly better is the Nigerian piece.
You know, your hypothesis might ultimately prove to be correct, but I see pieces of data that don't fit. You have to consider why they don't fit, and whether in fact there are other reasonable explanations for the behavior we have seen in the market.
Here are a few I can think up that would signal the peak is pushing out in time:
Lots of oil is discovered. Deffeyes shows that there is another 100 Gb of oil yet to find. If we start getting reports of far more oil than this being found (like 200 or 300 Gb) then we know the analysis will have to be revisited.
A large mature region has a surge in production. If a new technology comes along and causes the HL line to suddenly bend right (towards greater URR) of a mature field (like say Texas) then we know the analysis needs revision.
Here is one that would signal a worse case:
Region decline curve is not symmetrical. Instead, the decline drops like a stone. The HL model assumes that production is bell shaped. If some regions begin to fall faster than the bell, then we could have over estimated the world URR.
Short term price moves cannot determine the truth or falsehood of the PO hypothesis.
Your point about Systems Dynamics is utterly germane, about overshooting and undershooting, leading to big price volatility.
We don't know if the price spike was PO, or rather simply underinvestment in 1998 (eg those pipelines BP has in Alaska) which has cut production now.
My guess it was financial speculation on the back of political worries re Iran and Iraq.
Why are you using the past tense?
I believe there have been times when the price of crude did not truly reflect geologic reality, but I bet there will be times in the future when it does. Have we hit that point yet?
"Why are you using the past tense? "
Well, consider that when the U.S. peaked 1970 the government did not admit it until 1979, nine year later, and even then, fudged by saying that, yes, the U.S. "seems to have peaked on crude oil production." (!!)
The world peak, if it "was" yesterday, or yesteryear, would even be easier to hide, by shifting numbers about, fuel switching, working out of seasonal inventory swings, etc. Thus, it cannot be considered out of the realm of possibility that conventional crude oil/condensate production peaked in 2001 or so, and we just don't know it yet...interestingly, if one looks at a chart I used in my other post, chart extracted from Wekipedia...
http://en.wikipedia.org/wiki/Image:Oil_Prices_1861_2006.jpg
You get that great "bottom out" in 1970 on price before U.S. peak, and then things go stupid....now look at the "bottom out" in 1998, and then, things go stupid!
Would it not be the ulitmate horrible irony that the "twin shots heard round the world" of the falling World Trade Center Towers were the powerful retort actually created as we left the oil age, at the birth of the new century.
History and destiny create patterns which can only be seen from afar.
Roger Conner known to you at ThatsItImout
I went back to look at the Hirsh report and it had one report of 2016 for a URR of 3000 Gb (1000 Gb more than HL predicts is possible). So even if we find another 1000 Gb of oil, we only get another 10 years.
The EIA has some other models that push the peak date out further to 2026. But to do that they assume a non-symmetrical peak. It has a slow upslope and then a steep drop. I have not seen a real country profile with that shape.
If we had crossed peak oil, then one would expect to see:
- massive drawdown of inventories of oil (inventories are at record highs)
- massive and sustained price rises (consistent with the last 4 years but that data is also consistent with the rise in all other (hard) commodity prices, in response to Chinese demand). Copper has gone up more than oil, I believe. Because of low prices, politics, environmental restrictions, etc. in the 1990s, little new commodity capacity was created. It will be a number of years before that capacity is full.
(conversely, China is investing 45% GDP in fixed assets. It is unlikely they can keep doing that forever).- signs of demand dropping to meet a lower supply since
Consumption = Demand = Supply + change in inventories
Inventories are rising and I haven't seen any sign of a significant drop in oil consumption (although I think US gasoline consumption has dropped about 3% from peak?).
The Systems Dynamics angle is interesting, because what it says is you can't tell whether you are in a position where supply lags mean prices are rising (to equilibrate with growing demand) or supply can't grow any faster or any more (ie Peak Oil).
The other interesting SD angle (which you point out) is that the model of exhaustion being used may be wrong. ie normally exhaustion (of oil) is a slope of similar height to the rise to peak. So the price signal from the market could be all wrong.
If we have crossed Hubbert's Peak, oil prices will go bananas. Oil demand is highly price inelastic (short run). Planes gotta fly, freight gotta be shipped, people gotta drive, diesel generators in agricultural settings gotta be fueled, people need kerosene to cook.
So your price rise, to bring demand back down to supply, will be correspondingly huge. It will also bring in alternate supplies (tar sands, oil sands, shale oil, coal to oil, gas to liquids etc.)-- but the time lags on that are years, if not decades (see commodities, above).
Oddly, I am more worried about gas supply, just at the mo'. From what Matthew Simmons says, at least, gas field exhaustion is a very steep decline curve. We could be near peak gas, with no easy way of generalising LNG infrastructure, etc., to fill the gap.
Link goes to comments by Norwegian jaha - over on my EU oil security post. What he is saying is that the west Norway grid may not have enough power to run the compressors on Ormen Lange. Also that the Norwegian Hydro dams are half empty owing to dry weather. The message I take form this is that once energy supplies get stretched, they also become vulnerable from unexpected sources.
Chernobyl was a classic example: all the problems of the Soviet approach came home to roost at once, making an accident into a total disaster (which apparently convinced Gorbachev of the need for radical reform).
Cuba is now close to that (power crisis, relying on a network of backup generators, cadres going door to door to encourage energy conservation, etc.). North Korea is also probably very close (threatening to detonate a nuclear bomb because of banking sanctions is a sign of desparation to my mind).
I don't think we are anywhere near that (California survived its power crisis this summer, and it has been shown that the 2000 power crisis was engineered by a few unscrupulous traders).
However Katrina, for example, demonstrated that there are holes in the system.
Not sure of a UK example but both the petrol blockade, and last winter's price spikes, showed that we are not robust to an energy supply interruption, however it is caused.
- massive drawdown of inventories of oil (inventories are at record highs)
- massive and sustained price rises (consistent with the last 4 years but that data is also consistent with the rise in all other (hard) commodity prices, in response to Chinese demand). Copper has gone up more than oil, I believe. Because of low prices, politics, environmental restrictions, etc. in the 1990s, little new commodity capacity was created. It will be a number of years before that capacity is full.
Massive drawdown of inventories:We don't know how much being sold to importing countries has been from storage facilities in exporting countries. Are exporting countries draining their storage facilities? We don't know when data is unavailable.
Massive and sustained price rises:
As Robert and I discuss further down the thread, the immediate (next month?) prices may be divorced from reality of supply/demand or are at least not a good indicator "at present" of the s/d situation. This could change as we get to the backside of the peak.
good point. I was only looking at known inventories. I am assuming that if OPEC can go for production cuts to stabilise prices, that they are not worried about excess inventories-- but they could be covering for too little production.
price rises:
We agree, I think, that we can't tell just from the price data what is going on.
Well, I guess I have a question about "inelastic". My understanding (and I am not an economist) is that if people "must have" something, then the price response will be inelastic.
So wouldn't it also be true that if people don't get what they need, they leave the economy? Say a factory does not get the fuel it needs - it closes. That demand will not instantly recover when prices drop. The demand is gone for months or years.
This is my mental model, but I will admit I have no evidence it is true. The other model is the thermostat model, where as prices go up, people turn the thermostat down. But I thought that reflected an elastic response to price?
I guess my point is that we might not see sustained high prices. Instead we will see the bouncing price increase in amplitude as it takes out consumers of increasing wealth. We may see prices hit all time lows after a major segment of the economy looses its bid for fuel and then collapses (but the collapse should be very clear by then).
Basically what happens for individuals is they shift consumption away from energy-using activities eg by buying a smaller car. But they also reduce their consumption of other activities (cheaper holidays, eating out less etc.). The latter effect may cause reduction in oil using demand indirectly across the economy.
Cars can be replaced every 6-10 years. Houses take much longer to replace, but if gas prices double, then people will insulate them more, etc. But in general, commercial structures last 30 years, and residential ones at least 50. So very fixed capital.
For a price inelastic good, consumers take money out of other budgets as much or more than they shift to using less energy.
For businesses something similar happens, but they also make a decision whether to exit. Energy intensive industries may simply shut up shop if the price goes too high. An example, during the 2000 power price spikes on the West Coast, aluminium smelters closed, and sold their hydro electricity to the highest bidder (California).
If the US were going through Peak Oil and Gas, then a lot of the plastics industry would probably just shut up shop. I remember the children's toy industry took a real hit in the 70s (most toys are plastic even then). Ditto some of the airline industry (only the airlines with the lowest costs and the most fuel efficient planes keep flying).
Eventually new businesses spring up doing something else, less energy intensive. But in the meantime there can be a lot of unemployment.
Sure.
The Lower 48 and the North Sea are vastly different regions.
The Lower 48 peaked, in 1970, right at about 50% of Qt (crude + condensate), based on the HL method.
The North Sea peaked in 1999, right at about 50% of Qt (crude + condensate), based on the HL method.
29 year difference in time.
Better technology.
Same result.
I'd love to hear from others as to whether what I just described is realistic.
I don't dispute it, I think most fields will decline quickly like Yibal, North Sea, and Cantarell-- more like the graph of the reindeer dieoff of St. Matthew Island than a slow declining tail.
Bob Shaw in Phx,Az Are Humans Smarter than Yeast?
http://www.foreignpolicy.com/story/cms.php?story_id=3567
This is why I used Texas as a model for KSA. The Lower 48 peaked right around 50%. Texas peaked at about 57%. KSA in 2005 was where Texas was at when it peaked. However, the Texas decline has been steeper than the Lower 48 decline, which suggests a steeper decline rate for KSA than the world, which is exactly what we are presently seeing.
Hot-gor,
What are you saying?
- I am in a fog.
- You are in a fog.
- Since you are in a fog about exact facts, you must be wrong.
- Since you must be wrong, I must be right.
OK. Let's give you some debate points for arguing that down here, close to the ground, things can be cloudy. We can't see everything clearly. We can't be sure of exact numbers. We could be off by 10% or worse.But when we "step back" into outer space; far back, so we see the whole of the solar system; we see clearly that things happen in "bands". No fog out here to cloud our vision. No political turmoil or other "above-ground" spin factors. There is a certain band of radii from the Sun where planets are large (Jupiter, Saturn, Neptune), where gravitational pull is large, temperatures are cold, and methane liquifies. That's the norm in that band.
When we focus our attention on the orbital band of planet Earth, we note that things happen even here within normal limits. Trees don't grow to 1000 feet in height. Methane does not naturaly liquify. The temepertures are, well, "temperate". The gravitational pressures are, ok, Earth level in magnitude; ... and as a result, a certain class of geological/chemical processes are going to occur. There is not going to be something extraterrastrail going on here.
If you look closer, you will see that on the planet Earth things happen in "bands", in ranges of lattitude. The largest oil deposits are found near the Equatorial band (Texas included). Now why is that? Could it be that the largest accumulation of biomass over the eons occurred in this band? Hmmm ...
But now you come to the party and argue that KSA is in a completely different band than Texas. That things are going to be dramatically; even astronomically "different" in KSA than they were Texas. You say that TODders have no numbers.
Well I've got numbers.
My first number is 3.
We are in the 3rd orbital band away from the Sun. No fogginess in that number.
Then here is another set of numbers: lattitudes. Saudia Arbia is in a lattitudinal band similar to Texas and GoMex. Given these sets of hard numbers, it is a good bet to "speculate" that things are going to evolve along relatively same trajectories.
No room to debate that Texas did not follow a Hubbert trajectory.
Soon there will be no debate about Mexico.
And then there is KSA ...
You want us to buy into the argument that things are going to be mystically and magically different there.
Where are your numbers to support that speculation?
This could be a clue.
Actually, the location of Ghawar was below the Tropic of Capricorn durring most of its stint as part of the supercontinent Pangea. I guess that means we can find massive oil fields in just about any sub-tropical region now, can't we?
But honestly, are you trying to suggest that because KSA falls on the same latitude as Texas and the GoM, they should follow similar production curves?
BOGGLE
Inflammatory and clueless all in one. How cute.
Qt is an output of the HL method, which you would know if you had bothered to learn how it works. But you have not.
And yet here you are giving us a lecture on "speculation". The kids over on peak oil debunked must be proud of your accomplishments.
Also note that production of organic material to feed marine oil source rocks is normally favoured by cold water. Cold ocean water is much more full of life than warm ocean water.
Also that anoxic (reducing) conditions are required to preserve dead organisms - and that normally means rate of production of organic material (near surface) has to exceed the supply of oxygenated water (near bottom).
Cry Wolf,
EXACTLY. The Hbbert Linearization has proven to be magnificant in places that that have been pretty much produced flat out, without political intervention, and that have been subject to third party audit and release of almost all information. It is much less usable in places where the flows have been varied up and down over decades, development of the fields have modified for political reasons and false starting numbers have been given.
Jeam Leharrere once wrote a long essay I have referenced here on TOD pointing out that HL is very limited in those situations.
As an example, I once use the Khurais Field, and asked for an HL of it's URR based on it's history (after all, it has a history going back to the 1960's of being pilot drilled, sort of developed, and then virtually abandoned. But now, it is being returned to with billions in investment to develop it, and a claim of a possible 1.2 mbd (million barrels per day) which would make it one of the top four oil fields in the world in production, IF, and it's a big IF, it can be done. What can HL tell us about the prospects for such fields?
I challenged the HL fans (of which I am one, but I now know the method has it's limits, if it is fed bad information, GIGO Garbage In Garbage Out) to do an analysis on the Khurais Field, to give us a URR, possible daily production rates, and rough peak year, but sadly, they all ignored the challenge.
Roger Conner known to you as ThatsItImout
I too think that HL is a great technique - similar to depletion models used by reservoir engineers on a daily basis - but like engineers, you need to understand the limitations.
All this can be viewed as managing national resources and making volunatry cuts. They just ran a half marathon and the judges have invited then to take a rest before completing the race - they would be daft not to take the opportunity.
Has anyone round here ever looked at rig counts? I believe Stuart may have done this before I appeared on the scene - it would be interesting to see some global rig count stats.
go in exactly the same direction they were already headed?
How convenient!
They will be at 8.8/million barrels per day after the "voluntary" cut of 300/kbpd.
This is the same country that was supposed to be around 12.5/mbpd sometime in the 2009 to 2012 period. After the cut, if they brought Khurais on at 1.2/mbpd immediately, they're at 10/mbpd -- that's their major new addition due in 2009, I believe, and I'm skeptical production will ever reach that level in this field.
I'm feeling a little bit skeptical about KSA's prospects at the moment.
You misplaced a decimal, the "voluntary" production cut would take them down to 8.8 mbpd, which would be an 8% drop since Matt Simmons' book was published.
And then there was our contribution:
http://www.energybulletin.net/16459.html
by Jeffrey J. Brown & Khebab
Published on 24 May 2006 by GraphOilogy
Texas and US Lower 48 oil production as a model for Saudi Arabia and the world
That is a really low number for them?
I saw a war movie once - might have been The Cross of Iron or Stalingrad - where the German generals got all excited about getting two brand new Tiger Tanks. The Russians were bearing down with a couple of thousand tanks at the time.
The Norwegians are getting over excited now about two little fields coming on stream called Enoch and Blane - while their giants are dying.
But that's the case in most cases all over the world. As I have said about a thousand times, keep your eye on the big four, really the big two. The fabled Thunder Horse Field is only going to produce about 5% of Ghawar's recent alleged production of 5 mbpd or so.
How in the world can we expect to see rising production when we have credible evidence that the four largest producing fields in the world are all declining or crashing?
KSA is far more exposed to a Ghawar decline than Texas was to the East Texas decline.
The remaining oil at Ghawar and Cantarell is in rapidly thinning oil columns between rising water legs and expanding gas caps. Water cuts at Ghawar are somewhere between 35% and 55%--after, AFTER!, they redeveloped the field with high tech horizontal wells. We know what happens when the water hits the horizontal wells--we saw it happen in the Yibal Field.
I remain puzzled that anyone seriously expects to see rising oil production when we have credible evidence that the four biggest producing fields are all declining or crashing.
Of course it is also tough to have rising production with the perfect storm of geopolitical events over the past year. Add to that rising inventories, and it is hard to imagine why oil production would have risen under those circumstances. Again, refinery utilization was down this past week. It had everything to do with demand and nothing to do with Peak Oil.
What's your falsification test? Would new "crude + condensate" production records be enough to falsify your hypothesis? Would you agree that there might be other logical explanations for why production has been down, other than "production has peaked?"
My biggest issue with your hypothesis is that I believe it is very selective with the data (and timeframes) it examines. Data that doesn't fit has been ignored, or handwaved away. I guess I would like to see it "tightened up a bit." If the hypothesis explains what we saw during the first six months of the year, were there also other explanations? If it doesn't explain more recent events, why not?
IMO, we are literally arguing orders of magnitude differences, e.g., the 250,000 bpd Thunder Horse Field coming on line (at some point) versus credible reports that the 5,000,000 bpd Ghawar Field is declining with water cuts in the 35% to 55% range.
Historically, we have not been able to use "small" fields like Thunder Horse to replace the giant fields like Ghawar.
Of the big four, the only question is Ghawar and literally every scrap of data that we have right now is suggesting that the field is either declining or crashing.
It's really that simple. We find the big fields first. IMO, the HL method is primarily plotting the rise and fall of the large oil fields.
Two vastly different regions, the Lower 48 and the North Sea, based on the HL plots, peaked at exactly the same stage of depletion. Russia is a complex case, but its production profile fits the HL model. The world is now where the Lower 48, Russia and the North Sea were at when they hit the 50% of Qt mark.
Again, you are talking about refineries, hurricanes, geopolitical problems, inventories, etc.
I am talking about the near certain decline, and perhaps crash, of the two oil fields that recently accounted for 10% of world crude + condensate production--followed by the certain decline of the next two largest producing fields, which doesn't even take into account the ongoing declines in hundreds of lesser fields.
Based on the internal Pemex report, the Cantarell Field oil column of about 800' is thinning at the rate of about 300' per year. This is the second largest producing field in the world.
We don't have any details for Ghawar, but we do know that it has already been redeveloped with high tech horizontal wells, and after putting in horizontal wells, they have a 35% to 55% water cut. We do know that they are at about the same stage of depletion, relative to OOIP, at which Yibal crashed.
The fact that the world is now where the Lower 48 and the North Sea peaked, combined with the certain decline of three of the four largest producing fields and the near certain decline of Ghawar is why I am so adamant that we are at or past peak crude + condensate production. Given these facts, I remain puzzled that any non-cornucopian is expecting rising oil production.
A problem I have is that there is quite a bit we don't know. A lot of the info on Ghawar is speculation. We don't know how many fields around the world aren't producing at capacity - but there are quite a few. But here is what I do know. If I could process the oil, I could probably go out on the market and buy an additional million barrels per day of crude - right now. The problem is that the demand isn't there. I can account for a lot of offline production that has nothing to do with Peak Oil. So, if the demand was there, I have no doubt that we could break a production record today.
This is something that Stuart acknowledged earlier in the year during one of his plateau updates. I pointed out that there was a lot of production offline that had nothing to do with Peak Oil, and he admitted that if you added that production in we would definitely be setting production records. Likewise, if the demand was there, I believe that today we would be setting production records.
As I pointed out up the thread, according to the EIA numbers (subject to revision, but generally revised downward), the world has produced about 142 million barrels less crude + condensate than if we had simply maintained the December production rate, with no increase in production rate.
The EIA numbers have supported my thesis that rising oil prices were indicating a decline in oil production, and based on the 2004 top 10 list of net oil exporters, these 10 countries, from 12/05 to 6/06, were showing about a 9% annual decline rate in estimated net crude + condensate exports. The recently reported Saudi numbers continue to support this estimate.
Granted, your company may be able to afford to buy oil, but can you say the same thing about companies in Africa? The US is not the world. The fact that the US is currently well supplied does not mean that all parts of the world are well supplied, and it does not mean that we may not face supply problems in the next few months.
Providing that we don't see a recession, I still expect to see a renewed bidding war for net oil exports in the fourth quarter, e.g. credible reports that KSA will be at 8.8 mbpd versus 9.6 last year.
In regard to the rounding error problems--production down, civil unrest, etc.--those are always factors. We are never producing at 100% of capacity.
The fact that the world crude + condensate HL plot is now at the same point at which the Lower 48 and the North Sea peaked is not speculation.
The decline and/or crash at Cantarell, Burgan and Daqing is not speculation.
Prior to the Saudis takeover of Aramco, the estimated OOIP for Ghawar was 170 Gb. According to Matt Simmons, the world record recovery factor for this type of reservoir is about 45%. Ghawar (closing in on 60 Gb) is at about 35% of OOIP, where Yibal--same reservoir, also horizontal wells--started crashing.
Again, according to Matt Simmons a retired Aramo exec told him that there was no way, in his opinion, that Ghawar would make more than 70 Gb.
The Saudis have admitted to a 35% water cut at Ghawar, after redeveloping the field with horizontal wells. Morton suggests (this is speculation) that the water cut may be as high as 55%. However, Ghawar is at the same point at which Yibal crashed. This is not speculation.
Let me put it this way: the question is whether Ghawar is producing one bpd of water for every one bpd of oil or one bpd of water for every two bpd of oil. In a field that has already been redeveloped with horizontal wells, does this sound like a stable situation to you?
I have outlined a way to test my (and Deffeyes') hypothesis. Keep an eye on the cumulative shortfall in production relative to December. Just multiply the average crude + condensate production times the number of days since 12/31/05 and compare that number to the December production times the same number of days. Right now, the deficit is about 142 million barrels.
But here is where I think you tend to ignore data. What is happening right now? Imports are still going up, and the price is crashing. If falling imports and rising prices support your thesis, then what we see now must be evidence against it. Furthermore, crude stocks have been well above the average historical level all year long, which I would not expect to see if oil production had peaked. We have had no problems at all keeping our inventories high, even now as prices crash and other countries should find that they can once again purchase oil.
Again, according to Matt Simmons a retired Aramo exec told him that there was no way, in his opinion, that Ghawar would make more than 70 Gb.
But have executives also told him that it would make more than that? If you only report the pieces of information that support your viewpoint, instead of all pieces of information, it can provide a very distorted picture.
I have outlined a way to test my (and Deffeyes') hypothesis. Keep an eye on the cumulative shortfall in production relative to December. Just multiply the average crude + condensate production times the number of days since 12/31/05 and compare that number to the December production times the same number of days. Right now, the deficit is about 142 million barrels.
What exactly is the falsification test here? I think we agree that production is down. The "why" is the question. What I am looking for is some indication of what it would take to convince you that it was not because production has peaked.
In January, I predicted falling Saudi and Russian production. We have falling Saudi production. Russian production has been down, and then up, but as I pointed out the EIA has already downwardly revised its estimate of Russian production by 50 million barrels so far this year.
I also predicted rapidly rising consumption among the exporting countries, which would also lead to lower exports, and in most cases that is exactly what we are seeing.
At this precise moment in time, we have to have some demand destruction (someone has to be cutting back), but US inventories on the basis of consumption are not that high, especially if you remove the loan from the SPR. And again, the US is not the world. I understand that OECD inventories are really not out of the historical range.
But the bottom line is that I predicted lower exports worldwide this year (and lower overall production), and that is exactly what we are seeing. The fact that imports into the US are healthy (for now) does not mean that imports everywhere are up.
Re: Peak Oil
I have stated that I have five reasons that I believe we are at or past Peak Oil: the HL model; Ghawar; Cantarell; Burgan and Daqing.
IMO, I have confirmed 4.5 out of 5.0 reasons to support my premise that we are at the world peak.
The Lower 48 peaked at the same point that the world is at now, as did the North Sea. Russia hit a plateau at the same point. If we had some giant new fields coming on line, I would have some doubts about the HL model. But the opposite is true. The giant fields are almost certainly all declining. And the one big new field in the Caspian Sea is years away from production.
Cantarell is declining or crashing.
Burgan is declining.
Daqing is declining.
The only real question is Ghawar, which is the only one of the big four where we do not have a confirmed decline. I presented several pieces of data regarding Ghawar.
We do know that an analogue field, Yibal--same reservoir, same horizontal wells--crashed at the same stage of depletion.
We know that the water cut is at least 35% (one part water for two parts oil). Morton reports (rumors) that the water cut is 55% (one part water for one part oil). Heinberg reports, based on what he characterized as a well placed source, that Ghawar is down to 3 mbpd. In any case, 35% to 55% water cuts in a field which has already been redeveloped with horizontal wells is not a stable situation--see the Yibal case history.
Recent reports by OPEC indicate that Saudi production is now down by 800,000 bpd since last year, which IMO is a pretty strong suggestion that Ghawar is declining. Remember, Saudi is tremendously dependent on this one field.
In regard to Simmons' account of his interview with a retired Aramco executive, I can only assume that Matt considered him to be a credible source. In any case, as Matt Simmons warned, Saudi oil production is now falling.
I don't know how many different ways I can say this. When all of the big fields are almost certainly all declining, I don't see any reasonable expectation of rising production.
Given the foregoing, what did we see in 2006?
Through the first seven months of 2006, we saw the highest nominal oil prices in history, while cumulative crude + condensate production was 142 million barrels less than what it would be if we had simply maintained the December production rate. The early indications of fourth quarter production don't look terribly promising.
IMO, we are simply seeing rationing by price. I do not expect to see a positive supply response.
In January, I predicted falling Saudi and Russian production. We have falling Saudi production.
If Saudi production heads back up, then we can say your hypothesis is falsified. You can add caveats if you wish. Hows that?
Robert I understand looking for a falsification test. IMO that is good - <to test> . However I wonder if there will be some spikes/dips. Would a running average smooth but keep the data tight enough to get the direction. I really don't know. Math people- I need some help here
Robert, let's qualify your statement above.
Imports are going up for who? The USA. Are they going up for all other importing countries as well? If not, then perhaps we (the US) are just better "leveraged" to get those imports. Larger imports for one country does not imply that there is more out there for the entire planet. What is the total balance of imports across the world? Westex?
As far as prices crashing...that's old news...the new news is that they've stabilized at around $60...in fact, they've been AMAZINGLY stable around $60 for the last week or so. If we (the planet) are all so well supplied, why are we stuck at $60. Is this the price that makes extraction profitable now? Why? Is crude more difficult to extract?
You make a point I have made several times. When WT used declining imports to support his hypothesis, I pointed out the same thing: He was only looking at imports to the U.S., and doing so during a time spring turnarounds were in full force.
As far as prices crashing...that's old news...
What is significant is that they were crashing while imports were climbing. This is exactly the opposite scenario from the one WT was using as evidence to support his hypothesis. That is the point.
If we (the planet) are all so well supplied, why are we stuck at $60.
Where should the price be? And why? Did the supply equation change much this year as prices rose very high and then fell? Does the supply situation change much when the Iranian president makes nuclear noises, driving the market higher?
Right...more and more...I'm convinced that immediate (next month?) prices are divorced from reality of supply/demand or are at least not a good indicator "at present" of the s/d situation. This could change as we get to the backside of the peak.
What is a better indicator in lieu of transparent reserves data?
If we can figure that out, we can become very, very rich. :-)
And that in turn is why we can not predict where prices will be better than the market. Because everyone who is trying to get rich, or just lock in assured prices, has made their bets - which is how the future price is determined.
In order to believe we can make money on predicting future prices, we have to assume we are going to be more accurate than the average of the group of all other people who have made the same assumption.
- violence over energy in third world countries
- price changes in other commodities/currencies
- political wrangling across the globe
- import/export data
- tanker shipment bookings
A hugely difficult undertaking.But really, it is more likely that Dems will do more in the area of conservation and so called alternative energy than the Republicans. This could have a countervailing effect and could help drive prices down.
And this is just a small part of the whole picture. For me, at least, this whole exercise of trying to figure out future prices is just too complicated and subject to surprise events.
Speaking of geopolitical impacts, I wonder why Chavez' "Diablo" speech had no impact.
You could be right about the writing on the election wall . If Dems get some control, they will be more apt to engage conservation measures and produce a capacity buffer in the global market.
http://www.energybulletin.net/15126.html
As I pointed out at the time, the fall in inventories corresponded to a fall in refinery utilization due to higher than normal turnaround activity. Also note that even though imports were down, inventories still grew by 20 million barrels over this time period (and they were already 30 million barrels above normal). The market was obviously adequately supplied.
So, what's happened with imports since then? They are at record levels, having made up all of their decline and then some - even though prices were falling.
This is why I keep challenging you for a falsification test. You used falling imports and rising prices to support your hypothesis. Since then, we have seen the exact opposite. Why isn't this evidence against your hypothesis?
Firstly not all of the world can afford $70 a barrel oil. Not over an extended period of time. High oil prices are like interest rates - they have a brick on a rubber band effect on economies. No-one thinks they are impacting - when whack a couple of years later we have falling house prices (in the case of interest rates) and inflation shocks (in the case of oil prices).
Secondly most middle eastern countries must now be aware that we are very close to a peak. They also must be aware there is no real easy substitute for oil that will come in and take their market away - except for demand destruction. As time goes on oil will become more and more expensive. So there is no real need to go full out pumping. With the supply demand gap forever diminishing the chances of someone sneakily going off and pumping a load more oil, crashing the price and getting more revenue are receding.
They have also gotten greedy - they want the dollars and have got used to the revenues. They also know that as the first world countries are suffering from the greatest deplection they are likely to get that money. But the high price has led to some falling demand. There are some substitutes out there.
So who convinced me most? Well I am always convinced by westexas until I read Robert's posts. I think that Garwhar may be crashing, but demand is declining enough and supply from other countries (and not filling the SPR) has just about kept us going. But for how much longer? Months? A Year or three at most? Its not long even if Robert is right.
Nobel prizes for economics and literature heading your way.
If I'm a supplier especially one that is now tuned into PO then I'm becoming increasingly concerned with my ability to continue pumping the oil over the longterm (i.e. we have seen this debate gaining traction in Kuwait). The conclusion here is that so what if demand is rationed due to high prices thats actually good because TR is not tremendously affected. The upside is that I still have more supply to sell at increasingly higher prices.
Thanks for the debate WT and RR you guys are titans!
It matters greatly from a credibility standpoint. If people keep calling the peak wrong, people won't listen. They won't listen even after peak has truly happened, because they have called it wrong in the past. What I want to do is make sure we aren't careless when we say "peak is here." I want us to look at every data point, not just the ones that support a specific point of view.
You may be right, that it may be upon us in 2 or 3 years. I hope we have a bit longer than that, but I have always conceded that it may happen as early as 2010. But a history of failed predictions is not going to help convince many political leaders to act on this issue. What if peak happens in 2015? Who will listen? You can't cry wolf too many times.
We could at some point have 5-10 years of flat or decline and then a shoulder to the curve that produces a second "peak", maybe a big discovery in the artic or widespread EOR enables that. It matters what time scale you are calling the peak (local maxima).
It all doesn't make much difference relative to what we should be doing, or at least starting. Some places are doing, some starting and some not.
We also agreed that the world had capacity not being utilized due to hurricanes, upheavals in Iraq and Nigeria, seasonal shutdowns or maintainance of various fields.
However, none of this was capacity that one could go out and purchase. It was offline but for non-peak, non-geological reasons, (except for heavy or currently unusable crude that is recognized as spare capacity at least in SA).
Your hypothesis that the world has additional capacity of at least 1 mbpd usable crude that could be immediately and sustainably delivered should also subject to falsification tests.
We can't do this directly, but there can be indications such as:
1. When another nation increases production, can they sell it?
-- So far the answer seems yes. Why can Russia, Iraq or African nations increase sales by a few hundred thousand barrels in the same month that SA has a drop in sales of several hundred thousand barrels in theory due to no demand?
- If there is lots of unused capacity waiting to be sold, why aren't prices dropping further? I know they've declined, but they are staying high.
- On the one hand, you believe SA may be holding back production and believe their statements that they are doing this to support prices (which, as I've noted before would be an unprecedented step to take unilaterally). But then you state that it's not being held back, but rather there is no demand and it's just not being purchased (which you need to reconcile with point #1). These are two different positions, and add to the confusion.
I admit to being uncertain myself, but I think if you insist on a falsification test for westexas, you should apply the same to yourself. I hope you could apply further tests than I've had time to think of right now (I'm at work). We know that overall the world has adequate supply at present - at these high prices- so until the supply situation gets really tight and people can't get oil no matter what the price, a lot will remain obscure.No, there were many pieces to it. I pointed out many different instances of shut in production. Stuart at one point said "well, we should see discounted crudes in those areas." He looked it up, and said "OK, we do see discounted crudes in those areas."
Here is some of the discussion in which he acknowledged that the picture had changed:
http://www.theoildrum.com/story/2006/4/15/72931/5527
By the way, there is a spammer at the bottom of the thread, in case Super G is reading this thread:
http://www.theoildrum.com/user/bobito
Why can Russia, Iraq or African nations increase sales by a few hundred thousand barrels in the same month that SA has a drop in sales of several hundred thousand barrels in theory due to no demand?
In my opinion, they are doing exactly what I would do. They see falling prices, so they are cutting production in order to short up prices. As I pointed out, refineries have been cutting production lately as well.
If there is lots of unused capacity waiting to be sold, why aren't prices dropping further? I know they've declined, but they are staying high.
See the previous explanation. How far should they fall? Why? I think OPEC will try to keep a $60 price on oil by limiting capacity. I could ask the exact opposite: If production has peaked, why isn't oil is at $150/bbl?
But then you state that it's not being held back, but rather there is no demand and it's just not being purchased (which you need to reconcile with point #1). These are two different positions, and add to the confusion.
They are not 2 different positions. Demand is dropping. You can see that in the inventory reports. Supply is outstripping demand, so suppliers are cutting back. I am not sure what you think is inconsistent about this. It is exactly the same thing that has happened in the refining sector. Producers don't run as much as they can possibly run. They run at an economic optimum, which could be substantially lower than running at max capacity.
We know that overall the world has adequate supply at present - at these high prices- so until the supply situation gets really tight and people can't get oil no matter what the price, a lot will remain obscure.
On that, we agree. Note that I haven't taken an adamant position that "the world has not peaked." I have taken a cautious position, and challenged some of the logic used to bolster the "peak now" position. I certainly don't believe the world has peaked, because I know where there is enough shut-in production to set a new production record today if brought on-line. To me, that would indicate production has not peaked.
It looks like this has already been taken care of, but don't forget that Super G set up a thread (that can be accessed from the front page) called "Report Spam" that you should put spammers in. In fact...it looks like Leanan put him in there.
I think prices are down because, and only because, we are in the shoulder seaaon and some unusual events have happened... GS reducing the gasoline component, a large hedge fund losing big on ng, and ng dropping in half from last winter. If true, prices will rebound sharply thru the winter regardless of what opec does. If and when crude production increases prices could decline on a long term basis.
What I think will actually happen is that the poor countries will get squeezed out first - so we never get near $150 - and the international situation turns ugly - I mean properly ugly.
This is from the Norwegina Energy Crisis site - and I think it shows the signs of the rest of the world getting squeezed.
http://energikrise.blogspot.com/2006/06/utvikling-i-global-netto-oljeeksport.html
Which mountains are you referring to? Is there something under the Himalaya's or under the Atlas mountains, which has escaped the attention of the industry?
I note that oil was averaging around $40 when Chevron and then partner Encana struck oil at a depth in the deepwater GoM (Jack) equal to height of Mount Everest. There was no apparent need for sky high prices to undertake critical steps in a process that requires engineering skills more complex than those required to put people on the moon.
I note that quantities of earth equal to the volume of mountains are being moved to extract degraded hydrocarbons from the tar pits. It is interesting that when the price per barrel of oil was in the mid twenties (inflation adjusted)in 2001, claims were being made that the cost to produce a barrel from the tar pits was about $11. Recently with oil in the $60 range, claims are made that the cost per barrel averages near $40. Assuming the accuracy of the claims (the first was from Natural Resources Canada and the second is oft repeated), the trend seems to indicate a declining return on investment. Which might explain the rash of delayed project announcements coming out of Alberta. Do you think the return on investment will increase with oil at $150?
I think the evidence is that the industry is moving all the mountains it can handle. To no avail. More importantly, the entropy of the hydrocarbon resource is rising. No amount of money is likely to change this reality.
?do you mean that the energy return is falling?
Most of the majors are still budgeting on $35 / bbl - so you really ain't seen nothing yet.
Yes, that is another way of looking at the situation. On average there are more resources consumed to make the hydrocarbon product useful to the economy. Some small part of the increased resource consumption is due to the 'friction' involved in the recirculation of great amounts petro-dollars. Most is due to declining resource quality and to more difficult access.
A few years ago the majors were budgeting on $20 dollars to rationalize investments in the tar pits. These are shadows on the cave wall, not the reality with which we need to be concerned.
Google the published financials for Suncor, Great Canadian Oil Sands, Syncrude (they've changed their names as income trusts but the resource bases are the same). SEDAR would give it to you (Canadian securities filings).
That is consistent:
- using historic cost accounting. So much of the capital and R&D cost is already written off
- you access the cheapest, simplest assets first in any mining operation, the 'richest seams'
New facilities are accessing more difficult seams, and the price of labour, water, etc. has soared. Hence doublings of capital cost estimates. Cost/bl goes up accordingly.WRT to gas security, I left you a message and interesting link up the thread.
Neither does the Canadian Prime Minister ;-).
Therefore it is not happening ;-).
I think we'll drown in CO2 before we run out of oil (but I am prepared to believe PO is only 20 years off and the falloff could be more dramatic than consensus expects). If we do run out of oil, this will accelerate the CO2 problem-- the world has (at least 100 and maybe several hundred) years of extractible coal.
Although I am the first to say Canada will never produce as much tar sands oil as Saudi Arabia does crude, in a 'Manhattan Project' situation it could. And Colorado could do it again in oil shale.
At $100/bl oil, both will happen however the CO2 consequences are so horrific that they are hard to think about.
And while I think you are right on the vast majority of views you express - I think you have the 20 year PO horizon wrong - but lets not go there right now.
But really, there's no need to preach. The world is inexorably moving to every alternative it can get its hands on.
I would tend to lean towards you on this one.
I am in the process of finalizing a post that will be posted on the Norwegian (NOTE spelling, CW) Energy crisis site ("Kveldssong for hydrokarbonar")
http://energikrise.blogspot.com/
that is an update of above linked post.
The data from EIA Petroleum International Monthly for October 2006 suggests that total production from the worlds 15 biggest net exporting countries, all with net exports of 1,0 Mb/d or above in 2005, is at best flat for the 7 first months of this year.
(Net exports being defined as the difference between production and domestic consumption.)
In 2005 there were 15 countries, all net oil exporters, that had a total production of 51,6 Mb/d (BP data) that was about 64 % of total global production.
These same 15 had (still 2005) total net exports of 40,3 Mb/d out of total global net exports of 43,8 Mb/d, translating to
92 % of global net exports came from 15 countries in 2005!
(I HAVE NOT SAID ANYTHING ABOUT GROWING RESOURCE NATIONALISM,....YET.)
Production within OECD had a high back in 1997, and has since been declining and still is, suggesting that imports into OECD should continue to grow in 2006. Imports to China are up 0,4 Mb/d for the 8 first months of 2006 compared to the same period of 2005. Car sales is now increasing significantly in some of the oil exporting countries, suggesting increased domestic consumption, thus less exports (all other things considered equal).
To sum it all up, so far total production from these 15 is at best flat (remember that these same 15 had 92 % of global net exports of oil in 2005) so far in 2006 compared to 2005, total domestic consumption should be expected to grow for these 15, imports into OECD and China is growing so far in 2006 relative to 2005 suggesting that some, mainly many of the poorer countries (which are poor because they have far less money than rich countries), will have to continue to cut back on their consumption (imports) as they increasingly find it harder to participate in the global "bidding war" for oil. There has recently been a lot of posts here on TOD documenting fuel protests and riots,... in mainly poorer countries.
The above diagram CW linked to suggests that other (and poorer) countries reduced their total oil imports from 2004 to 2005. Note also that this group of countries increased their imports when oil was cheap (and everyone could afford it) at $10/bbl back in 1998.
It is of course too early to conclude were global oil production will head the next 2 - 3 years, even as it has been almost flat for the last couple of years. I believe that poorer countries will continue to cut back on their imports as prices grow, and it is the portion from this other countries that first will shrink (to allow for some growth for still some years for OECD and China), which in effect will act as a cushion for the richer countries and thus restrain future rises in oil prices.
As the other countries are down to the amounts deemed necessary to sustain some sort of society the problems with physical availability will start to hit home with OECD and China.
So now, dear TOD readers; imagine what happens as global oil production declines, let's say at an annual rate of 2 Mb/d, it may be observed from the diagram that it will not take many years before physical shortages started to affect the richer countries, and then prices really will head aggressively northwards.
My point, I think $150/bbl is still some time away as long as the poorer countries will be forced through price increases to cut back on their imports and thus effectively act as a cushion for richer countries for some time.
SEE; A new meaning to; "TIME IS MONEY!"
This also illustrates that oil is a fungible commodity and how demand destruction works in real life.
----------------------------------------------------
When delegates from poorer countries, that now are receiving economical aid from richer countries, in the future meet with their sponsor nations it could be that they say something like;
"Don't send us any more money in the future!"
"SEND MORE OIL!......NOW!......please!
Then we surely know where we are headed.
Rgds
Energimann (NGM2)
Many thanks for posting your fine graphs on this web site. I notice "Cry Wolf" has been posting some links to your website as well. I wish I were able to read Norwegian, so I could read your analysis as well!
This leads to a fundamental philosophical debate about what should be done. It is one thing to be able to take a set of numbers and use those to see into the future - another thing to decide whether action should be taken to influence that future.
Westexas made an interesting comment several million words up this thread, which was that the US government did not acknowledge US peak oil for 9 years after it happened. And I dare say that the OECD will do the same with World peak oil. So what I think will happen is that the developing world will get squeezed out of existence so that "we" can continue as normal for another decade or so- and I'm not sure that anything we do or say here will influence that.
This will of course affect us, as we will see the disintegration of many countries and societies, increasing polarisation, and those poor folks are going to be mighty pissed of with "The Haves".
My spelling has never been that good - and I have become reliant upon spell checkers - however, my spelling is a lot better than often portrayed in my posts - I have discovered I am actually quite world blind and don't spot erros till after.
Norwegina would however, be a good brand name for kitchen ware.
Simmons fall-off diagrams of gas fields are even more worrying than oil. Because oil we have the substitute of gas, gas we have the substitute of nothing (except, sort of, coal).
but i can't find out how well each one is doing. good luck!
Could we see a big jump in reserves, without any new oil being discovered?
If you can't actually produce much new oil due to skyrocketing costs & constraints of various kinds, you can always inflate the reserves numbers. This gives many in the world a warm, fuzzy feeling and looks good on paper -- and although Billy Crystal said "It's better to look good than to feel good", sometimes you can do both.
Yes, we will, and it's been a long time coming. Question is, how far will they go? There is a lot that can't be produced for years, there are claims on regions that require yet-to-be-invented production methods. Will all of that be allowed in?
When Chavez a few months ago proposed a guaranteed fixed $50 rate per barrel, that was in view of the fact that he could then count the Orinoco as reserves. Which would have made Venezuela's reserves the biggest in the world, and raised his position in OPEC to no.1 (not unimportant). Even though, for the foreseeable future, Orinoco will only be produced by the spoonful.
The pressure to count all these 'exotic' claims as real is enormous. It looks good for shareholders if all of a sudden you have twice as much to produce. Shell, for one, has moved away from conventional oil bigtime, it's all they have left.
So what about for instance CTL, or GTL? Count that too? They'd love to.
If some majors don't get the reserve definition restated, they could be looking at some major declines in proven reserves, because they are having trouble replacing conventional reserves.
BTW, Canadian crude + condensate production is still down versus December, by about 12% through July.
Basically 80% of the country's oil production or 2.9m bbl/d is supposedly going to be coming from the sands in 2020.
The problem of course, is that the bulk of these reserves are in-situ, meaning that massive quantities of NatGas and H2O will be needed to extract the bitumen in a much more complex and expensive process than mining.
Considering the production difficulties vis-a-vis time, price and especially depleting NatGas sources, I wonder if this isn't the reason for the SEC request?
Book what we got cause' we ain't getting it out anytime soon.
Our human brains seem much happier with a trend going in this direction as well. It's enough for some of us to go out and get that SUV we've wanted (or one of the hemi-powered station wagons that are popular out here).
My middle of the road position is that those SUV and hemi buyers are foolish, but at the same time, I think some of the immediacy of the Peak Oil problem has been challenged.
We may indeed be in a decades-long period of transition, with peaks and valleys along the way. We may indeed see gasoline at $6/gallon ten years from now ... but maybe it looks a little bit less likely that we'll be at $6/gallon five years from now.
With the pressure off, I'm back to thinking this will be a 10 to 20 year transition, with much to interest the patient observer.
The very idea of a "transition" suggests that you are going from one thing or state to another thing or state. So what is the state that you are projecting for 10 to 20 years? I ask this because 1) I see no sense of planning for a new state, 2) change appears to be the norm and not the exception, and 3)I want to know if you think increasing poverty amounts to a transition.
(Just for the record, I've never been one to believe in the sudden collapse and I believe that in 20 years we will be only in the early stages of the collapse of western civilization).
The only interesting questions are:
a) when are we aware of them
b) when can we correctly anticipate them
;-)
And that background might explain my answer to your question about "what state" that implies ... I sure as heck don't know, and I would find a lot less to "interest the patient observer" if I did!
The future need not be as murky or as disastrous as it will be if we simply wait for the heavy hand of the market to do its thing.
Some of use, albeit maybe in relatively small way, have made changes to our personal lives or patterns of consumption that will make future rises in oil and gas less painful, maybe even welcome. That planning on an individual level would make sense on a broader, societal level.
As it is, we have seen that oil and gas prices can plunge radically at any given minute or at least week or month, regardless of the existence or non existence of peak oil. 99% plus of the public has little understanding or even real interest in peak oil. The message is at the pump. Unfortunately, imprudent short term behaviors are being acted out based on that message.
So I'm left thinking, observing really, that we will have a messy response. Part of that messy response is imperfect measures taken by local, state, and federal governments. Part of that messy response is market and price driven.
Will this month's dip in hybrid sales be lasting? Well, there's another thing we don't know.
FWIW, one factor forcing an upward blip an past months was the near-exaustion of the HOV sticker supply. Now that the limit has been increased we'll have more people buying hybrids for taht (messy and not directly market) reason.
Actually, we have some data to the contrary:
http://www.resultsforamerica.org/environment/poll.php
At some level we (2/3 of us) actually do know and agree. We just also have a weakness for big and fast cars.
Maybe the deal is that people who answer "yes" on that poll will downsize when the next guy does. Though, I'm sure more than a few of them just wish they could override physics and legislate the MPG of a large SUV up to 40 mpg.
I'm sure you're aware of that old saw "where you stand often depends on where you sit." So I like to turn around the analysis and instead of asking "Is this person's stand correct?" I like to ask "What does this person's stand tell me?"
In the end, any "solution" to our current circumstance will come out of the thoughts and actions of people, so understanding how and why people think and act will tell us much more than the possibilities of technology.
You must be smarter than me if you know that. Maybe I could take advantate of your skill ... how does the Iraq thing end? What is the final $/watt achieved by these crazy solar researchers? How does China see itself in 2015?
Thanks in advance!
I don't see these discussions as a right and wrong sort of thing. I see it as a continious iteration of the possibilities. I read and post here because their are some bright and perceptive types and we can all hone our visions by interacting. I might fight tooth and nail with you over our respective views, but I'm not going to ever tell you that you are stupid because of what you believe. Because when it comes right down to it, all knowledge would appear to be belief. I might think your interpretation of something is stupid (meaning ill thought out), but not you yourself.
So - the "Iraq thing" (I'm assuming you mean the american occupation) ends in 2013 when a currently little known politician rises to the presidency running on a non-interventionist platform. The solar researchers are never able to get under $5 a watt due to a little understood limitation called the "solar collectivity law of regressive returns." China in 2015 is in the middle of social revolution and political meltdown that leads to the rise of 5 independent states - so China would be beginning to see itself as no longer China.
;-)
If we are really fluid we'll say "what do lower oil/gasoline price mean to my prediciton?" and not "what conspiracy can I name that will allow my predictions to stay on track?"
A continuous iteration has to be fluid to it's roots, and not just on the edges.
Best wishes and hat tip on the patient response, that's the kind of thing that raises the bar.
I see these responses to events all the time - our deep (for want of a better word) beliefs often predetermine our belief on any new bit of information. Its rare to find people willing to question their beliefs at every turn (and I include myself in that), but working toward exposing your beliefs to reconsideration is an important aspect of personal growth.
And then I hear this morning that Newt Gingrich is suggesting that the whole Foley thing is a democrat/liberal plot! (Those rascally liberal are so clever they went out and got a gay pedofile republican elected to congress so that they could later expose him, apparently).
Did you see Fox News labeling the Republican pedophile as a Democrat from Florida.
That's desperate ...
What does it matter the energy cost when in 10 to 20 years we have sea levels rising just a few more inchs to anything more?
What does the energy outlook matter with all the other issues out there?
Sure here in the west we might see 10 to 20 years before we look like Bangledesh, but what about all those other coutries, do we sit over here and not care a whit about them?
10 and 20 years are vast time scales for most people.
One time not to long ago, a co-worker asked me where I saw myself in 5 years, I could not at the time give her a good answer. In those 5 years though, I had 4 jobs, moved to a different state, had a wife cheat on me and leave, and gotten married to my second wife.
5 years a lot can change. We are predicting nothing much will change in 10 or 20 years, come on folks you have got to be kidding!!!
Thus, the cycle continues. High prices spawn decreases in demand which spawns low prices which spawn lower demand. Decreased production sets in and the cycle continues. Permanently constrained supply in the form of peak oil might attenuate this cycle and eventually break it but should we wait that long?
In the mean time, our trade deficit gets larger, and our dollars go overseas, whether to OPEC, or others, including to regimes that are not necessarily operating in our interests, or at least in the interests of TPTB. We don't need a cycle; we need a trend. The desired trend is constant and continuous declines in demand regardless of what the world supply or price situation is. Establish a target price for gasoline, for example, and keep the price of gas at that price or above by adjustments in taxes. Announce that increases will occur over at least the next ten years and stick to it. Let the world market adjust accordingly.
In the mean time, beautiful minds are wasted speculating what the Saudis and others are thinking or doing. The lack of transparency just makes it all the more fruitless. Instead of being jerked around, the United States should take the initiative and begin to take control over its own destiny. We know we will eventually be forced to reduce our dependency on oil. Let's not wait for the market to dictate that.
I finally quit smoking because I got tired of being jerked around and controlled the killer weed. When will we get tired of being jerked around by the oil producers of the world?
http://www.energybulletin.net/19701.html
"The major palpable difference between the four Ts is their respective gradient of oil output decline -- very small for T1, perceptible for T2, remarkable in T3, and rather steep for T4."
It's not clear to me that this is a "model" at all. If all it is is an expectation that oil depletion rates will increase as time goes on, then any dilineation into phases is nothing but arbitrary categorization by depletion rates.
Do you have some other information about his transition model that would lead one to believe it is something more than this?
<*>
Some testimony to the senate in Australia where transitions are discussed
(direct link to PDF)
http://www.aph.gov.au/hansard/senate/commttee/S9515.pdf
another media article
http://www.moneyweek.com/file/18243/why-we-must-take-peak-oil-seriously.html
and some other papers etc
http://www.sfu.ca/~asamsamb/sb.htm
One of the things I like about reading TOD is that you sometimes get a glimpse of the mental models that people are using. It is especially helpful if those models are not your own. Then you can weigh them.
What I am hearing you say is that you are using Price to determine peak Oil Production. And further that Price will tell us what the shape of the down slope will look like.
I think this mental model is very common. I know Beechdriver posts items reflecting this mental model all the time. It is common in the press.
Yet, I don't think I have ever seen anyone prove (or even attempt to prove) that price can predict peak oil.
I think the idea is intuitively attractive for good reason
Price = Function(Supply/Demand)
The problem is the relationship is chaotic by nature. Demand shifts around based on buyer cash flow, security, desperation, inventory, hurricanes, etc. (all the post-hoc analysis you mention). This makes inverting the function to use price as an input basically impossible.
Again, the idea is intuitively appealing, but it is like trying to use the calendar month to predict the afternoon's weather. Is there a relationship? Yes, the winter months are colder, etc. Is the relationship direct enough to predict what will happen at 5pm? No. The month is overwhelmed by other factors.
Media likes to comment on price because obviously that's what people in the present car about, and also that's what can be measured and reported on daily - and they need to get their daily copy out the door.
So...back to the market and irrational people. The market, involving perhaps irrational people, may be irrational itself. However, that does not make it unpredictable...just that sometimes it moves in ways that do not appear logical.
Jeez...Socrates would have loved this blog.
I actaully buy that to a degree ... but how far can you push it? Could a production crash be five years away without the market actors knowing (and trying to get rich)?
But to agree with you on Adam Smith...everyone is not working simultaneously, in a rational manner, to optimize their return.
Even then, our concept of rationality is just an idea. We are not led by reason, none of us. The financial market is the priime example of being driven by greed. Which is not reason, no more than jealousy is.
We're rational alright, but only after the fact, when we tell ourselves and others why we did what we did.
All in all, what drives us is what drives yeast. No difference, other than we lie about it, and they don't, as far as we can tell.
I think I've seen you write things about sociobiology in TOD threads, and I think sometimes I've agreed with them ;-).
The value of this book is that it highlights human gut reactions to various economic situations. Those reactions can lead the reader to think about proto-human reactions to proto-economic decisions. Or game theory for those decisions and situations.
FWIW, I think this sub-thread thows out too much of the baby with the bathwater. We do have some level of economic skills ... they just aren't perfect.
At the same time, I'm a casual chartist on gasoline prices. I look at the 3 year plot for my area, and build my expectation of a trend. This is non-scientific and probably even poor charting ... but the middle weight of the graph matters to me, and the rising bottoms line (if I've got that name right).
I think you'll have to select "3 years" to see what I see:
http://www.orangecountygasprices.com/retail_price_chart.aspx
I think prices are consistent with peak oil, but suggest a gradual tightening.
Quoting from the review, "The authors write that methanol is a convenient, oxygenated liquid hydrocarbon that at present is prepared from fossil-fuel based synthesis gas. Eventually, it will be possible chemically to recycle atmospheric CO2 itself via hrdrogenative conversion to methanol. The required hydrogen will be obtained from water (an inexhaustible resource), using any energy source - atomic or renewable energy. In this way, extremely volatile hydrogen gas will be conveniently and safely stored by converting it, with CO2 into liquid methanol'."
- Limestone (CaCO3) is heated using nuclear or renewable energy (solar concentrators?) to produce lime (CaO) and CO2
- The CO2 is captured and using hydrogen from water plus some more energy is converted to methanol (CH3OH)
- The lime is released to be used in construction as cement, where it recaptures the CO2 it released in the initial step from the atmosphere. Alternatively we can just dump it somewhere until it becomes limestone to be used as input to step 1.
If the input energy is carbon free, this whole process should be carbon neutral except for some initial release of transient carbon until the cycle closes.My biggest problem is the efficiency of step 2. I'm not a chemist but I suppose it will take a lot of energy... Any thoughts?
In your Step 3 you state that 'the lime released to be used in construction as cement, where it recaptures the CO2 it released in the initial step.....'
Well, I don't think that is what happens with cement. Common portland cement is typically roughly 65% CaO, 20% SiO2, 6% Al2O3, and the remainder consisting of various other metallic oxides plus a little sulfur. When cement is mixed with the correct amount of water, a number of highly complex hydration and hydrolysis reactions take place to form the final crystalline solid. This does NOT involve any appreciable amount absorption of CO2 from the atmosphere.
Yes, if you deliberately react CaO with CO2, you will get CaCO3 (limestone), but that is not what takes place when cement hardens.
Check it out.
This leaves me just with leaving the lime in the open air where it will re-carbonize (albeit very slowly). Nevertheless this greatly reduces the practical value of the idea (sigh).
900 deg and 2,500 deg F is what my memory says. It could be wrong.
The reaction rate of CO2 looks to be an issue.
Why not capture CO2 from yeast fermentation? You'd pick up some alcohol vapor too.
Any thoughts?
Over at peakoil.com there was mention of some work done in the 1970's called the sealand process.
Take air - make it liquid, seperate off the CO2.
Take water - split it into H2.
Combine the H2 and CO2 to make Methynol.
Excess product - O2 and N2 (and whatever else you can get.) Small producer...hard to get into the N2 selling market.....what customer base would exist for N2 in some future?
Capital costs - $50-150 K for a stirling air compressor genset. (the one I liked was $66k or so.) $250K for the wind turbine. Storage of the liquid air not calcualted, nor the truck to move N2 to market. spitballed a 42 gal drum a day worth of Methynol. Decided that, while interesting, there are more better plans for fixing sunlight into stored energy...
Best Hopes,
Alan
That would require wood that isn't going to be underwater when global sea levels rise and where termites don't spend time eating the wood.
Just give me your money, and I will solve your problems. Sometime in the future.
Eventually, it will be possible chemically
should be:
Eventually, it may be possible chemically
So is the statement a lie? In a strict sense, yes. But there's so many of these claims, nobody notices or cares anymore, it seems.
Then maybe you should tell them that. They don't seem to be aware of it.
They don't say "will be possible...", because it may turn out that the input energy needed to synthesize methanol may be better suited for another application.
For example: let's say we need 2 joules of solar energy (colected with solar concentrator) to produce 1 joule of methanol energy. These will end up with 0.15 joules to the wheels of the car.
BUT
If better batteries are developed, these 2 joules of solar energy could produce 1 joules of electricity, which will transform to 0.6 joules to the wheels of the car.
So the second process would be 4 times more efficient!
It's poisonous, and AFAICR, carcinogenic.
I know a fair few scientists who say we shouldn't (and won't) touch the stuff as a fuel.
Alan
New regulations are coming, though, to reduce the benzene to almost nothing. Currently it is still in the 1-3% range, but not for long.
I had heard that they put as much benzene as they could and still get decent vapor pressures in Central America. Data a dozen years old.
Alan
Anecdotal evidence: my grandma used it for decades for burning the remains of feathers of chicken before cooking (yeap we do that!). I remember there was some guy in our village that used to drink this staff for years (well diluted with water but...). One day my grandma found her reserve of methanol gone, and of course we knew who was to blame, but whatever... eventually of course he got sick and died, but certainly not from cancer :)
There was a programme on BBC back in May called "What If: The Oil Runs Out".
http://news.bbc.co.uk/1/hi/programmes/if/4989146.stm
Well it is running right this minute on the Discovery Science channel.
It will run again at 3PM, and again tomorrow at 3PM.
http://science.discovery.com/tvlistings/episode.jsp?episode=0&cpi=25299&gid=0&channel=SC I
Oh and a great quote from this article FROM an appraiser....
"I've been blackballed by an entire branch office at a major bank and I'm the bank's appraiser! It has to stop!"...."Every fax has "Don't do this appraisal if you can't make this __ value." Banking has become like selling used cars."
Lastly a sobering reality that they realize is coming....
I seek to teach anyone I can.
Online comics have made a big break, and this is from a gaming comic a friend told me about.
http://archive.gamespy.com/comics/nodwick/ffn/ffn125.htm
Just what we need them to actually come out and talk about the end of times in the comics. I feel so secure now with all the SCA folks running around.
No problems for the UK then with producing food, saving the environment and keeping the trucks rolling.
I just have this nagging feeling though that the folks who would have eaten that exported wheat may just get a bit pissed off and resentful - especially since their electricity may also be switched off.
UK agriculture is completely sustainable as is, 'without damage to the environment'? It would be helpful to see him define 'sustainable'. It means no fertilizer, pesticides etc., last time I looked, at the very minimum.
I doubt that this is the case though.
Higher food prices will alleviate starvation?!That is nothing less than grotesque.
Solving world hunger by driving more. Wow.
Also interesting is that that geologists are blaming the gas drilling, and the lack of a casing, for the problem...
Venezuela auto sales surge 90 percent in September
Doesn't sound that bad to me ... I like rural lifestyles.
Come on guys, off to the dealer! You're hurting the economy.
Nobody need have any worries: nothing will happen. The Tories have taken 8 months to come up with what amounts to nada, after 8 years of Liberal government had had the exact same outcome. The words 'green' and 'sustainable' will be repeated over and over, but that's it. If there's any new obligations, either for carmakers, or for oilsands producers, the timeframe will be 2050 or thereabouts, a safe date to indicate 'way off into the future'.
Canada in spring was 24% over its 1990 emissions, instead of 6% under, as Kyoto obliges it to be in 2012. Yesterday, Environment minister Rona Ambrose appeared in Parliament to 'explain'. Towards the end of that session, she was asked outright by one member why she had bothered to show up at all; she had nothing to say.
In reality, while pointing fingers at politicians is a favorite hobby, and they do so amongst themselves non-stop, it is the voters that are to blame. Polls show Canadians, certainly in the East, like Québec, to be 80-90% in favor of Kyoto. But if someone would propose measures that are required to meet Kyoto, like getting people out of their cars, and shutting down the oilsands, they would never be elected, be it at federal, provincial, or municipal level.
A few days ago, the leader of Canada's Green Party managed to blurt out that the proposals in its green plan would not have to lead to a 'change in driving habits'. Yes, these people are disingenuous, stupid or both. Qualities you'd think are not good for 'leaders', but which are, on second thought, exactly what you'd expect from them.
Still, who put them where they are?
If the permafrost melts, things may not be so comfortable, but in general due to its location, wealth and natural resources, Canada is one of the few countries that is a beneficiary of global warming:
- longer growing seasons, further north
- warmer winters, less heating needed, less snow
- world wants/needs Canadian oil, timber resources
(there are issues about storms, drought etc. but that will only become clear later).Speaking as a Canadian, threats to the national standard of living are not taken well, particularly not making sacrifices for {insert words here from following list}
[rich bitch Albertan oil magnates/ Quebeckers/ eastern bastards/ fat cats in Ontario/ fat cats on Bay Street/ city slickers in Toronto/ Newfies on our pogey/ hippies in British Columbia/ Americans/ foreigners/ immigrants who come here to get welfare].
;-).
Why the fishing off Peru, droughts in SE Asia, and the phase of the Southern Oscillation matter. This study doesn't even include Katrina!
We all know what Dennis did to Thunderhorse and what Katrina did to gas prices.
How sea surface temperatures this week compare to climatology
How sea surface temperatures a year ago this week compare to climatology
The physical connection isn't terribly robust (it involves upper level shear) but the statistical correlation is quite good.
Two things I spot:
- a big El Nino event building now
- just look at those warm waters in the North Sea and the North Atlantic - Norwegian Sea
We have had amazing warm weather here in Aberdeen.A few weeks back Nate showed a 12 month mosaic of surafce temp anaomalies - is this stuff easy to find?
- We'll see how it turns out. Last year it looked like a big La Nina forming, but it never got to more than middling and petered out before the year ended.
- That's troubling. Practically any time of year for the last few years this has shown up, and is symptomatic of Arctic seas warming.
These are easy to find: try a search for SST anomaly on your favorite engine -- you should get quite a few hits.Of course we almost had the hottest day ever recorded in August.
And we had a month's worth of rain in one weekend (last weekend). Which is much appreciated because the last 18 months have been as dry as any comparable period since 1920-- groundwater was at 30% of normal levels.
Curing oil sands fever
Actually, right now they are not even able to fully offset the decline in conventional, even equating one bpd of oil from tar sands to one bpd of oil from conventional sources.
Its on my list of things I think the new UK energy institute should look at.
http://www.aspoitalia.net/images/stories/aspo5presentations/Hall_ASPO5.pdf
We have been working under the assumption that the after peak decline curve will follow a gaussian bell (at least that was the best fit for the US decline that I remember Stuart doing).
However, if this EROEI finding is true, that EROEI is in decline - then we will see the oil volume and quality drop together. This will yield a much more drastic drop in net energy.
And then factor in the export land model and we oil importers could be in serious pain. Not only do we lose because of growth, but we will lose because they will be keeping more oil to meet the same energy demand.
It would be worth trying to quantify this somehow.
It means that the approach of Peak Oil will make climate change, and other pollution issues, much worse. Of course we are already way into that process, the EROEI for oil has dropped dramatically over the 20th century, while production (and consumption) has increased just as dramatically.
You have to try to produce ever more energy (growth economy) with a sinking EROEI, in other words: to make a little more energy, you have to use MUCH more.
And since energy use produces waste....
It's a game that can only be lost.
You can understand Canadian schizophrenia re Kyoto when you read that article, especially the data at the bottom.
Only 2 sources of CO2 are outside the West, and both of them the Ontario Government is planning to phase out (Nanticoke and Lambton GS).
Of course, Ontario has the most people and the most drivers, but the issue is less obvious ;-).
CANADA'S TOP 10 SOURCES OF C02
Emitters producing more than 100,000 tonnes of greenhouse gas a year are required to report emissions to Environment Canada. The most recent figures, expressed as CO2e, for carbon dioxide equivalents, are from 2004.
- Sundance Generating Plant, Transalta Utilities Corporation, Alberta: 16,463,579 tonnes of CO2e
- Nanticoke Generating Station, Ontario Power Generation: 14,715,952 tonnes of CO2e
- Syncrude Canada Ltd., Mildred Lake and Aurora North Plant Sites, Fort McMurray, Alta.: 10,367,463 tonnes of CO2e
- Suncor Energy Inc. Oil Sands, Fort McMurray, Alta.: 8,599,254 tonnes of CO2e
- Lambton Generating Station Ontario Power Generation: 7,208,141 tonnes of CO2e
- Genese Thermal Generating station. EPCOR Generation Inc., Alberta: 6,792,442 tonnes of CO2e
- Sheerness Generating Station, Alberta Power (2000) Ltd. Hanna: 6,639,621 tonnes of CO2e
- Boundary Dam Power Station Saskatchewan Power Corporation Estevan: 6,570,850 tonnes of CO2e
- Keephills Generating Plants, Transalta Utilities Corporation, Alberta: 6,032,213.460 tonnes of CO2e
- Battle River Generating Station. Alberta Power (2000) Ltd., Forestburg: 5,185,674 tonnes of CO2e
The top emitter in British Columbia: Fort Nelson Gas Plant Duke Energy Gas Transmission, Fort Nelson: 1,898,625 tonnes of CO2eColumn 1 API Gravity of Petroleum at 60 deg. F
Column 2 Lbs per Gal
Column 3 Lbs per Brl
Column 4 Brl's per Ton
As you can see low API gravity is heavy crude, high API gravity is light crude. A ton of light crude has considerably more volume than heavy crude. Also light crude is that crude with API gravity above about 31.
10 8.34 350.15 5.71
20 7.79 327.05 6.12
30 7.31 306.81 6.52
40 6.88 288.92 6.92
50 6.50 273.00 7.33
60 6.16 258.72 7.73
70 5.86 245.91 8.13
80 5.58 234.28 8.54
The below data displays increasing API gravity petroleum in high heat Btu's at constant volume for gallons and barrels, and Btu's at constant weight for tons.
Column 1 API Gravity
Column 2 Btu's per Gal
Column 3 Btu's per Brl
Column 4 Btu's per Ton
10 154,600 6,493,200 37,087,681
20 148,100 6,220,200 38,037,755
30 141,800 5,955,600 38,822,724
40 135,800 5,703,600 39,482,483
50 130,100 5,464,200 40,030,769
60 124,800 5,241,600 40,519,481
70 119,800 5,031,600 40,922,289
80 115,100 4,834,200 41,269,272
As you can see heavy crude, low API gravity, has more energy by volume but less energy by weight. So diesel with an API gravity of about 35 has more energy by volume than gasoline with an API greater than 60, but less energy per ton. Also Light crude requires less energy to refine than heavy crude, therefore there is a smaller difference in the available energy acquired from different grades of crude when sold by the barrel, and a greater difference in the amount of energy acquired from different grades when sold by weight or ton. Years ago the producers had a better handle on what they could expect for a price no matter the API gravity of the crude.
Notice col 4 × col 2 ÷ col 3 ≈ 1 million or less. Beats me what that means.
"American Idiot"
"Jesus of Suburbia"
I. "Jesus of Suburbia"
II. "City of the Damned"
III. "I Don't Care"
IV. "Dearly Beloved"
V. "Tales of Another Broken Home"
"Holiday"
"Boulevard of Broken Dreams"
"Are We The Waiting"
"St. Jimmy"
"Give Me Novacaine"
"She's a Rebel"
"Extraordinary Girl"
"Letterbomb"
"Wake Me Up When September Ends"
"Homecoming"
I. "The Death of St. Jimmy"
II. "East 12th St."
III. "Nobody Likes You" (Mike Dirnt/Green Day)
IV. "Rock and Roll Girlfriend" (Tré Cool/Green Day)
V. "We're Coming Home Again"
"Whatsername"
'the holy scriptures of the shopping mall' indeed.
"Wake Me Up When September Ends" has always had special meaning to me...I visited NYC in October 2001 to check on sister-in-law attending NYU. When I went to Ground Zero...the ruins were still smoldering, ash/dust covered the nearby buildings, the Trinity church sat there unaffected, and the streets were littered with makeshift memorials. The song hits that feeling I had on that trip very well...numb...wake me up when this is all over.
Dar Williams We Can Play The Greed
finally learned that the market's righteous holler
Comes from a pale face on a paper dollar
And I betcha got few bucks in your hemp wallet
So throw a tiny wrench in the fiber optic wires
Morals are cheap and you can be the buyers
We can let 'em poison and perish foreign lands
Or we can play the greed right into our hands
Everybody says it can't happen here
Everybody says it can't happen here
Things'll turn around just as sure as they said it
Hell, things change and they all take credit
So ask why there's only forty songs on a station
And ask your cafe about their coffee's plantation
And why is it Arizona hasn't gone solar?
And tell your print shop that hemp grows faster
And it doesn't mean a back room clear cut disaster
The market doesn't care but it wants to understand
And you can play the greed right into your hands
Smiling man says it can't happen here
Channel 4 says it can't happen here
Things'll turn around just as sure as they said it
Hell, the change comes and they all take credit
So roll up your pennies and do your battle
The chairman will start quoting Chief Seattle and
Put little tree frogs on their letterhead
'Cause the market resists and the market absorbs
With a five-pointed leaf on the cover of Forbes
The very same people turned valleys to dams
These are the ones that drain prairies to sand
And they'd just as soon you didn't know this land is your land
But we can play the world back into our hands
Malcom's gonna say it can't happen here
Rupert's gonna say it can't happen here
Things'll turn around just as sure as they said it
Hell, things change and they'll always take the credit
Hell the change comes
Let's let 'em take the credit
"You know where you are? You're in the jungle, baby. You're gonna die."
Wake Up! - Rage Against the Machine
If we keep on like we doing things for sure
Will not be cool - It's a fact
We just ain't got suffiecient fuel
...There's no excuse for our abuse
No excuse for our abuse
We just assume that we will not
Exceed the oil supply
But soon enough the world will watch the wells run dry.
See also:
http://www.newcitychicago.com/chicago/5631.html
http://blog.wfmu.org/freeform/2006/05/songs_of_bygone.html
Then there's this, but I can't get the comments to show.
http://www.theoildrum.com/classic/2005/05/because-we-all-need-little-music-in.html
extracted from link in header.
The year-old Westcor Pty Ltd was formed under Sapp's auspices to develop the Westcor project, which is intended to exploit the DRC's environment-friendly, renewable and hydroelectric Inga. The DRC's power utility, Snel, owns and operates the two existing Inga power stations, Inga One and Inga Two, which have a combined output of 1 770 MW. The proposed next phase of the development, Inga Three, has a rated out-put of 3 500 MW to4 000 MW and the final Inga phase, Grand Inga, a rated output of 39 000 MW. Westcor is developing Inga Three and will also operate a high-voltage transmission line from the DRC to Southern Africa, which will include a fibre-optic telecommunications network. Former DRC electricity utility executive Jean Lokala has been appointed Westcor COO.
Medium-term to long-term generation projects to supply power to the SADC region, including the Western Power Corridor Project (Westcor), which is expected to move some 4 000 MW of power from Inga Three, in the DRC, to Southern Africa and to pick up 6 500 MW of generation at Kwanza river, in Angola.
----------
BTW, Inga is formed where the Congo River falls off the Central African Plateau. Probably a magnificant waterfall MANY years ago, now a mass of rapids. The Inga dams are built in the midst or foot of the rapids and direct water through turbines and tunnels to the lowland river below.
A bit like Niagara Falls if European Settlement had waited a few thousand years, long enough for the falls to become rapids.
SWEET SPOT, 1970, OR HOW I LEARNED THAT CHEAP DON'T MEAN EASY
We must compare oil to the cost of other items and dollar inflation, not to it's own controlled/cartel history. I have said it before, if oil at $60 a barrel is considered "expensive", I will take that "expensive oil right on out to the end of natural days, and happily! Anyway, how about something to read?
Here goes:
First, let's look at some wild gyrations.
http://www.wtrg.com/oil_graphs/oilprice1947.gif
http://www.wtrg.com/oil_graphs/crudeoilprice01_05.gif
If we compare the price of crude now compared to the price of crude in any period post the wild superspike of 1981, it is certainly high in price at $60 compared to it's history. But that does not tell the whole tale. What about the price compared to inflation across the board
We must recall that dollar cost inflation means that average inflation has reduced 59.00 purchasing power to $31.00 purchasing power from the early 1980's across the board.
And sure enough, that's not far off the spread in price from the early 1980's to the current (post the recent superspike to almost $80) of today. So compared to inflation at large, oil at $60 is really pretty close to right. And we must recall that compared to certain other high inflation catagories, oil price inflation averaged from 1983 or so to now is not bad at all. Think of the inflation in housing, medical costs, university education, and stock market prices in that period, and you will see one of the biggest expansions, but also inflations, in history.
Comparing the post 1970's price to the pre 1970's price is of couse useless and a case of card stacking that tells us only one thing. Something BIG happened in the 1970's:
For a long range picture we get
http://en.wikipedia.org/wiki/Image:Oil_Prices_1861_2006.jpg
Here's where it get's interesting. Crude oil in 1947-48 suffered a bit of a spike as part of the post war prosperity and boom caused by the returned troops and birth of the baby boom...but then....crude oil prices declined from 1947 to 1971 overall by almost half in inflation adjusted dollars! It's an incredible thing to see, during the whole of the growth of the baby boomer growing to adulthood, the muscle cars, the housing boom of the postwar years, from "I Love Lucy" right through "Leave It To Beaver" to "The Mod Squad" and Kent State killings, the nominal price stayed flat, and the inflation adjusted rate fell in half!!
How could that be? Of course we know, as Westexas often reminds us...there was a cartel in control: The Texas Railroad Commision set the price, and it STAYED PUT, because they had control of almost all American oil. It was a great period to drive!
And then....the U.S. Peak. The United States lost it's control of it's own oil and energy destiny. Nothing has been the same since. The prices since the U.S. peak have been all over the place, reflecting every rumor, political tussle, and burp of the unstable regimes we are forced to rely on. The oil price since the U.S. Peak have in no way reflected "inflation" in the conventional sense, controlled by another cartel. Just as the Texas Railroad Commision could resist inflation and hold prices at givaway before 1971, OPEC can control prices, and resist inflation the other direction since, at least as long as they have the "excess supply" to do so. How long that will last is the question for the world to face now.
The crisis everyone seems to fear now is only the most recent little "fire" in the real crisis, the one that began in 1971 and has never truly ended to this day, the real "Long Emergency". Does it tell us a damm thing about "geological" oil supply" around the world? Nope. It just tells us that are fate is in the hands of others, and that we are running blind, relient on every rumor and tall tale that comes down the pike. The one "geological" event that matters to us is already behind us, the one that Hubbert called, that Westexas references, in 1971. The "peak" that mattered to us is long behind us.
Whether the world peaks next month or in 2050, are fate is still the same: We are being bled to death.
There is one peak potentially upon us that does matter and does change things: The North American natural gas peak we discussed on TOD recently. Because when it takes full effect, as the the crude peak of 1971 did, and we go over to "global" gas the way we have already had to go to "global" oil, or fate will be the same as it has been since 1971, only doubly so. Is it possible to be bled to death twice?
There is one more fact on the Wekipediia graph to take notice of, and it is ominous in the worst way: Note that just as U.S. production was about to peak, almost within months, the price of oil fell to it's all time historic low, a low only matched twice before....at the moment of the birth of the oil industry, and at the depth of the great depression in 1931.
Months before the United States peaked in oil production for good, the price was as cheap as IT HAD EVER BEEN. THERE WAS NO WARNING. Except for that one great geologist, M. King Hubbert, and the tiny group who believed him, we could not know it then, but WE WERE RUNNING COMPLETELY BLIND. It is the greatest testimony to the man, and the theory that can be shown, and what keeps us studying and reading the words of his students and disciples.
Roger Conner known to you as ThatsItImout
That is an excellent history lesson and explanation of what has happened. I like, and study history, so I look for patterns and clues about the time I live in based on past events. I see what you see. This incredibly powerful link between energy supply and our ability to run society. And almost no one believes this link exists.
So even when there is data pointing to another step change in energy supply, no one cares because they are not (in their minds) dependant on energy. How do I know they believe this? The Federal reserves keeps telling them that. My whole adult life the FED keeps saying the U.S. is less dependant on energy than ever before. Our economy is not like the 1970's, or even the 1990's. Our GDP is 10X the 1970's (or some such number) but we use less energy. Therefore energy does not underpin or economy. I don't believe them, but I think most U.S. citizens do.
We need something that shows the connection. Something as clear as Rodgers graph showing the prices far above normal.
You will fail in trying to show anything but a most deminimus of connections.
The only thing needed for an "economy" is that two humans are able to signal each other regarding their transactions. Energy needed for signalling one another is very small, close to zero.
Let's make it more concrete by way of an example:
Suppose you and I agree that if I send you a new Haiku poem you will pay me 5 cents for each such poem and if you send a new 5 minute musical score, I will pay you 5 cents for each such score.
We set up computers that talk to each other over a low cost, high bandwidth link. My computer automatically generates "poems" and sends them to yours. Your computer credits me 5 cent for every poem that is new and qualifies as a Haiku.
Same going the other way. My computer credits your account 5 cents for every musical score.
Thus we have a vibrant "economy". I am servicing you with Haiku's and you are servicing me with musical scores and we are both becoming fabulously "wealthy".
The only energy consumed by such an "economy" is that of running the computers and signalling back and forth. Thanks to modern technology all that can be made to happen at very low energy levels.
So there is really no major connection between a vibrant economy and energy consumption.
The only thing that grows a real economy is inputs in energy and/or raw materials. Some of that energy might be used to create and store information, such as a poem. This information only represents added value if it itself facilitates the above inputs, either directly (a poem describing where to find oil, perhaps) or indirectly (something that makes people happy reading it so that they work harder). A computer-generated poem would have a value (its information content) worth less than the energy used to create and store it, regardless of how much the other computer decides to pay for it.
A common delusion is to believe that a low energy "service" economy actually exists. While processes can be made more efficient, the reality is that the biggest reason for the US becoming less energy intensive (measured against GNP) is that we have outsourced our manufacturing to China and that we are paying for it by leveraging everything in sight. This "economy" can't exist independently of someone else doing the heavy lifting, and will certainly collapse when the global energy supply does.
Delusional. said,
"Damn Rodger, you make me feel all warm and fuzzy being a pesimist."
To which I say, kind of ironic given that I am regarded here, and regard myself as somethng of an optimist! :-)
But as Congressman Roscoe Bartlett said, when he was asked how a Republican could be a "peak oiler",
"Just because I am a Republican does not require I be a complete idiot."
So it is with being an optimist. Just because I am an optimist does not require I be completely blind.
Even an optiimist can see real danger on the horizon, but feels that humans can manage it if they make the effort. My argument remains the same:
I am as deeply, DEEPLY worried about the complete blindness we are running in as I am about Peak itself. We have seen that the "price" signal offers no forward warning. We have seen that low prices, fantastically low prices in fact, can exist only weeks before the storm hits. We have seen that even though the world may not collapse, loss of control over fundamental sources of our prosperity can erode our position and the prosperity of a nation.
So your saying, boy that don't sound much like an optimist! But the worst case scenarios, I feel, can be averted with advance planning. But planning relies on information. If no information is valid, then we must plan on that basis, in a contigency type scenario that accepts almost any possible scenario (imagine if the investment funds that got wiped out in the recent natural gas price crash had believed for even a minute that a price crash, SOON, was a possible scenario? As unlikely as it seemed, they may have been betterr prepared for that unlikely scenario).
Do I think we ca pull it off, and make it out of this period in even better shape? Helll yes, as just said, any scenario is possible....and besides, even if we can't, it will be fun trying! :-)
Roger Conner known to you as ThatsItImout
I think this article by Zachary Nowak on EnergyBulletin should be required reading. Speed, Severity, and Duration are vital concepts to be added to the Peakoil discussion IMO.
Bob Shaw in Phx,Az Are Humans Smarter than Yeast?
Excellent essay but it's late in the day for discussion. Why don't you repost it on tomorrow's Drum Beat?
Todd: a Realist
I remember you believing in fast crash-speaking of speed- I have never read your thinking as to why?
I tend to be there too; due to converging , complex pbs. and fixes that are energy intensive and not available. I may be underestimating the 'slack in the system'; mostly in terms of timing - I think. Hope to see your thoughts soon- tomorrow or some day. Thanks.
"this article by Zachary Nowak..."
Oh yeah, repost it, I just read it, you have to know I want a crack at this one! :-)
Roger Conner known to you as ThatsItImout
This link talks about widespread ecosystem devastation as a diamond rush is on in Zimbabwe. Even schoolkids and their teachers have abandoned classrooms to dig and pan for stones. The irony arises from all the links on the webpage that connect you to jewelry outlets. Just more evidence of decline.
Bob Shaw in Phx,Az Are Humans Smarter than Yeast?
"Oil Sands project proving tough to develop"
wow, CNN actually takes a realistic look at Oil Sands.
It seems to me that this is an extremely important issue, since if you are right, it would make the addition of tar-sands reserves to conventional reserves not entirely unreasonable. And it might offer a long-term way of significantly mitigating the liquid fuels decline post-peak.
According to Youngquist (1997) it currently takes more energy
to mine oil sands than the amount of energy recovered. In other
words, oil sands are already "depleted".
(Youngquist published Geodestinities in '97)
Heinberg The end of the oil age, 2004
Geologist Walter Youngquist notes "it takes the equivalent of two out of each three barrels of oil recovered to pay for all the energy and other costs involved in getting the oil from the oil sands.
(While 'all other costs' is somewhat vague, 8:1 is not in these cards)
It would be nice to figure this one out. Industry numbers don't ususally make for very useful reference.
http://www.theoildrum.com/story/2006/6/19/1571/97105#18
Someone else said Suncor had also claimed 8/1 after I did the rough calculation.
- That natural gas represents the lion's share of needed energy input for the process itself; this is questionable since my impression is that the necessary infrastructure costs per barrel obtained are much higher than for conventional oil; plus there are other mining and mechanical processing costs for each EACH ADDITIONAL BARREL OBTAINED that cannot be negligible.
- Is it really fair to leave environmental remediation energy costs out of the picture? I would argue no; this has to be considered part of the energy cost of the process.
I suppose another way of stating the question would be this: How exactly do you think that advocates of something like a 3:2 EROEI are exaggerating their position?Phil,
I don't know that they are, but there just isn't much data out there. My back of the envelope was merely to more or less put some boundaries on the calculation. I just don't know what else needs to be thrown in there, or how much it might contribute. But note the poster who said Suncor claims 8/1.
I am not advocating tar sands, because I think there are serious environmental issues, regardless of the EROEI. The reason I did that calculation is that it was very difficult for me to understand why all this money is flowing that direction, if the EROEI is only 1.5. I suspect, based on some of the numbers I have seen, that it is quite a bit better than that (bad news for the environment).
Interesting article on how the immigration crackdown is making an increasing percentage of the crops left to rot in the fields:
--------------------
Farmers of all types of specialty crops, from almonds to roses, have seen the immigrant labor supply they depend on dry up over the past year. Increased border security and competition from other industries are driving migrant laborers out of the fields, farmers say.
"But agriculture is the warning sign, if you will, of structural changes in the economy."
Critics say increased wages would keep workers in the fields. Growers contend that their wages, often minimum wage plus a piece rate, are as high as they can pay and still remain profitable. Ricchiuti echoed many growers when he said local people "don't want to do the work at any price."
Food growers and advocates for the growers say that the worker shortage is reaching crisis proportions: They offered these examples:
*As much as 30 percent of the year's pear crop was lost in Northern California, growers estimate.
*More than one-third of Florida's Valencia orange crop went unharvested, Regelbrugge said.
*Apples in New York are rotting on the trees, because workers who once picked the fruit have fled frequent raids by Immigration and Customs Enforcement agents, said Maureen Marshall, an apple grower in Elba. Michael Keegan, a spokesman for the federal agency, said he could not confirm any specific targets for raids.
--------------------------------------
So the question is: will people start rioting when food shortages become evident, or will the college graduates help harvest the crops? We need to get started soon on moving 60-75% of the workforce to relocalized permaculture to help prevent future violence.
Bob Shaw in Phx,Az Are Humans Smarter than Yeast?
Growers contentions may be true at current prices. But if this is truly a crisis, prices will go way up. That will change the equation. How do we know that people won't work at any price? Have we tried offering "any price". As a college student, I used to do things as onerous at picking crops for close to minimum wage. If you had offered me double minimum wage, I would have jumped on it. What has changed?