| Econbrowser: MC on gas taxes and the president's plan... | The Oil Drum | What the right hand giveth . . . . |
Living in the Eemian
Posted by Stuart Staniford on February 20, 2006 - 4:44pm
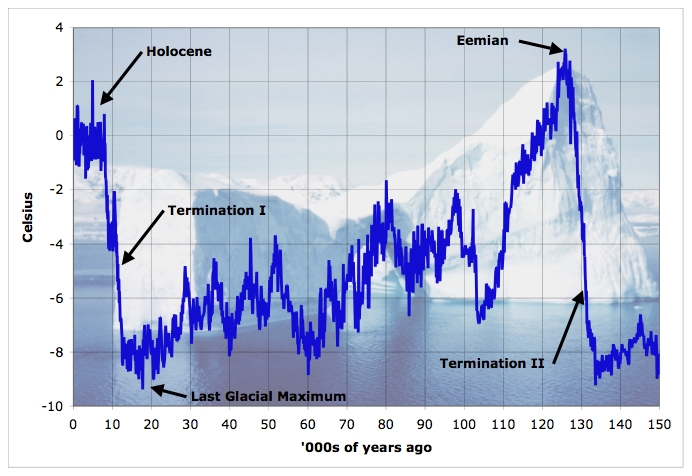
Temperature anomaly relative to present over last 150,000 years estimated from Vostok ice core deuterium measurements. Caution: oldest data is on the right. Click to enlarge. Source: NOAA.
In the more distant past, we have also talked about and today we return to the issue of sea level rise. Sea level rise is a slower-fuse issue than I have come to believe the hurricanes are, but in the long term it is potentially more broadly devastating, and the latest evidence suggest that, again, we cannot safely assume that this is strictly a problem for our grandchildren.
To orient ourselves, let's start by looking at recent climatological history. Over the last three million or so years, the planet has been going in and out of glaciations that are almost certainly controlled by changes in the seasonal distribution of sunlight due to slow changes in earth's orbit and rotation (a hyphothesis originally due to Serbian astronomer Milutin Milankovitch). If we focus just on the last cycle, we get this next graph (which also led off the piece). This is temperature at the Russian Vostok base in Antarctica as estimated from isotope ratio fluctuations in ice cores (a pretty well established method of estimating temperature at this point).
Temperature anomaly relative to present over last 150,000 years estimated from Vostok ice core deuterium measurements. Caution: oldest data is on the right. Click to enlarge. Source: NOAA.
I have labeled major features of the curve. The flattish period on the left for the last 9000 years or so is called the Holocene. Agriculture was invented for the first time pretty much at the beginning of the Holocene, so the entire history of civilization fits in that period (it runs a little earlier in the Northern hemisphere). All human (or pre-human) existence prior to that, as far as anyone can tell, involved tribal hunter-gatherer living. (My personal assumption would be that, given the felicity and frequency with which humans have invented agriculture and cities in the Holocene, cognitively fully modern humans cannot have existed in prior interglacials or there would have been civilization then too).
Anyway, working backwards in time, prior to the Holocene is a rapid rise in temperature as the ice sheets over North America, northern Eurasia, and Antarctica all melted (with a short interruption along the way). That's known as Termination I.
Before that is the last glacial maximum - the maximum extent of the glaciers, which occurs between 15000 and 20000 years ago. At least in Antarctica, the last glacial maximum was about 8 oC colder than today (that's around 13 oF).
As we go deeper into the ice than that, we find a long period of gradually lowering temperatures. It appears that ice sheets form slowly, but collapse quickly - this pattern appears to be fairly typical in the available record (see, for example, the full 600k+ year record at Vostok). Eventually, we get back to the Eemian, which is the peak in temperature towards the right of my graph, about 125,000 years ago. The Eemian was the last warm interglacial period before the Holocene. Before that, we have Termination II, which was the deglaciation period leading up the Eemian.
To get a better feel for the temperature history in the Eemian, I have moved 15,000 years of it forward by 121000 years and superimposed it on top of the Holocene temperature history.
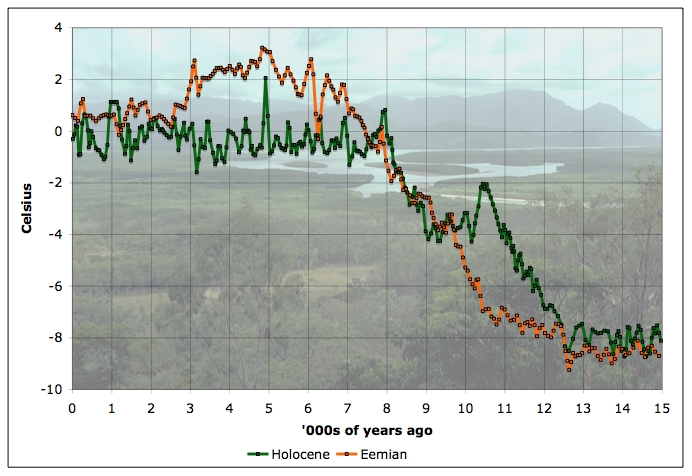
Temperature anomaly relative to present over last 15,000 years (Holocene curve), together with temperature from 121,000 to 136,000 years ago, shifted over 121,000 years (Eemian curve). Estimated from Vostok ice core deuterium measurements. Caution: oldest data is on the right. Click to enlarge. Source: NOAA.
As you can see, the speed with which the temperature rose during Terminations I and II was around about the same. The Eemian got somewhat warmer, but that warmest interval was shorter than the Holocene. Also, the deglaciation going up to the Eemian (Termination II) lacked quite such a prominent setback along the way as Termination I has (though there is a small notch even in Termination II). This suggests a picture in which there is some scope for the planet to deglaciate in slightly different ways on different occasions, even though the overarching process generally went at the same rate.
If we now look just at the last 8000 years, and the corresponding period in the Eemian (ie with the end of the deglaciation lined up - the 121,000 year offset) we get:
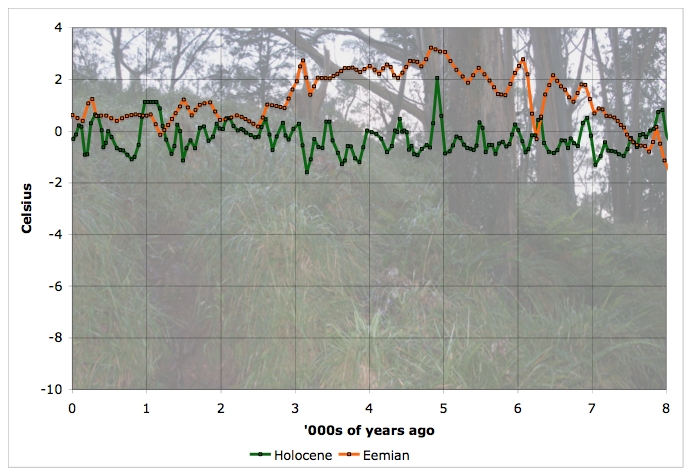
Temperature anomaly relative to present from now to eight thousand years ago, together with corresponding Eemian period (shifted 121,000 years). Caution: oldest data is on the right. Click to enlarge. Source: NOAA.
Clearly, at least in Antarctica, the Eemian was about 2 oC warmer for a few thousand years, and then as it start to cool, it reached temperatures similar to the Holocene. There's some uncertainty about how global temperatures relate to Antarctic temperatures. The Wikipedia's estimate of about 3 oC is at the top end of the range of estimates I've seen in the literature which go from 1 oC to 3 oC. Let's use 3 oC to be a little conservative.
Note that 3 oC over pre-industrial holocene climate is in the middle of the range for what climate models anticipate the temperature would be by 2100. We've had about 0.6 oC of warming from pre-industrial temperatures so far. So, in this period when temperatures were somewhat warmer, and then similar to holocene temperatures, how was the sea level?
Well, at least three meters, and probably more than five meters higher than today. Ie at least 10 feet, and probably more than 16 feet. This comes from a variety of evidence: the Baltic Sea was significantly bigger, that kind of thing. So that rather suggests we would be headed for a situation with inconveniently high sea level compared to what we are used to (though the rate of change is a big question mark - we'll get to that in a bit).
First, to get a slightly broader overview of the history, let me borrow this figure from a Science paper by Gallup et al, 2002. It's a bit of a complicated figure, but hold on and I'll do my best to make sense of it. If you have the means, you might want to click and get a larger version in a new window (or a printout) to follow along the discussion.
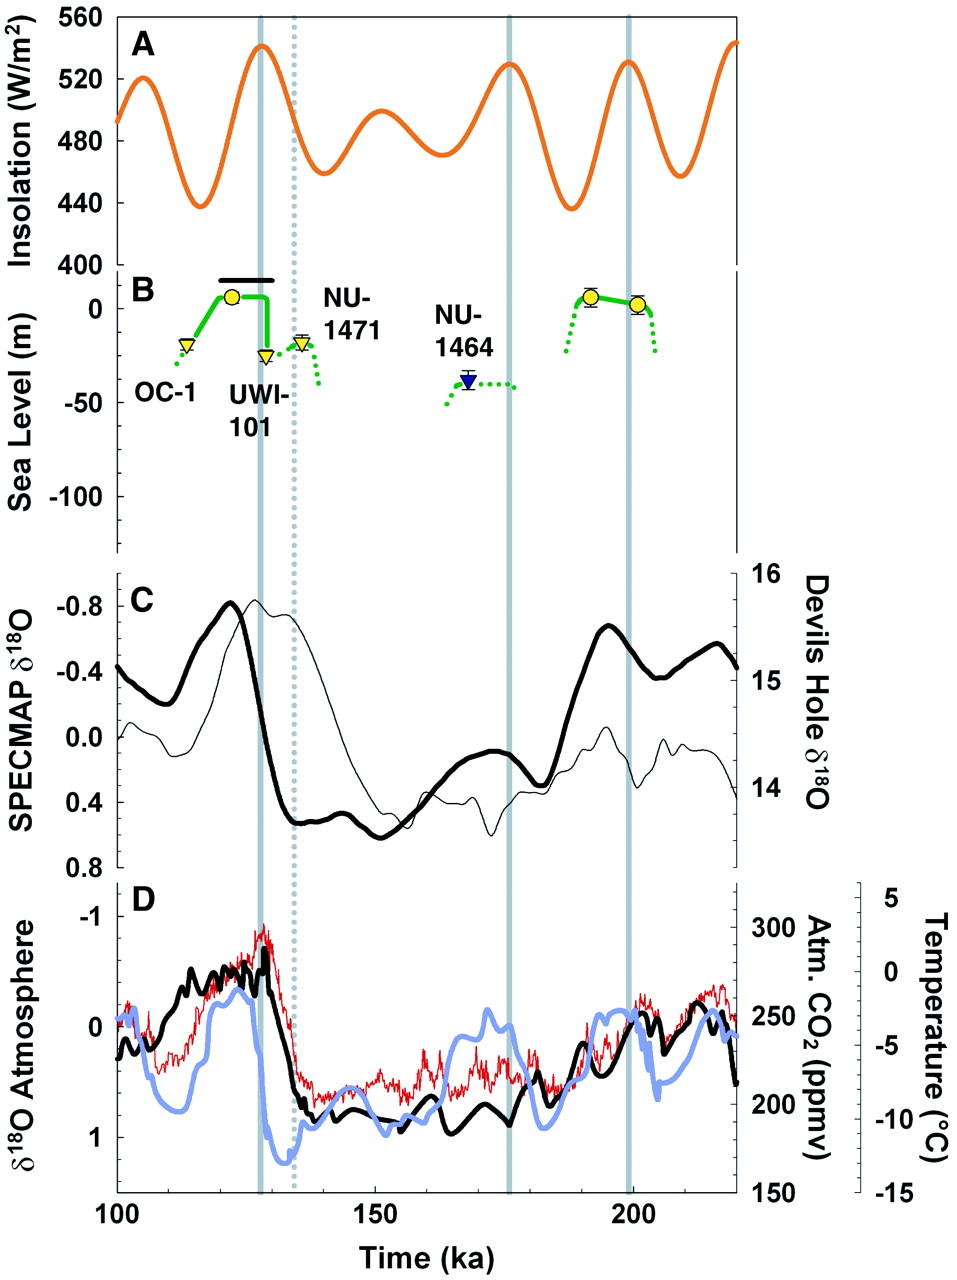
Source: This is Fig 2 of Gallup et al, 2002, available with a free registration. Click to get a large version in a new window.
Firstly, the timeframe is from 100,000 years ago to 220,000 years ago. So this covers the Eemian interglacial (which is around 130,000 years ago, and most of the glaciation prior to the Eemian. Older times are to the right of the picture. Let's start with the top (orange) curve. That's the amount of solar insolation at 65 oN latitude.
The general idea of the Milankovitch theory is that while these orbital twitches and gyrations do not change the total amount of sunlight very much, they do change the latitude and seasonal distribution of it. The thought is that it is the summer northern hemisphere sunlight that is critical in controlling things. The Northern hemisphere is more important than the Southern hemisphere because there's a lot more land there, so there's a lot more potential to build big ice sheets (and suck up all the water so the sea level drops - at the last glacial maximum there was several miles thick of ice over much of northern North America and Eurasia and sea level was around 120m -- 400 feet -- lower). The summer sunlight is important because an ice sheet can only form in a place where it is cold enough in the summer that at least some of last winter's snow stays throughout the summer. As long as that is true, the ice sheet can build and build. If that is not true, it doesn't matter how much snow fell in the winter or how cold it is then -- the summer will reset the snow level to zero every year. So northern hemisphere sunlight basically controls the extent of the major ice sheets in a glaciation, which in turn control everything else (via albedo feedbacks and a not-fully settled feedback into the CO2 level).
So that's the most basic version of the Milankuvitch theory - which is a bit too simple to fully explain the observations but probably captures most of what's going on and the paleoclimatologists seem to be still trying to sort out the rest. Anyway, back to the graph. The top orange curve is the average solar insolation at 65 oN in W/m2 which comes from orbital calculations. As you can see, the forcing variations at that latitude really are quite significant - the range is around 10% of the total.
Now, Gallup et al have drawn three vertical grey lines through the peaks in the 65 oN insolation (which ought to be periods of higher temperature, lower glaciation, and higher sea level. Follow those all the way down to the bottom. That's Vostok data (same stuff we were looking at above). The red curve is temperature, and the blue curve is CO2. You can see that they roughly follow the insolation signal, with CO2 being closer than the temperature (probably because CO2 is globally well mixed and appears to have been in a fairly strong mutual feedback loop with global temperature -- until we started messing with it anyway -- but Antarctic temperature has some degree of regional peculiarity).
Now the sea level data prior to the Eemian are a bit sketchy, but let's quickly cover it. The three black curves are different observations of the concentration of oxygen-18 in marine sediments (in the third picture down - C), and in the atmosphere at Vostok (bottom graph). The idea here is that oxygen-18 is a heavy, rare, isotope of Oxygen (it has two extra neutrons in the nucleus relative to the usual kind of oxygen which is oxygen-16). Those heavy oxygens are a little more prone than the light oxygens to be in the ocean rather than the atmosphere - they have a harder time evaporating because they are heavier. When a lot of the ocean evaporates and falls as snow in an ice sheet, the left-behind ocean gets heavier in oxygen-18. That gets incorporated into shells of creatures, who then get found and measured by paleoclimatologists. So that signal is a proxy for sea-level and glaciation. You can see that the black curves approximately follow the glaciation, deglaciation story, but there are significant discrepancies in detail that are in need of settling. Finally, in the second graph down there are some sea level measurements that come from dating corals that grow at known depths in the ocean. The record is quite sketchy but is in rough agreement with rest of the picture.
Anyway, returning to the question of why the Eemian had higher sea level than we do today. There are basically two main candidates for this sea level rise. One is the Greenland ice sheet could have been smaller, and the other is the Antarctic ice sheets could have been smaller. As far as I've been able to determine, the paleoclimatologists have not settled how much of one and how much of the other they think occurred. We talked about Greenland, and although I will have a little more to say on that subject at the end, I am going to turn to Antarctica for a while.
To that end, let me steal a few slides from an excellent overview presentation by Professor Chris Rapley of the British Antarctic Survey. This first picture shows the main important regions of Antarctica from a sea level perspective, and how much they would contribute to sea level if they all melted. SLE is "Sea Level Equivalent". I'll restate the sea level numbers in feet as we go, for those metrically challenged, or you can multiply the numbers by 3.3 in your head.
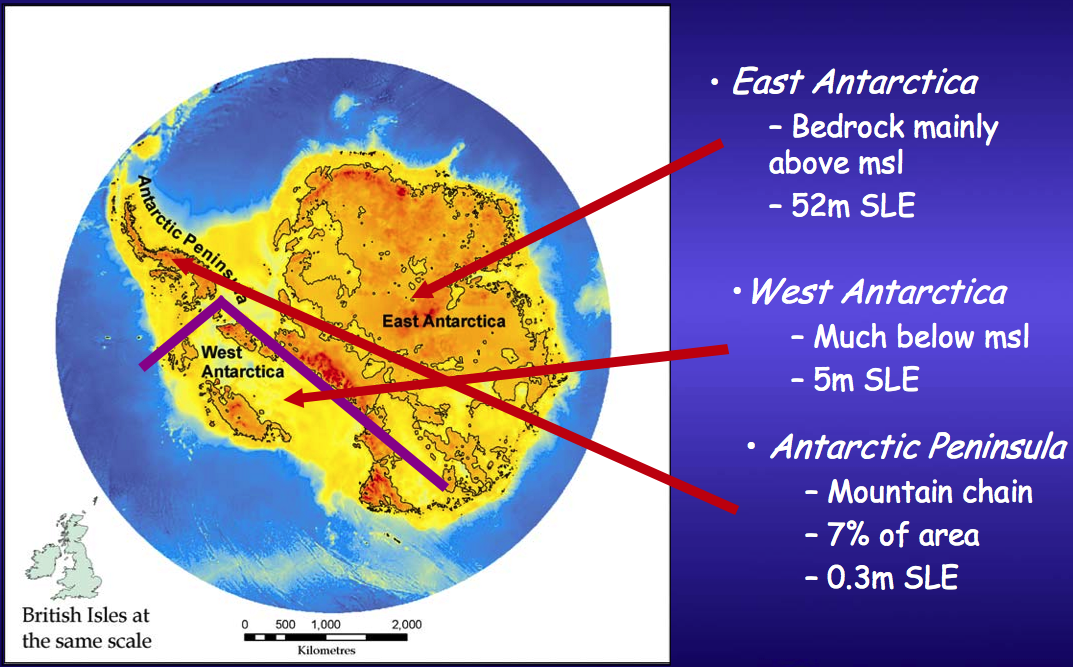
Summary of main regions of Antarctica. Source: Chris Rapley presentation.
Clearly, the big beast is the East Antarctic icesheet which would cover the world's present coastlines in 170 feet of additional water if it ever melted. However, nobody thinks it will on any timescale we care about. The ice sheet is up on land, and a lot of it on relatively high land, and it's colder than purgatory there, and not warming up very quickly. If anything, the East Antarctic icesheet is considered likely to grow with global warming because more snow is likely to fall on it. There has been very little sign of temperature increase on land in East Antarctica during the last 50 years.
Next let's take the Antarctic Peninsula, which is basically a southern extension of the Andes mountain range. It has been warming quite rapidly, and it's ice is increasingly unstable, but it's only about one foot of sea level if everything melted.
So the area of most interest is the West Antarctic Ice Sheet, which could contribute about 16 feet to global sea level rise if it all melted. So it's enough to make a very important difference, but the thing that's most interesting about it is that, as you can see on the map, large amounts of the ice sheet are bedded on rock that is below sea level. The stability of this arrangement is not altogether clear - a warming ocean could potentially start working it's way into the ice sheet, melting parts of it and speeding up the flow of the rest of it. On the other hand, that ice sheet has been there through climate variations of the last few thousand years, so it can't be too easy to destabilize.
The next slide I borrowed from Prof Rapley shows where the annual snow accumulation occurs on Antarctica.
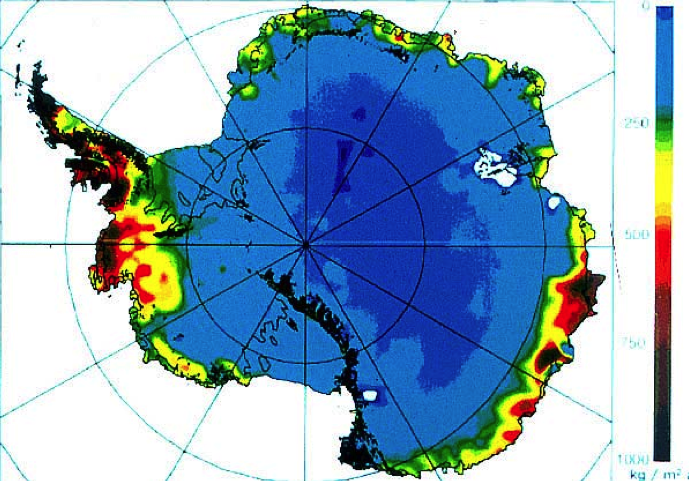
Precipitation on Antarctica. Source: Chris Rapley presentation.
As you can see, most accumulation occurs near the coast, and especially the Antarctic peninsula. By the time air gets very far inland in Antarctica, it's gotten very cold and dry already (having given up it's moisture in precipitation near the coast) and isn't good for much more snow. Thus the continental interior is basically a cold desert which only accumulates snow very slowly.
The next picture, which I think is just a fantastic image, shows the estimated speed of ice flow as a function of location (estimated from satellite measurements).
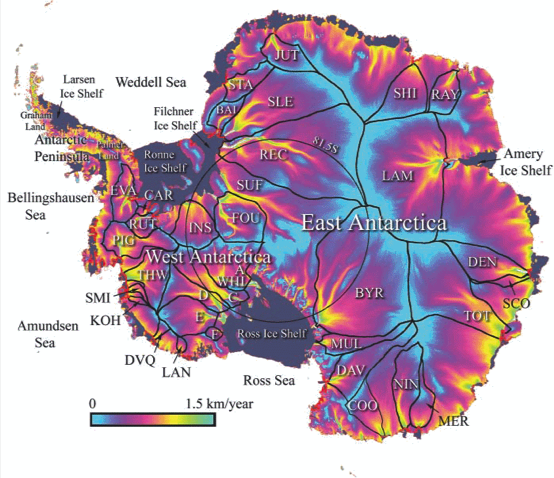
Ice flow velocity on Antarctica. Source: Chris Rapley presentation.
You can see that the interior ridges have slow flow (big blue areas), but as one gets into valleys, there are faster flowing glaciers carrying ice towards the coast. The highest velocities are right at the coast where the continent has to both shed the ice from the interior and all the snowfall that occurs near the coast as well in order to stay in overall mass balance (mass balance means that the amount of snow falling on the ice sheets is offset by the amount of surface melting plus the amount of ice shed into the ocean).
What this picture makes abundantly clear to me is that this is one big dynamical system that is all tied together to transport the ice away from the interior to the coast. There are fast flowing (over 1km/year) glaciers that reach well over 1000km into the interior. So once ice gets into one of those big glaciers, it gets to the ocean in about a millenium. However, it's also very important to note that a lot of the precipitation falls very close to the coast where it can get to the ocean via ice flow quite quickly, both because the ice flow is faster nearer the coasts, in all parts of Antarctica, but also because it doesn't have as far to go. In particular, eyeballing the two last pictures, it looks to me that a quite respectable proportion of the total Antarctic snowfall occurs in places where ice flow will get it back to the ocean in less than a century, suggesting the possibility of relatively dynamic responses for at least a portion of all of the ice sheets. (As an aside, it's also pretty clear that if you want an ice core to give you a 600,000 year record of temperature, it had better be in one of the blue regions with very little ice flow).
So obviously the main question of interest is how is this situation changing with global warming, and how much of a threat is that change in the future? This is another of those areas of science where the climatologists were rather too sanguine until very recently and are having to improve their understanding in a hurry in the face of events. Specifically, in the 2001 IPCC report, the operative words were:
In view of these considerations, it is now widely agreed that major loss of grounded ice, and accelerated sea level rise, is very unlikely during the 21st century. An interdisciplinary panel of international experts applying the techniques of risk assessment to the future evolution of WAIS concluded that there is a 98% chance that WAIS will not collapse in the next 100 years, defined as a change that contributes at least 10 mm/yr to global sea level change (Vaughan and Spouge, 2001). The probability of a contribution to sea level (exceeding 0.5 m) by the year 2100 was 5%. These results are broadly consistent with an earlier assessment by Titus and Narayanan (1996) based on a US-only panel, who found a 5% chance of a 0.16 m contribution and 1% chance of a 0.3 m contribution to sea level rise from WAIS by 2100. We note that Vaughan and Spouge also report a probability of 5% for WAIS giving a sea level fall exceeding 0.4 m within the same time frame, while Titus and Narayanan give 0.18 m.There are two things going on that have been calling these conclusions into question. The first is that various ice shelves have been collapsing. (An ice shelf is the floating portion where a glacier or ice sheet loses contact with the ground but continues as a single solid sheet of ice floating on top of the ocean). Collapse means that the shelf breaks up into a bunch of icebergs (which will then float away and melt). This has been especially the case in the Antarctic peninsula: this next picture links to an animation of the Larsen B ice sheet which collapsed in 2002 to give you a feeling for the general idea.

Larsen B ice sheet. Click for animation of breakup. Source: NSIDC.
Some of these collapses had occurred before the IPCC report, but there have been more since. What is newer news, however, is the degree of glacier speedup that has been occuring in Antarctica. This has been true in the Antarctic peninsula where most ice sheet collapses have occurred. The glaciers feeding the Larson A and B regions have accelerated in speed by factors of 2-6. This is one of the things that have surprised glaciologists. The trend in recent years was to think that the main restraint on the flow of a glacier was friction with the bottom and sides of the valley, not resistance from the ice sheet at the mouth of the glacier. That's looking increasingly wrong. In general, the physics of ice flow is poorly enough understood that numerical models are not able to reproduce past deglaciation behavior or the recent behaviour of Greenland and Antarctic glaciers.
This isn't just affecting the Antarctic Peninsula however. For example, if you go back up the pretty pink, blue and yellow picture of ice flow speed above... Ah hell, let me just repeat it:
Ice flow velocity on Antarctica. Source: Chris Rapley presentation.
Just above and below the left end of the words "West Antarctica" you can see the letters "PIG", and "THW". That stands for Pine Island Glacier, and Thwaites Glacier. Those glaciers have speeded up much like the ones in Greenland and now have 60% mass imbalance (ie they shed 60% more mass of ice each year than shows up as input from snow). This PIG/THW region is now contributing about 1/7 of the world's annual sea level rise.
It rather looks like in Antarctica, the dominant thing that's going on with glacier speed-up is ocean warming. This next picture is from a 2002 paper by Rignot and Jacobs (available from Science with free registration). They did a survey of glaciers all around Antarctica and looked at the amount of melting at the bottom of the glacier in the floating portion near the point where the glacier transitions from being grounded (which they can compute from satellite data) versus the number of degrees above the freezing point of the local water. Melting is measured in meters of depth per year.
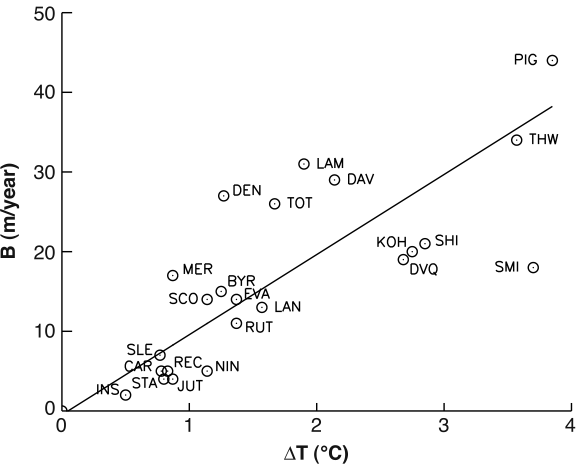
Source: This is Fig 2 of Rignot and Jones, 2002
As you can see, the warmer water melts the glacier pretty fast. You can see in particular the PIG and THW data points up near the top right of the picture which have high ocean temperatures and are melting rapidly at the sea end and have accelerated rapidly in their flow. Ocean waters off Antarctica have warmed about 0.2 oC so far as a result of global warming. The overall effect of that is roughly as follows. Whereas in the IPCC 2001 report, Antarctica was expected to contribute negatively to 21st century seal level rise (as it would sequester more water via increased snowfall), it's now thought that Antarctica is contributing at least 15% of the current sea level rise, and the future is unclear. Since the oceans have not yet equibilibriated even to the amount of CO
All things considered, it doesn't look to me like separating Antarctica into WAIS, East Antarctica, etc is the right way to think about it. It looks like the mass loss is going to be controlled by ocean temperatures. So the assessment is going to be about where and how much the ocean is going to warm off the coast of Antarctica, and how far inland the glaciers are going to speed up in response to the increased melting where they reach the ocean. This is going to have to be studied glacier by glacier all round the continent.
Let's now step back a bit and ask the following. The rough situation seems to be as follows. The Eemian was roughly 3 oC warmer than the pre-industrial holocene. Sea level was roughly 15 feet higher (there are significant uncertainties in both numbers). So if we've warmed the planet already by 0.5 oC, and there's at least another 0.5 oC in implied warming as the oceans catch up with emissions we've already put out, how much sea level rise have we already committed to? If the sea level response to temperature change was linear, then 1/3 of the Eemian temperature rise would give 1/3 of the sea level rise, right? Which would be about 5 feet, give or take. So with the forcings we've already added, we've committed to about 5 feet in sea level rise (assuming an approximately linear response). Add another degree Celsius, as we will in a few short decades of continued business as usual, and you'd get another five feet. (Eventually, that is - when the ice was back in equilibrium with the higher forcings. We'll get to the question of how fast the ice sheets might actually respond in a little while).
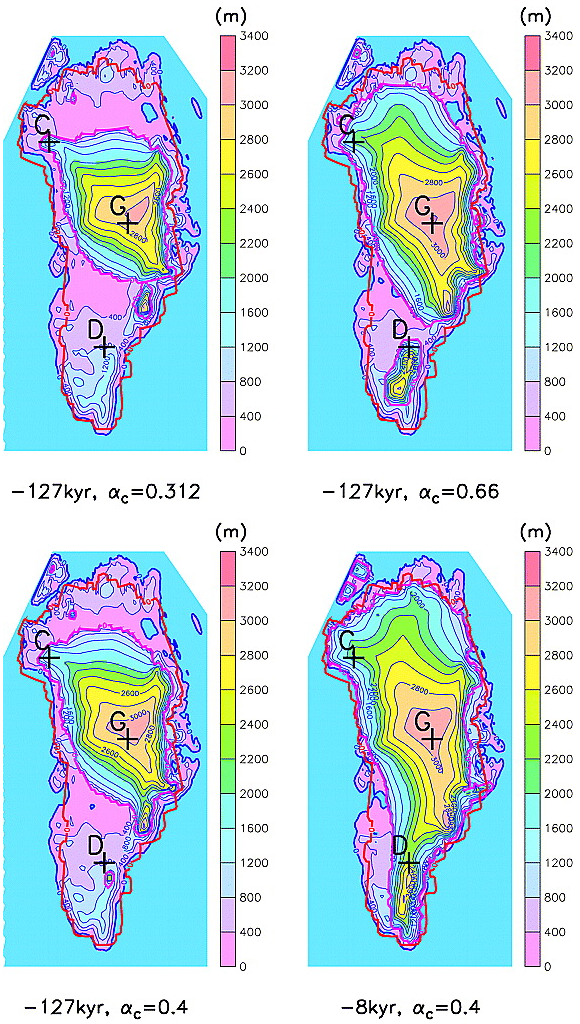
That line of reasoning suggests to me that we've already locked in quite a bit of sea level rise unless we lower the forcings in the future. I find further support for this thinking in figures like this one, from a recent modeling paper on the equilibrium size of the Greenland ice sheet under various conditions.
Source: This is Fig 16 of Tarasov and Peltier, 2003
I'll spare you most of the details of what the paper was doing, but the point is that under a variety of different conditions, the ice sheets are not an all-or-nothing phemonenon. If it's warmer, you get less of them, and they retreat to higher ground. If it's colder they get bigger and start to fill ocean basins too. Obviously, the sea level changes are inverse to the ice sheet changes. The more ice, the less ocean, and vice versa.
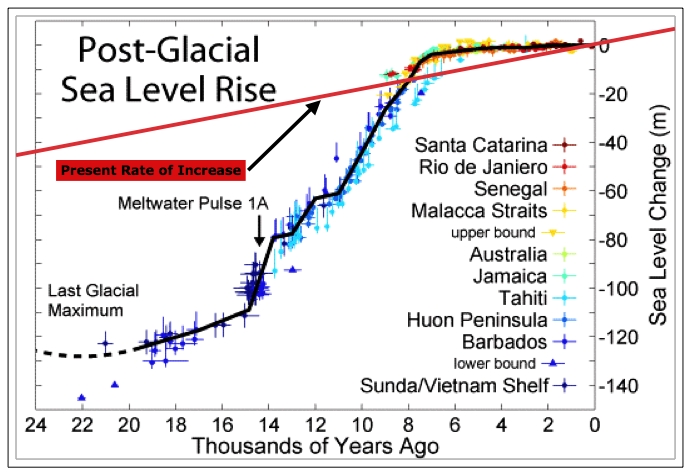
So the final question is how fast could all this go? Let's have a look at the history of how fast the sea level rose during the deglaciation from the last glacial maximum to the holocene. This next picture shows the estimated sea level during that period, and to it I have added the current estimate of present day sea-level change, which is about 1.8 mm/year. 1.8 mm/year is about 0.7 inches/decade.
Sea level rise since the last glacial maximum. Source: Wikipedia, with my addition of present rate of sea level rise.
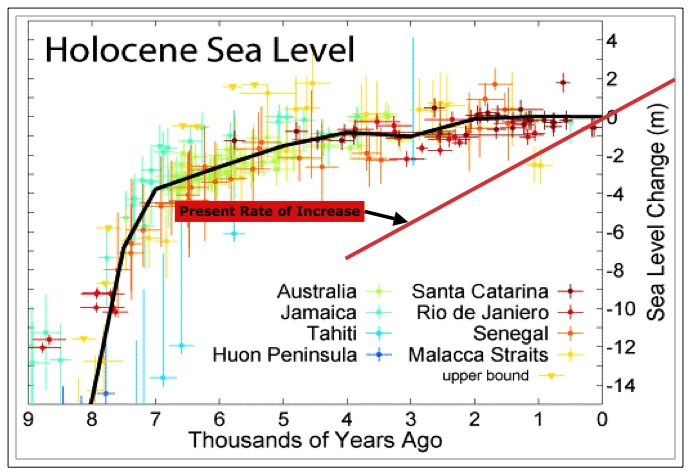
Clearly, the current rate is nowhere near as big as the peak rates of the last deglaciation. During meltwater pulse 1A, around 14000 years ago, sea level was rising at about 50mm/year, or about 20 inches/decade. However, the current rate is large compared to our best understanding of past holocene changes. Here's a focus in on just the last 8000 years.
Sea level rise in the Holocene. Source: Wikipedia, with my addition of present rate of sea level rise.
So the rate of sea level rise now looks abnormal, but doesn't yet seem scary or hard to adapt to. However, we know that in the past, sea level could change fast - ice sheets can melt in a hurry when conditions are right - and recent evidence suggest considerable instability in the current rate of change. In particular, there was a paper on Friday (Feb 17th) in Science from Rignot and Kanagaratnam which has the latest updated numbers on Greenland's overall mass balance based on satellite surveys. The abstract says:
Sea level rise due to Greenland ice loss. Source: Rignot and Kanagaratnam, 2006. Unfortunately, you have to pay $10 to read it if you don't have access to a Science subscription.
Obviously, this is changing extremely dramatically. The rate of mass loss from Greenland has more than doubled in a decade, and this is primarily due to increased ice flow which has gone much faster than ice models predicted. Now, there seems to me considerable reason to expect this to increase further:
Sea level rise due to Greenland ice loss with approximate exponential extrapolation. Source: Rignot and Kanagaratnam, 2006 for the data. Unfortunately, you have to pay $10 to read it if you don't have access to a Science subscription. Extrapolation is mine - see the cautions in the text.
Again, I caution - this cannot be seen as a reliable prediction method. To extrapolate that far into the future from only three data points is indeed wild-assed guessing. (But the icesheet models at this point are clearly not capturing the right physics, so we can't reason from them either). However, that particular wild-assed guess gets you 5-6 inches/decade of sea level rise by 2040. That's from Greenland. While we're in wild-ass guess mode, let's say we double it to allow for Antarctica (which has a lot more ice), which would give us a foot/decade.
A foot/decade is still somewhat less than the 20 inches/decade that was achieved during meltwater pulse 1A. So it's not off the charts for what the planet has done in the past. OTOH, a sceptic could reasonably argue that there was a lot more ice to melt during meltwater pulse 1A. OTTH, we could reply that the rate of change in the forcing was far lower in the past than we have created now with our emissions.
When we start to talk a foot/decade, that starts to get very serious. Low lying rural areas, especially in poor countries, will be lost to the sea - that's too much change to accomodate. Cities will no doubt build levees, but after Katrina, we know what can happen to cities below sea level in an era of big hurricanes. For those of us sitting smug here on the West Coast away from hurricanes, how well do you think levees will protect a below sea level neighborhood in an earthquake?
My point here is not to confidently predict that we know what will happen by 2040. We don't. The situation is extremely dynamic, and poorly understood. But what I will say is this.
It seems very clear to me that we are already operating the planet out of the safe zone. Major critical subpieces of the system are starting to change their functioning substantially on decade timescales. Suppose I was a senior engineer at the company that had built this planet for your civilization, and you called me up and said, "We'd like to run the planet a degree or two Celsius warmer; what will happen to our civilization?". I would say, "We don't know, that hasn't been properly tested. However, we strongly recommend against it - the limited testing we have done in the past suggests that might result in significant changes in the conditions inside the planetary product's environment. The company cannot guarantee the correctness of product sea level or weather conditions outside of the normal operating range. Your warranty will be void if you attempt to do this."
If you the customer want to come back and argue the point - let's say you sue my company for breach of contract - my question would be this: when the mass loss from Greenland is doubling that fast, and Antarctica is starting to undergo big changes too, and really we've only just gotten the ball rolling on warming up the planet compared to what's coming in the next few decades, what should give us confidence that these changes will slow down and stabilize in the future?
Using satellite radar interferometry observations of Greenland, we detected widespread glacier acceleration below 66° north between 1996 and 2000, which rapidly expanded to 70° north in 2005. Accelerated ice discharge in the west and particularly in the east doubled the ice sheet mass deficit in the last decade from 90 to 220 cubic kilometers per year. As more glaciers accelerate farther north, the contribution of Greenland to sea-level rise will continue to increase.
Here's my graph of their bottom line (I have expressed their numbers for Greenland ice loss in sea level equivalent). The green vertical lines are the uncertainties in the estimates. The black line is an exponential fit to the central values.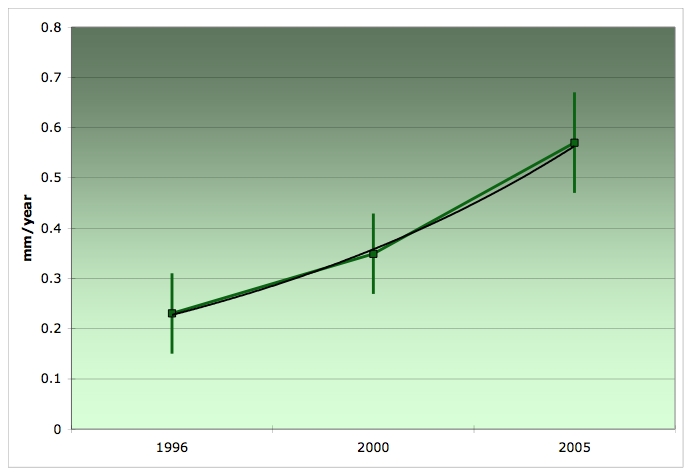
Now, how quantitatively this will play out in the future is obviously very uncertain. Is that doubling rate some kind of anomaly due to bad luck and really the true rate is much lower and thus will appear to decrease in the future? Those error bars do allow it quite a lot of freedom. Or alternatively, is the iceflow responding very non-linearly to temperature, so even a little bit more warming will cause a lot more flow? Nobody knows right now. However, one way to construct a SWAG (scientific wild-ass guess) about the future would just be to suppose that the doubling time for the ice-loss from Greenland stays constant. Thus we are just going to extend that exponential out to the right: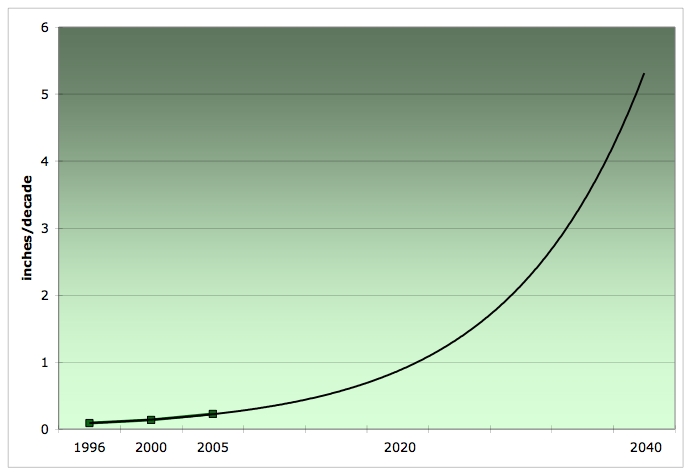
Contact
- Content: editors at theoildrum dot com
- Tech support: support at theoildrum dot com
License

This work is licensed under a Creative Commons Attribution-Share Alike 3.0 United States License.
It just hammers the point home again that Peak Oil is not just happening in a vacuum - it is happening at a time when some (many?) of the solutions to declining liquid fuels/increasing demand are going to be bad for climate change, at a time when we need to reduce, let alone maintain or increase societys production of GHGs.
I have been of the opinion that impacts of PO are decades before meaningful changes in climate, but anecdotal evidence and reading your stories are making me wonder...
I think we are going to have vast demographic changes in next 20 years northward as climate changes, to places with water, sun and wind.
Looking at your headline graph it is disturbing and shocking how rapidly the large temperature increases happen relative to all other temperature changes (all small, all reductions). Viz: "It appears that ice sheets form slowly, but collapse quickly". That smacks of a positive feedback mechanism, something discontinous is happening, it is not fully explained by Milankovitch cycles etc. I'm concerned that I have never noticed this aspect so clearly before, I'm sure I've looked at the data in graphical form.
Continental drift over these timescales could be a factor in the ice core measurements but likely to be small in comparison with these changes. It's probably safe to ignore.
The Eemian temperature peak was sharp and short lived. I wonder why; and I wonder why it bothered to happen. There may be lessons in this. I'd like to see the prior 500,000 years temperature chart on the same basis - the Vostok data seems to indicate that previous high temperatures have been brief spikes. Perhaps we are in an anomalous period in that our temperature has remained higher, longer. Is that our doing or some other combination of factors? It's hard to ascribe this to Milankovitch cycles which are widely assumed to be the main driver of climate changes over the last million years and more.
On past interglacials - if you go back 400k or so, there was a fairly broad one. There is a debate on at the moment started by Ruddiman as to whether the holocene would have been shorter if it wasn't for low level forcings due to human agricultural development (ie long before the industrial era). He summarizes his arguments in a very nice book called "Plows, plagues, and petroleum". He thinks we would have already have been starting the long slow descent into the next ice age if it wasn't for the invention of agriculture. However, there's certainly no consensus around that idea: others think it's just the way the particular combination of orbital factors line up. There was a good discussion of this recently over at RealClimate.
Another thought occurs to me: the dramatic large temperature increases may indicate that increased atmospheric cloud due to warming may be less of a negative feedback (albedo) than expected.
Thanks for the link, it will have to wait till tomorrow but I will definitely read it and say what I think here.
WRT Milankovitch, his studies and the derivatives include four components of solar and astronomic cycles. When we look at graphs of the last two million years, we see seven general cycles. But each one is unique. And my work in looking at where we go from here is based on the underlying harmonics. When several cycles are in play, the troughs and peaks of the four cycles are enhanced or diminished by the harmonics of the whole. There are sub peaks and differences in the length character of the spikes for those reasons.
The only aspect of PO theory that I find unconvincing is the doomsday scenarious. The reason I find them unconvincing is that they seem to exclude the impacts of price on demand and supply for crude, substitute energy sources, and human activities. Not that there will not be painful adjustment periods. But the end of civilization is not in the cards in my view.
In fact, when you consider the impacts on different economies, I think there is a good argument that China and India, particularly China, will pay much higher prices for the impact of PO than western economies because the high prices for transport will serve to move manufacturing back toward the source of demand, thus creating many more jobs in the developed economies and fewer in the now cheaper labor markets that are so far away. Plus, the very energy wastefulness of developed economies, particularly the US, will make it far easier for them to cut back on their energy use. This tendency will also mitigate the financial impact.
Net, net, I expect US stocks to tank very big time at some point, probably within the next five years, and for there to be an initial period of substantial unemployment. But I think that will lead to a later stage of growth for our economy accompanied by vast adjustments to high energy costs.
4%, 11%, Who the Hell Cares?
and
Hubbert Theory says Peak is Slow Squeeze
and
Extrapolating World Production
but
you still need to take into account human behavior.
Basically the amount of decline is academic if all that is needed to trigger resource wars and other types of despair is the fact that it is declining no matter what you can do.
Is choice real or illusion, does it matter? Perhaps geopolitical events are the consequence of build up of tensions and imbalances. Maybe we are just looking in the wrong direction?
Are geopolitical events merely the expression of a more underlying reality.
Stuart was talking about the effects of a slow squeeze on oil production, what I am talking about is independent of that.
The crux will be the timing and interaction of recession and PO, and the ways geopolitical events shape these, and these shape geopolitical events.
I am not saying that PO will cause a depression (though it would) I am saying there is going to be a recession regardless of PO. THERE WILL BE A RECESSION VERY SOON, no possible avoidance. Sorry if you don't like that, reality ain't gonna negotiate on it.
The teaching ministry of Rev. Jones has touched multitudes for over thirty years. We invite you to visit the entire site in order to discover the heart and passion of this ministry!
So a collapse of stock, bond, real estate, and upper middle class income is not a bad thing for 80% of the US population. Keep in mind that most of the people on this website are in the top 5%, because they are professionals or small business people.
1% are institutionalised
4% are dependent on charity
15% are not able to afford a car and a house.
60% are able to afford a car and a house.
15% are able to afford a car, a house, and a retirement.
4% are able to afford a car, a house, a retirement, and a second home.
1% are able to afford pretty much anything.
The top 1% have done very well over the last thirty years.
The next 4% have done pretty well.
The next 15% have pretty much broken even.
The middle 60% have done slightly worse.
The next 15% have done significantly worse.
The next 4% are on charity and don't economically count.
The bottom 1% are institutionalised.
Things tend to move like a pendulum. It gets better, it gets worse, for different income groups, at different times.
- Old folks and handicapped in nursing homes--millions . . . how many?
- Prisons and jails--millions . . . 2 million to the nearest million?
- State mental hospitals--less than a million. (Perhaps half of the homeless should really be there, because they are, strictly speaking psychotic.)
Any way you add it up, I think it has to be considerably more than 1%.BTW I'm in your top 1%. But I got there by wanting only that which is truly good (e.g. good relations with family members, a reliable bicycle, a big old house with room for refugees, garden, small old sailboat, fabulously great sex life, etc.), and because I do not need much I have all that I want and sometimes some surplus to give away to The Nature Conservancy.
This will not take place evenly -- it will eat away at the edges first, pieces dropping off like chunks of ice off glaciers. That's also the middle class -- a glacier -- gigantic chunks dropping off into the abyss.
What's overlooked in the rosier scenarios is the way capitalism works. If capitalism worked the way it was pictured, we wouldn't be where we are now, ready to take on the globe militarily. Capitalism cannot go into reverse, downsizing peacefully. The ever increasing capital intensity and concentration is key to the profitability of finance capital. It's a huge mistake to just look at physical and productive resources as just material stuff which can be deployed rationally. They exist as capital, meaning profitable, or they are junk and subject physical destruction. (This does not exclude people, who are also capital -- or not.)
It's also a mistake to confuse the capitalism we have now with early capitalism and "free markets". The big corporations, the gov't, the military are all intermeshed (not that there aren't big clashes and between factions.)
This capitalism will NEVER consider any solution to PO that doesn't involve greater capital investment and greater intensity. Those parts of the economy that cease being profitable will be junked, literally. But the junking will always be disguised in one way or another. PO will render ever greater parts of the economy unprofitable.
The tendency of people will be to look at land and housing and unused productive capacity as just that, and make efforts to utilize them in some kind of effort to survive. But these efforts will meet gov't hostility because they threaten withdrawal from the market and threaten profitablity.
The energy and capital intensive part of the economy will contract, leaving ever larger parts of the rest of economy to rot. This is already happening and has been happening for a long time on the world scale. Large sections of the third world are considered to be just such detritus, until there is resistance and interference with the "world" economy. They then become terrorists, needful of suppression.
The model is there: large parts of the US will piece by piece become part of an internal third world, needful of supression and gating off.
So you see, Agric is an optimist of sorts!
It is a pity I can't find a copy of the Berger & Loutre paper An exceptionally long interglacial ahead?, Science, 297(5585): 1287-1288 (2002).
But here's the point. The Eemian is analogous to the present period in so far as we can view the effects on sea level of a 2 to 3 degrees C rise in the global mean surface temperature anomaly (with respect to measured temperature records). So, the point is that forcing from CO2 levels in the atmosphere now duplicates the "natural" forcing from the Milankovitch cycles during the Eemian. Also, you should note that this period lasted from about 130 to 125/kya -- a period of about 5 thousand years. It is also important to bear in mind that all the paleoclimate data indicates that CO2 levels never rose above about 290/ppmv in the atmosphere in the last 700,000 years or so.
So, the analogy rests on the effects of the temperature rise (in a much shorter timeframe now) but due to different factors. This, at least, is my interpretation. Generally speaking, there is no analogous period in the paleoclimate record for what is going on now here on Earth. Some people refer to the Paleocene/Eocene Thermal Maximum as having some things in common with the current period but that analogy is flawed as well.
In short, while 6mm/yr is alarming to some, it was supposed to be worse. Yes, the sea levels are not reflecting the known melt rates. Two concensus theories are that the ocean floor is bulging towards the core in places and the cooling effect of the antarctic melt is contracting the stagnant pools. Just as the crust rebounds when free of glaciers, it is now believed that the weight of the heavier ocean volume is depressing the crustal floor. And colder water decreases in volume just as warmer circulating water is growing in volume. The net effect is that the most recent GCM's are predicting only 11 inch rise in sea level by 2100 compared to the 26 inches just five years ago. From 2100 to 2200, the estimate is 22 inches due to forcings and ocean expansion now in play.
IPCC updates its climate reports every several years. The last was 2001. The most recent review is underway. The choices of economic growth rate and emission rate Scenarios for the GCM's have attained concensus and the modeling has been underway since September 2003. The results are being shared and analysed. IPCC will publicly release their concensus report in January 2007. This document (and the inevitable minority reports) will form the basis for stakeholder strategies for the next decade and will address much of what u are bringing to light today.
It is likely so surprise to anyone that my study of this topic leads me to believe that again the apocalytian view is based on junk science and much urban legend. IPCC 2001 was hijacked by the political wing that was pro-kyoto protocol, anti car and promotion of mass die-off. The 2007 Report is more likely to be retained by the science wing that was plainly bodychecked out of play in the prior version.
See some of my graphs and IPCC timelines at http://trendlines.ca/science.htm & http://trendlines.ca/temp%20ranges%20in%20models.htm
And while i have your attention, we are pleased to Release this weekend our first 2006 Version of the Peak Oil Depletion Scenarios. It includes the data from ASPO's Colin Campbell model revised on Christmas Day and the EIA's AEO released this week and based on their December report.
The highlights:
Feb 18th, 2006 - Today's graph updates the ASPO & EIA Scenarios. While Colin Campbell's change is minor, an increase in the production peak to 86-mbd from 85, EIA has dramatically cutback and extended its projection of a 113-mbd peak in 2025 to 102-mbd in 2030. Neither of the models propose a change in URR. Compare the new EIA outlook with the graph below to appreciate the magnitude of this change. While we have chosen to illustrate EIA's "high price case" once again, its reference case scenario has been revised to 118-mbd from 121-mbd. http://TrendLines.ca/economic.htm
Um, how about all the seawater that the Saudis and others are pumping into the oilwells ... or do they recyle this back again after taking the oil out?
And, of course, there is the Gulf Stream. With all that fresh water melt, how fast will it turn its back on the North Atlantic? And if the GS starts to shut down and England gets colder, the heat has to go somewhere. Along its fading upper edge, I bet we have turbulent weather...weather moving from cold to hot and back again...and lots of storms.
Then we have the Siberia peat bogs ready to pour methane into the atmosphere. Sheesh.
The Energy Bulletin copy of the Independent piece is here.
This post shows the dangers of even trying to stay still in the amount of fossil fuel energy we consume. The increasing carbon dioxide we would produced as we went to poorer fuels, heavy oil tar sands, oil shale and coal for the same amount of energy would be suicidal.
A lot of people I have spoken to have dismissed temperature rises of 2 or 3 degrees as no problem as they are small compared to the daily variation. Your post today graphically illustrates the enormous differences such variations have caused over geological time.
Nuclear and renewables must be invested in but we need to powerdown on a massive scale. We must also start making plans for the enviromental changes that will come despite any such powedown.
I see from the BBC that there is a serious risk of power cuts duing the 2012 London Olympics. Sadly the solutions suggested are all ways to increase energy production to meet demand and no mention of cutting demand to match the reduced supply.
After a true economic contraction/collapse I think we might be in much better shape than IPCC says. I'd really like to see some models accounting for various, peak oil paradigm influenced, sources of carbon and charting their various contributions/declines.
Most scientist have now come to the conclusion that, more than they have ever thought before, climate change can occur spectacularly fast. Sensationalism by Hollywood, however, does not help our cause.
Sunday, Feb. 19, 2006
Has the Meltdown Begun?
The discovery that Greenland's glaciers are melting faster than anyone expected has experts worried anew about how high the seas will rise
By MICHAEL D. LEMONICK
The usual argument put forth by global-warming skeptics for why we shouldn't rush to do anything yet is that the science behind climate change is uncertain--and in fact it is. While there's little doubt that humans are helping heat up the planet, the questions of how much, how quickly and leading to what consequences are fiendishly difficult to pin down. That's because the actual climate is still far more complicated than any existing computer model can accurately reflect, making predictions iffy at best. Some natural processes nobody has yet thought of could end up blunting the severest impact of global warming.
Snip ......
http://www.time.com/time/magazine/printout/0,8816,1161231,00.html
Though it might be good news for Canada.
Warming hits 'tipping point'
Siberia feels the heat It's a frozen peat bog the size of France and Germany combined, contains billions of tonnes of greenhouse gas and, for the first time since the ice age, it is melting
Ian Sample, science correspondent
Thursday August 11, 2005
The Guardian
A vast expanse of western Sibera is undergoing an unprecedented thaw that could dramatically increase the rate of global warming, climate scientists warn today.
Researchers who have recently returned from the region found that an area of permafrost spanning a million square kilometres - the size of France and Germany combined - has started to melt for the first time since it formed 11,000 years ago at the end of the last ice age.
Article continues
The area, which covers the entire sub-Arctic region of western Siberia, is the world's largest frozen peat bog and scientists fear that as it thaws, it will release billions of tonnes of methane, a greenhouse gas 20 times more potent than carbon dioxide, into the atmosphere.
Snip ......
http://www.guardian.co.uk/climatechange/story/0,,1546824,00.html
I was surprised by how political it was (totally unexpected). The opening statements were a harangue against George Bush - Kyoto anyone - and essentially a call to arms and expressionn of solidarity with Hansen of Goddard.
the signing of the treaty would probably cripple the USA in short order and likely long order, meanwhile mother nature takes her toll. the point is: there are reasons why the USA didn't sign on to the treaty.
Please lets put some context on Kyoto. If all 163 nations sign up and cut emissions to 1991 as outlined, the temp still goes up and sea levels still go up 26cm ... but in 2112 instead of 2100. Big hairy deal...
I sense there are many here that have not read the IPCC final reports and graphs.
A Global Warning
Feb. 19, 2006
The North Pole has been frozen for 100,000 years. But according to scientists, that won't be true by the end of this century. The top of the world is melting.
There's been a debate burning for years on the causes of global warming. But the scientists you're about to meet say the debate is over. New evidence shows man is contributing to the warming of the planet, pumping out greenhouse gases that trap solar heat.
Much of this new data was compiled by American scientist Bob Corell, who led a study called the "Arctic Climate Impact Assessment." It's an awkward name -- but consider the findings: the seas are rising, hurricanes will be more powerful, like Katrina, and polar bears may be headed toward extinction.
Snip ......
http://www.cbsnews.com/stories/2006/02/16/60minutes/main1323169.shtml
This one has been adjusted for changes in air pressure and seasonal variations. Other versions are available from:
http://sealevel.colorado.edu/results.html
I don't see much of an acceleration visible here. There are some variations up and down, but no systematic change in the trend. It's interesting that Greenland's contribution has supposedly more than doubled in the past decade. It doesn't seem to show up on this chart.
shows about 200mm of increase in 95 years (from 1910 to 2005). That works out to about 2.1mm/yr on the century timescale. So your graph of the last decade with it's 2.9mm/yr, give or take 0.4mm/yr, would appear to be somewhat of an acceleration on the 20th century rate. The difference, or around 0.8mm/yr with significant error bars, is large enough to accomodate the new Greenland numbers.
I note that the estimates of Greeland's sea level rise contribution are not from direct measurements of sea level at all. Instead they are from satellite image processing based estimates of ice flow rates and satellite based estimates of ice thickness. Together, these can be used to derive an estimate of the total loss of ice from Greenland (which is easily converted to an impact on sea level since the area of the oceans can be accurately estimated).
So, it appears that on top of the nature dynmics of climate change, we now have to factor in or superimpose mankind's influence on climate change. This is very complecated stuff indeed. There are just so many variables to factor in and consider - wow! Are we really engaged in a massive experiment in relation to the world's climate? We agree it's changing, we're pretty sure we're forcing more changes, we really know what the longterm consequences will be, we hope we can control any negative results of our actions. Sorry about how obvious/crude all this is. Aren't we in reality attempting to play God here? Aren't we attempting to "control" or "alter" the planet's climate? Isn't this, given our rather poor understanding of the subject, incredibly risky/arrogant on our part? Is it even possible, or dare I say it moral? Clearly we have to understand more and do something, but what and when? Lovelock who is turning into an old-testament prophet crying "prepare to meet they Doom!" Is concerned about the aerosol layer of dust in the atmophere, which appears to be sheltering us from the worst effects of global warming/meltdown. His latest work suggests that if there was a substantial economic downturn, resulting in far less atmospheric partical pollution: that this would actually be a bad thing with substantial and negative results. In a matter of weeks the aerosol would begin to disappear and global temperatures could rise by more than 5C. This is pretty scary stuff, if true. I only want to point out that we're dealing with som pretty complicated material here.
Also, could sea level rise be partly explained by water mining? How much water is being mined in the aquifers? Mining stranded aquifers is uncommon. Most water for irrigation is dammed run of river, or groundwater that is draining to the ocean anyway. What is being pumped out of places like the Great Basin?
Indeed it has a dramatic effect on earth's heat balance (compare the climate of the moon); you may rest assured that any credible climate model will account for it in all its various states. But water moved by human activity is either very localized, as in irrigated land, or the lifetime of its displacement is measured in hours or days. Any effects from human-displaced water are completely dwarfed by natural water in the form of oceans and clouds.
That's why serious discussions of climate-forcing by human activity focus on other greenhouse gases like CO2 or methane.
I'd still like to see where someone wrote a paper on the subject, but it's not likely that anyone here would know about it. But I can hope.
Two thoughts:
#1 If the global gloom theory is correct, were already at Eamian temperature.
#2 Yes more ice to melt, a larger meltwater pulse (scary 50mm/y). Can that number be used for an estimate; knowing the icemass at glacial max, the rate of rise, the temperature and scaling that to the present icemass, x the rate of rise, the temperature. Would that calculation be meaningful?
We are toast !
I notice the instability of the emian peak. I would presume that lots of biological life could not take the heat(literally) and died off. Biological life is a big climate regulator as it seeks best a stable temperature around water temp. as living things are made of water. Due to this die-off, the eemian peak was perhaps so short lived. The holocene is in comparison to the rest of the graph extremely stable. This would seem to have everything to do with agriculture, herding of animals, etc. This stability might have gone on almost permanently regardless of milankovitch cycles if the industrial destabilization had not set in with very excessive CO2 release from coal and oil. When it gets cold we warm ourselves by burning more wood and coal to keep warm(little ice age for example), thereby heating the eatmosphere by CO2 release. When it gets hot(years 800-1300) we grow more plants(vineyards up to scotland,etc), absorbing more CO2.
This is sort of similar to the thinking of the Fed, who presume they are smart enough to have learned from the great depression, always inflating the economy or raising interest rates appropriately to create a "soft landing". I don't know if we will be able to manage it this time as Stuart and others show it is probably a bit too late and the free market reacts maybe much too late, but as a long term proposition for a super advanced(ecologically speaking) globally aware culture it might be the thing to aim for(a soft landing, avoiding big cycles up or down due to CO2 release of milankovitch cycles).
In regarding averting a Great Depression, the Fed now knows how to do it. It would not be pretty. Briefly, and leaving out a whole bunch of qualifications, nobody believes in fine tuning anymore. Nobody. What the belief is among most macroeconomists is that truly massive stimulus with fiscal and monetary policy combined can be used to stop a recession turning into another Great Depression. By analogy, there is a belief in the military that by using thermonuclear weapons we could bomb Iran back into the stone age. We very much do not want to do that, because some tens of millions of innocent people would be killed, but the U.S. has that power in its air force to make Iran into a moonscape. Similarly, the U.S. Treasury, by running huge deficits (in the several trillions of dollars) and having these deficits monetized by the Fed could wipe out all debts and set the stage for renewed investment and economic growth. I want to emphasize that NOBODY wants to do this, EVERYBODY hopes it won't happen--just as we do not want to use nuclear weapons against Iran.
But when TSHTF, my guess is that good people will be forced to do horrible things. Why? Because it is less bad to choose a huge evil to avoid one ten times worse than it is to do nothing.
This post again tells me that we know still too little about climate and melting ice-covers to make a proper prediction of sealevel rise. Hardly surprising.
Too many factors are of influence, and many have been mentioned above. I was missing one, namely that as polar ice caps melts, the earth reflects less light back in to space, as water is dark and ice is light. Thus, oceans hold on to more heat, further accelerating melting.
However, a 2004 Pentagon study:
# Britain will have winters similar to those in current-day Siberia as European temperatures drop off radically by 2020
# Violent storms will make large parts of the Netherlands uninhabitable as early as 2007
# Storms will also lead to a breach in the aqueduct system in California that supplies all water to densely populated southern California
# "Catastrophic" shortages of potable water and energy will lead to widespread war by 2020.
Source: http://www9.sbs.com.au/theworldnews/region.php?id=79439®ion=4
I don't know how reliable this source is. However many scientists studying exactly this say Holland will be uninhabitable by 2020 if we don't act now to pretect our coastline (even more)
As a side note, we used to keep our feet dry by our famous windmills. Most have vanished, off course, and we now use massive pumps, run on electricity or diesel. We have sealevels rising, the land is slowly sinking, and we will be short of power. A recipe for disaster I would say. So the answer to my question when to get out of here is: before it is obvious we have an energy problem.
Because of the vital interest the Dutch have in matters regarding sea level, I would think that they have done some contingency planning. If not, I would be amazed.
Ice-Sheet and Sea-Level Changes (pdf, 21 OCTOBER 2005 VOL 310 SCIENCE www.sciencemag.org)
How Much More Global Warming and Sea Level Rise? (Science 18 March 2005: Vol. 307. no. 5716, pp. 1769 - 1772)
Still, the uncertainty with respect to recently observed ice sheet dynamics causing eustatic sea level rise over and above thermal expansion due to warming of the oceans is a real cause for concern. I think 1 metre of global sea level rise in the 21st century is now considered as a possible (maybe not probable) outcome. Just for dramatic effect:1 Metre GSLR In Florida -- Click to enlarge
Now as far as I can tell they don't do a full prediction up as far as 2200. But eyeballing the way that graph's going sure looks like about 1 meter is very reasonable by 2200.
And of course this is before taking into account any of the recently observed ice dynamics in Greenland or Antarctica. The IPCC 2001 was in retrospect very conservative about sea level changes due to big ice cap changes.
The IPCC does include models of just the oceanic thermal expansion well past 2200. Plenty of these models would have a 1 meter rise owing only to thermal expansion by 2200, if we assume a quadrupling of CO2 levels over the next 140 years.
http://www.chinadaily.com.cn/english/doc/2006-02/20/content_521829.htm
"(My personal assumption would be that, given the felicity and frequency with which humans have invented agriculture and cities in the Holocene, cognitively fully modern humans cannot have existed in prior interglacials or there would have been civilization then too)"
For instance, plough agriculture has only been used for ~200 years in Australia, even though Australia has been populated by modern humans for at least 50,000 years. I suspect indigenous Australians would argue (and eruditely) that current Australian agricultural practice is not sustainable and can't be the work of fully cognitive humans (modern or otherwise)..
Bill Mollison (of Permaculture fame) suspected agriculture was tried long ago on this continent, but the unstable weather systems in the 20 degrees of lattitude makes it a poor game plan. A hunter-gatherer utilises 2000 different food sources, to our current ~20 primary food sources. We are much more at the mercy of the weather now than we were before. Our only saving grace is diesel. Food transport means surplus from one area can be matched to shortfalls in other areas. The weather being too unpredictable to expect an annual harvest.
"Australian agriculture is the method whereby land is used to convert diesel to food"
Its interesting to see that the holocene has the most flat temperature range in the last 150 kys. Maybe plough agriculture (hence grain storage and civilisation) developed in this time due to the relative stability of the climate?
Yes, I read that remark with interest as well. Anatomically modern Homo Sapiens did not move out of Africa during the Eemian except for a short-lived and failed colonization of the Levant for which there is fossil evidence from about 100 to 120/kya. There is no question that "invented agriculture and cities" are not necessarily indicators of modern cognitive abilities and as you rightly point out, Australia shows that.
This very question is in dispute in paleoanthropology but humans at the time in question (the Eemian) were still using Mousterian stone technologies and there isn't any real evidence that technologies indicating cognitive modernity show up any earlier than about 70 to 80/kya in Africa. Even that is disputed but no one doubts that there are no indications in the fossil record of cognitively modern humans before that.
My understanding is that agriculture has been independently invented 8 +- 2 times during the Holocene, including very near the beginning of it. That suggests to me that the probability that widespread humans would not invent agriculture during an interglacial of any reasonable length is quite small. The fact that it didn't get invented in any particular place may say as much about the agricultural potential and climate history of that particular place as it does about the species.
There's no evidence of agriculture being invented during the last glaciation, even though there were widespread modern humans by the later stages of it. It appears likely to me that the climate was never stable enough for large stationary populations of humans to build up. The holocene supported decent sized stationary human populations (eg in the oak woodlands of the middle east), who were then motivated to domesticate plants and animals when climate changes started to affect their livelihoods. By contrast, during the glaciation there were frequent large climate swings that would have kept humans more constantly on the move.
During the Eemian, Neanderthals (who used the Mousterian tool culture) were somewhat widespread in Europe and Asia. They didn't spread as widely during the pre-Eemian glaciation as modern humans did during the post-Eemian glaciation, and they didn't invent agriculture during their Eemian shot at it. That suggests to me that although they were obviously fairly smart primates, they were one or two evolutionary leaps short of modern humans. They died out before the Holocene (presumably at our hands).
An interesting book on holocene climate change and human cultural evolution is "The Long Summer" by Brian Fagan. An interesting link on early migrations of modern humans is here.
No doubt. By the way, I was agreeing with you in my comment.
Anyway, it appears to me that it was the Younger Dryas stadial (12,900-11,500 before the present) that caused Natufian populations in the Levant to start cultivating wheat grasses and other cereals ina systematic way ie. agriculture. I agree with this quote from the wikipedia article
And to reiterate, I do not believe cognitively modern human populations existed during the Eemian period. The how of why our species became what we are is a subject of intense debate in the paleoanthropological communities that study such things. But my personal view from reviewing the literature is that this occurred sometime after 100/kya in Africa and modern humans started migrating from there some 80/kya into the southern parts of Asia--where it was warm enough to live--finally ending up in Australia between 50 and 60/kya. A book that I was initially skeptical about but ending up influencing me is The Real Eve: Modern Man's Journey Out of Africa by Stephen Oppenheimer.Although I will inject my usual cynical remark that it appears that Mother Nature made a big mistake in the upper Quaternary (hence us) and now we are about to get the big payback.
Thus there is not a completely clear dividing line between horticultural (gardening) societies and hunting-and-gathering societies. To the best of my knowledge, hunting is a more or less important component of all horticultural societies (with perhaps the exception of a few societies where fishing substitutes for hunting).
Mike Millikin, Green Car Congress
A team of scientists analyzed three long
sediment columns cored from the seafloor off
Suriname to determine ancient ocean
temperatures. The black box marks their
research location.
Scientists from Woods Hole Oceanographic
Institution (WHOI) have found evidence that
tropical Atlantic Ocean temperatures may have
once reached 107°F (42°C)--about 25°F (14°C)
higher than ocean temperatures today and
warmer than a hot tub.
The surprisingly high ocean temperatures, the
warmest estimates to date for any place on
Earth, occurred millions of year ago when
carbon dioxide levels in Earth's atmosphere
were also high, but researchers say they may
be an indication that greenhouse gases could
heat the oceans in the future much more than
currently anticipated. The study suggests that
climate models underestimate future warming.
(18 February 2006)
Anyone who thinks the planet can continue to
support a human population of 6.4 billion with
the kind of dominant culture that exists now
is clearly utterly deluded.
And to imagine that there is still time to
correct the mistakes of the past 50 years is
also delusion. We are clearly in for
substantial climate change, if not abrupt
climate change, within the next decade or so
and only those who start to prepare for it now
will stand much chance of leaving any
descendants. And even the well-prepared may
stand little chance. Sir David King alluded
to that a couple of years ago and James
Lovelock has reitterated it.
Even if temperature rises are only a half of
what the more pessimistic projections suggest,
there will be widespread devastation -we only
have to look at what is happening now, with
the CO2 level at just 382ppm, to see that.
The Bush Administration has decided to opt
for the Amageddon ending and the American
people have largely acquiesced, courtesy of
Fox News.
What is disturbing is that but continuing
with profligate energy use, the US will not
only take itself down, but most other
nations with it.
Interesting times.
Is the link for those interested.
It would be nice if an actual time frame could be placed on when the water was this warm. What was the plate configuration at the time?
For what I think is the actual study, see:
http://www.whoi.edu/science/GG/people/kbice/paleoceanography_Bice_etal_2006.pdf
The time period is the Upper Cretaceous--plate configuration was a bit different then.
Will this affect the incidence of earthquakes and volcanic activity?
any measurable effect on earthquake frequency
or volcanic activity within the foreseeable
future. Remember that geological forces are
capable of lifting rather dense materials (two,
three, four times the density of water)
thousands of metres upward during mountain
building processes. The increase in weight due
to a half metre rise in sea level, though
appreciable in human terms, is insignificant
when compared to the weight of the Earth's
crust.
Where the WHOI study does become signficant is
with respect to thermal expansion. Obviously
the extremely warm water refered to in the
article was surface water (and that would have
generated a massively increased evaporation
effect compared to current sea temperatures),
but there is also the question of the thermal
gradient.
If deep ocean water were to become even 2/3
degrees C warmer than now, not only would that
almost certainly annihilate all the
temerature-sensitive plankton and totally wreck
the ocean food chain, it would also raise the
sea level significantly above that postulated
in the discussion of Greenland and Antarctic
glacier/ice sheet melt.
And of course, other than increased snowfall in
high latitude regions, all the forces we have
been discussing seem to have both synergistic
and positive feedback aspects.
Whether the preliminary conclusions of the WHOI
are right or wrong in the detail, by
significnatly altering the geochemical
balance of the Earth substantially away from
those that [in the past] provided long term
stability for agriculture etc., humanity has
clearly unleashed forces that it neither
understands, nor has any hope of controlling.
The great work being done on this site to
provide better understanding cannot be
commended enough, but we all know that
decisions that will drastically impact on the
future habitability of the planet are being
made by those with no interest whatsoever
in geochemistry, except as it applies to the
extraction of oil, gas and coal for profit.
To the Point 2/20/2006 (audio should be posted later today.
-Ptone
If we can trap extra radiant heat through increased CO2 and the greenhouse effect, then we should also be able to prevent a certain amount of radiant heat from reaching the earth's surface before it has a chance to cause heating.
This could be done in a number of ways. The crudest would be to get more particulate material into the upper atmosphere. Perhaps remove the electrostatic precipitators from coal-fired power plants, steel mills, and the like. Or perhaps start up the carbon black pumps. Might make for some pretty bad air quality, but priorities are priorities.
You all remember the big flap a decade or so ago about the possibility of a 'nuclear winter' in which it was postulated that a major nuclear exchange would inject so much paticulate matter into the upper atmosphere that it would drastically cool down the earth by blocking out a large fraction of sunlight.
Now, if you really want to be creative, consider placing say a 5 megaton nuclear device on the top of Mount Everest in order to blow several hundred thousand tons of pulverized rock into the stratosphere. This could be repeated on a yearly basis or so, as needed. (Admittedly, it would be quite important to get the feedback dynamics just right in order not to get carried away, but with the way we can do modeling these days, no problemo.)
See, that wasn't so hard :-)
By that logic, because I can scramble an egg, I should be able to un-scramble it. ;-)
I picture it like adjusting the water temperature in a bathtub - first a little hot water, then a little cold water, then a little bit less hot water, then a little bit less cold water, ............ etc., etc.
So what if the air quality in every urban area is like Pittsburgh's circa 1945: we're fighting the War on Global Warming. And what's a little nuclear fallout among friends in the name of saving the planet from massive coastal flooding? Ya gotta take the good with the bad.
It's possible that the consequences of acid rain from the required amount of sulphur are less bad than the consequences of the global warming that would otherwise have occurred. However, I don't find the question easy to assess - thoughts?
Thinking a little further, I guess we could still sequester the S from power plants, and then ship it and burn it in special ships over the hurricane forming regions of the ocean, near major ice sheets, etc. Again, it's very unclear to me there's a net benefit given the degree of ocean acidification that would imply and how much CO<sub>2</sub> is in the ocean (but I'm no chemist).
Just be sure that the injection point if very high up and away from populated areas, as H2S is highly toxic, even more toxic than hydrogen cyanide if I am not mistaken.
I guess the problem is not just getting fine particulates into the upper atmosphere but also getting them to stay up there long enough to do their thing.
So, it looks like we have two problems with conflicting solutions: acid rain and global warming.
While all these speculations are interesting (including my tongue-in-cheek idea of nuking the top off of Mt. Everest), I suspect that any attempt at macro global weather modification is doomed to fail and could very well make things worse, simply because we don't understand all that well what is really going on.
The use of aerosols as dispersants for solar radiation has already been investigated in far greater detail than I could do myself (see http://www.llnl.gov/global-warm/148012.pdf). The difficulty is achieving a sufficiently fine aerosol. The more effective and longer-lived the aerosol is, the lower the rate of application and the smaller the acidification of rain (assuming sulfate is used).
A recent estimate of global forcings is as follows. Krakatoa is that first spike in the statospheric aerosol line:
warming without resorting to nuclear bombs.
We could stop making SUVs, Play Stations etc.
and devote the bulk of the planet's
manufacturing capacity to making mirrors,
ballons and aluminium foil.
We could cover all the roofs of houses with
mirrors, set up a few hundred million mirrors
in desert regions, maybe even a few in
Greenland. We could build millions of gas-
filled ballons, all covered in aluminium foil
and tether them so they float say 500 meters
above ground level.
We could introduce a new style of headwear -
get everybody to wear a large-brimmed hat,
again coated in mirrors or aluminium.
Cars, trucks, trains endless possibiliites
for reflecting heat back into space.
Maybe it would just be easier to turn the
lights off the unoccupied offices and stop
thinking we have a right to endless energy
consupmtion.
If so, we should be worrying about how to adapt to it, not how to reverse it.
The "micro-mirrors in space" idea has the same area need, plus the cost of getting the stuff up into orbit, minus the downside of wave action on the mirrors. Not likely either.
I'll discuss the possibilities of conserving our way out of trouble in my next post.
balloons posting, trying to satirise the
whole concept that there is always a technical
fix.
It is the persistence of this 'technology will
save us' concept that prevents acceptance of
the reality of our situation and prevents
the adoption of realistic strategies for
dealing with what is to come.
We should note that the Bush team have got
this 'technology will save us' game down to a
fine art, handing out government subsidies to
corporations promoting 'solutions' that have
negative EROEIs, pouring money like it is
going out of fashion into schemes that are
going to make global warming worse. Perhaps
they know the subsidies will come back as
campaign donations.
I guess it will take something like the
occurence in the US of a drought similar to
that which is currently afflicting East Africa
for the general populace to wake up to reality.
Judging by the weather anomalies in the US
over the past year or so, a drought similar to
East Africa's may not be far off. It would be
interesting to see what positive spin the Bush
administration would manage to put on such a
catastrophe.
Or is the US government already modifying
insolation over the US by use of chemtrails,
because it knows that without aerosol
protection, the US would already fry?
By the way, here in NZ, the brightness of the
sun (UV intensity) and scorching temperatures
are resulting in substantial lifestyle changes.
It is now considered foolhardy to spend time
outside of buildings between the hours of 10am
and 3pm (some would even say 9am to 5pm).
I recall seeing a German documentary some
years ago suggesting that in the future
children would be required to put on an
aluminised suit and helmet before venturing
outside to play.
Let us not forget that even if technical
fixes were possible, with peak oil upon us
now, there is no time to implement them.
But as has been commented elsewhere, if you
can persuade people to buy water in [toxic]
plastic bottles, you know there is little
hope and your society is almost certainly
already past the point of being salvaged.
It is reported that East Africans are now
rationed to three cupfulls of water a day and
no rain is expected before April.
My take-home message from this encounter is that the debate has definitely shifted from whether humans are driving climate change--serious people on the right such as Michaels acknowledge that we are--to how big of a deal it is. This is where the science is now being spun into propaganda by both sides.
As one example, he argued that the net change in Greenland's ice mass was actually positive due to increased snowfall. I thought that ths was incorrect but didn't press him on it because I hadn't reviewed the literature myself. A quick read of the Science article that Stuart references shows that increased snowfall in the interior has been a mitigating factor, but that the balance is negative. Perhaps Michaels can point to something specific in the data to make his argument, but I was not impressed by this twisting of the published findings.
We need more sober science and less spin with this issue. It's unfortunate that people like Michaels will likely continue to generate enough "noise" around this issue to confuse casual observers.
You might want to check out this anecdote to decide which category Dr Michaels falls in. You are not the first to have the experience you just had.
Dr Michaels is funded to a significant degree by fossil fuel companies and trade associations. I think it's important to note in this area that there has been a large and well funded PR campaign of deliberate disinformation trying to obscure the issues and prevent action. It has had considerable success, especially in the US.
It is ironic that a significant portion of his presentation was devoted to arguing that climate scientists are not telling the "whole truth," and that many omit facts that would otherwise reveal that global warming "isn't such a big deal." He also argued that NASA scientists have overstated the threat in order to perpetuate their stream of research funding.
At one point in his presentation he commented that the lesson from ecology was to "find an empty niche and fill it." I have to wonder whether this is exactly what he has done with his funding sources. I sat next to him at the conference table and can honestly say that I did not notice any horns protruding from his skull. In fact, he was funny, personable, and somehow sympathetic to many of criticisms presented. For example, when I pointed out that one of the problems with tar sands is that "you have to burn it twice, first with natural gas to extract the bitumen and then for fuel," he quietly stated that he hadn't said it was a good idea. Nonetheless, he is without a doubt intellectually compromised at this point with his dependence upon carbon-friendly funding sources.
I mean, if this hypothesis were correct, from 1994 on we should have seen some moderation of US government funded climate scientists views on the seriousness of climate change. And from 2000 on, they all should have executed a complete volte-face and be downplaying the problem and finding the easy solutions their new bosses knew were there all along.
Since this has not happened, in fact the reverse - the degree of alarm seems to have increased - I conclude that the hypothesis cannot be correct. At least some climate scientists must have at least some degree of integrity. And to the degree they lacked integrity or courage, we would now expect them to be downplaying the problem, rather than exaggerating it.
And that is exactly the feeling I get from reading a slew of climatology papers - a good deal of scientific integrity with an occasional admixture of downplaying (especially in the conclusions).
Let me throw a few logs on the meltdown fire. The following chart provides a rough indication of anticipated growth in global carbon emissions through year 2100. As one can see, it is expected that carbon emissions will nearly triple from year 1990 levels. Obviously, this should be cause for major concern...if not complete alarm.
Figure 8 - Global Carbon Emissions, 1990-2100
http://www.accf.org/images/Test399Fig8.gif
Source:
The Impact of the Kyoto Protocol on U.S. Economic Growth
and Projected Budget Surpluses
March 25, 1999
http://www.accf.org/publications/testimonies/test-impactkyoto-march25-1999.html
While the projected growth in carbon emissions reinforces the potential for glacier and ice sheet meltdowns resulting in large scale rises in sea levels, the solutions are not necessarily limited to mere reduction of emission levels. At least they shouldn't be. First, the turnaround time involved will not satisfy the environmental need without creating some economic output reductions that many nations will find unacceptable. China is such a case. Regardless of what many may say, the resistance to take economic hits will be significant.
I suggest that we discuss the other side of this situation. If we can't anticipate a sufficient decline in carbon emissions, then we should focus some attention on other potential interim solutions. Like what? Well, that's quite simple. What we're really talking about is the freon level in the refrigerator compressor. We know that as we move ice from the freezer to the chiller, the ice or ice sheets will melt down reasonably fast. So, let's put some focus on rebuilding the ice volume in the freezer.
For those who understand hydrology, pumping mechanics, pipeline flows, dredging, and even wastewater spray treatment, one approach should be to analyze the GPM potential for supplementing natural cycle ice sheet build with mechanical flow means. In other words, let's create new ice mountains much in the manner we do such with mining mountains of material awaiting further distribution. The goals are the key. Restore higher level of ice build sufficient to offset increasing rates of meltdown.
Can it be done? Sure. It's a matter of reverse material dredging and determining the acceptable rate of GPM flow. The impediments need to be addressed, along with the development and on site equipment positioning timelines. Power source? Nuclear, of course. We're going to flow water on a 24/7 cycle basis during the coldest months and build replacement ice sheet and glacier yield. Cost? Yeah, it's pricey, but very cheap in terms of the alternatives for the collective economies of the nation states. The principal issue is scale of such operations at both poles, along with similar efforts at Greenland. Further supplemented by marginal effort to herd breakaway icebergs, keeping them near the cold sink sources (near the poles) as opposed to allowing them to shift into warmer and warmer waters.
For those who scoff at this concept, realize that no one is focusing much attention on alternate courses of action to keep the Earth's refrigerator in sustainable operating condition. And rest assured, we are talking about a historical refrigeration model. The endless hand wringing over carbon emissions and man's economic development growth curve are fine exercises in general futility and emotional ranting, but certainly fall short of providing a realistic and timely solution to offset the observed melt rates. The politicos and corporate thugs are not going to cave easily. Say what you will, but they will cost us one or two decades in the decision cycle. So, let's walk around them and offer an interim solution that they may endorse with minimal resistance. Moreover, the present melt rates fail to address the percentage bump that could be readily experienced should nature through in a few wrinkles, say a brief period of unanticipated volcanic activity or similar disruptions in the projected model upon which adjustments would be made. Any natural upsets could scale up the level of melt far beyond any cause from man. Again, it's time to tune up the refrigerator and expand its operating range. Otherwise, we will just waste more time.
I suggest that we shift this conversation from the chiller portion of the refrigerator to the freezer and focus on the possible solutions to recapturing higher ice production yield. Cutting to the chase, higher ice yield production and maintenance will be driving issues. Let's make more ice. And fill the freezer back up.
I grew up in Big Delta, Alaska and I've seen the results of out-of-the-box thinking and superior innovation. It's time that we got off the bench and starting making things happen. The whinning is accomplishing nothing of value with the hardcore capitalists. They're focused on a different racing platform.
We need a fresh approach and I suggest that we redefine the broader problem. It's ice production, not melt. The refrigeration unit still works. All we have to do is prime it.
Next...
This solution does nothing for the other aspects of global warming, but does it have merit just as a solution to sea level rise? The scale of the problem currently is O(1,000 km^3/year), so that's how much we'd need to pump. If things keep accelerating, we might need to pump O(10,000 km^3/year). So that larger number is around 300,000 m^3/second of seawater. Or to put it in slighly more familiar terms around here, that's about 2 million barrels/*second* of seawater. Or 160 billion barrels/*day* of seawater. Ie we'd be pumping something like 2000 times more fluid than the global oil industry currently handles.
Hmmm. Doesn't sound too promising...
http://www.whoi.edu/oceanus/viewImage.do?id=18930&aid=9206
My suggestion--and it is a vague and maybe silly one--is that somehow we divert the water inland during the winter months at one or more of these choke points. The water flows under the ice. If we had huge pipes under the ice, which we could close in the summer months and if the pipes led inland, we might divert enough water at these choke points to freeze it as it spilled over the land mass. The pressure from the current when focused might be enough to move a great deal of the water inland to higher ground. Focusing the flow to provide enough pressure would be the problem.
I find myself in a slightly odd position regarding Global Climate Change. It is
clearly happening, it is clearly man made, and it is clearly significant. In
fact I suspect Ruddiman may have something when he says we have been
contributing to GCC since we discovered agriculture. The three staged denial of
the skeptics really annoys me, first they deny GCC is happening, then deny it
is anthropogenic, then deny it is significant and anyway not reasonable to do
anything about it. (Thrice denied).
The last denial probably annoys me the most - because I partially agree, and
hate to concede anyhting to the deniers. The conclusion of your article is that
we are operating outside the safe zone. But are we? Even the last 600,000 years
is a small fraction of the 4,500, 000,000 year life of the planet. So can we
say the safe zone means only the last 600 kyr? Let's step back and look at the
bigger picture. This graph shows an estimate of temperature over a longer
scale.
The current pattern of regular glaciations only started about 2.5 million years
ago. If we look back further
(Sources:Wikipedia)
So in fact for the majority of that time the temperature has been above +2
deg.C from present level. So how can anyone say the planet is outside it's safe
zone? In fact, for the last 2 million years, we have been in a highly atypical
zone.
When people talk about changing the status quo (leaving the safe zone) they
seem to have a notion that the "proper" thing to do is preserve the planet in
its current state. So exterminating other species and changing global climate
are bad. But this view is fundamentally flawed, these things have happened
before, and to a greater degree. (I find the rate of change not significant).
When people talk about safe zone, they also imply safe zone for current human
civilisation. Many coastal cities will be inundated, many places will be made
uninhabitable. But is that going to any worse than the millions of poeple who
die every year due to famine, drought, flooding already? The planet, through
forces of physics and evolution will undoubtedly survive our little efforts,
even if we and polar bears do not.
The dilemma of whether knowledge of the situation gives us responsibility and a
requirement to act according to what we think is "the right thing" is a
philosphical one which I don't have the answer to.
The other nagging doubt I have is that the IPCC Business As Usual forecasts
seem to assume far more fossil fuels then we really have. So the forecasts up
to 2200 I think cannot possibly happen. It would be good if someone could look
into this in more detail. One paper I looked at had a completely naive
assumption about CO2 emissions into the future, which really invalidated the
whole paper.
So I think that our litle fossil fuel era will cause a tiny but measureable
blip in CO2 and temperature. When the FF are gone, the planet will take a few
thousand years to absorb it, then inexorably head towards the next glacial
period. PO and Climate Change are the immediate threats we face, but by far the
biggest upcoming threat to civilisation is the next glacial. A 1km thick sheet
of ice over the whole UK is going to cause more of a problem than even 3m of
sea level rise.
To prevent it, we need to increase global temperature by some 8 degrees to get
out of the glacial cycle - more than the 2 degrees we have so far. We should
dig up sequestered carbon and pump CO2 into the atmosphere (in a controlled
way.) Hopefully, there will be a positive feedback so we don't have to burn so
much carbon. This gives the opposite conclusion to all the established PO lore,
unfortunately, so I don't expect to get much sympathy for his view. Burning
carbon is a good thing. We need to keep doing it, even if not for fuel.
http://en.wikipedia.org/wiki/Image:Phanerozoic_Climate_Change.png
which takes us back to the Cambrian, where all modern life forms more complex than sponges began. We have a long way to go to get outside the safe zone for complex life on Earth.
In fact, the closing of the Isthmus of Panama is central to the ocean currents we now see. It's closing also was an important factor in the build up of ice at both poles.
Simply looking back at temperature changes at various points in geologic history ignores important contextual information, the arrangement of the land masses is a part of this information.
For a fuller discussion of this issue, see:
http://www.whoi.edu/oceanus/viewArticle.do?id=2508
(At some point, I am going to break down and learn HTML.)
Whatever I worry about tends not to happen; that is another good reason to take the possibility of our going into a another glaciation seriously. The glib assumption that greenhouse gases will cause global warming is just that: Because none of the models can handle clouds, we cannot know at this point what the consequences of carbon dioxide and methane forcing will be.
Michael Chrichton makes this point very well in his excellent and very well-researched novel, STATE OF FEAR.
Well, there goes your credibility out the window now that you've just ignored the consensus of 99% of the scientific community studying the climate problem for the past 30 years. You've taught economics, right? If you talk about those kind of issues, I'll listen. But in this thread, you are utterly lost.
Alternatively, you could go over to RealClimate and actually try to learn something.
Incidentally, citing Crichton with approval will tend to get you immediately labeled negatively with anyone other than right wing climate sceptics. I haven't read his novel personally, but it infuriates people who's knowledge I do respect. If that's the company you enjoy....
Surprise, surprise, those with degrees in geology and other hard science tended to give it five stars. Those without scientific backgrounds overwhelmingly hated it.
Interesting.
Read everything you see (especially the posts) from RealClimate on Michael Crichton and then, after a few months of hard research, get back to us. (Look toward the bottom of the link cited).
Sometimes I can't believe I write these replies to ignorant people like you (at least on this subject). I suppose it's because I believe that you (like Michael Crichton) can do real damage since most people are so uninformed.
I thank you once again for not criticizing a book that you have not read. Of course, if you were to do so, it would clearly make you guilty of fallacious reasoning, namely, a fallacious appeal to authority--in this case "authority" being the claque who criticize a source without having studied it.
The conventional wisdom is so often wrong.
BTW not one of the sources you cited in an earlier post address the issue of cloud cover. If a climate model cannot predict the effect on cloud cover from CO2 and methane, then it cannot predict the effect from these causes on the albedo of the earth. If you cannot predict the effect on the earth's albedo, you cannot predict the effect on climate.
I would appreciate one single solid citation to any climate model that claims to have a firm handle on what methane and CO2 are going to do to cloud cover.
I thank you in anticipation of your response.
If your curiosity is strong enough to motivate the purchase of a textbook, there's a six page discussion of the issue in Global Warming: The Hard Science by Danny Harvey. The book is as of 2000. In the alternative, if you're willing to trust me with your mailing address, I'll ship you a photocopy of those pages.
I've read his book, and it contains junk science and strawman arguements at best.
As a side note, Crichton also does not believe in the dangers of second hand smoke.
These critiques of "The State of Fear" by informed scientists pretty much covers it:
http://www.realclimate.org/index.php?p=74
http://www.brookings.edu/views/op-ed/fellows/sandalow20050128.htm
http://www.pewclimate.org/state_of_fear.cfm
Until we reach SIM, I guess we'll have to find a way to survive somehow. For that purpose raising the Earth temperature by 8 degrees does not look like a good idea, IMO. At least not in the the short term (some ten thousand years).
Of course the Earth goes on but a little knowledge is a dangerous thing. After the K/T boundary event that wiped out the non-avian dinosaurs and many, many other species, things went on although it took several million years for ecosystems to recover from the impact of that meteorite.
Today, Homo sapiens is the equivalent of that big rock (or ice ball). Perhaps you should spend less time looking at the temperature record of the Cenozoic as interpreted through a proxy paleoclimate measurement and spend more time thinking about Mass Extinctions and the fate of many other species of Earth. And also the Collapse of human civilizations.
I'm trying to reconcile the concern over anthopogenic GW and the elephant in the room, which is the fact we are deep in an Ice Age. If you are going to talk about Extinctions and Collapse, you simply cannot ignore the Ice Age.
How do you propose we survive the next glacial period starting 10,000 years or so? I doubt our civilisation will survive 100,000 years of glaciers. Or is that to be our natural fate, so we just accept it? It really doesn't matter a jot whether we increase the temperature a degree or three over the next thousand years, after we have run out of FF to burn we will freeze regardless.
BTW, it wasn't me who started this proxy paleoclimate measurement thing, that was Stuart. And here's some more to chew on:
Source:http://www.geocraft.com/WVFossils/Carboniferous_climate.html
We occupy the pixel at the very lower right corner. Both CO2 and temperature are as low as they have ever been. And we are worried about a little increase? Mass extinctions happen, get over it. And civilisation will collapse (geologically) soon anyway. Does it really matter whether these things happen at the hand of humans, or that they happen due to external factors beyond any control?
There is a cosy green environmental view that the Earth would be a permanent Garden of Eden, and that we should do nothing but wrap up the Earth in cotton wool and protect it. Apart from being highly subjective and anthropocentric, that view is factually completely incorrect. Don't get me wrong, I love nature and don't like at all what human civilisation has done, nor much care for what it claims to have achieved. But you have to face the facts - we are probably a temporary feature and in the grand scheme of things not that important. Future visitors to Earth may note an extinction event associated with the brief appearance of an ape-like species. The log entry may read "humans: mostly harmless".
I am afraid it is you who are not looking at the big picture, not me.
Name: Monte Hieb
Email: mhieb@mines.state.wv.us
Title: Chief Engineer
Organization: West Virginia Office of Miners Health Safety and Training
W VA economy is heavily weighted towards mining (this is where the infamous MTR technique is being practised, disastrously). and the coal mining industry is, shall we say, not exactly thrilled with any critique of fossil fuel use. he is (emphatically) not a climate scientist, plant or marine biologist, etc. -- though he does seem to be an enthusiastic amateur fossil-hound with a really nice web site on W VA fossils.
Personally, I prefer scientists who are studying various aspects of the problem, not novelists or amateurs who may have books to sell or causes to advance.
But, hey, everyone picks his own authority.
It wasn't Stuart, dumbass. He's summarizing 30 years of climate change research to the best of his ability in a limited forum. And he's doing a good job. As far as the big picture goes, I certainly know more about that than you do.
Of course Homo sapiens is a temporary feature on the Earth. So, do you have kids? Does anybody you know have kids? Do you give a shit about your kids or those of other people? What kind of lives will they lead? Do you care?
That's the whole fucking point of this website. If you don't get that, what do you understand?
I'll be damned, it didn't work!
How the hell are we going to even approach the climate change problem if people deny that it exists?
best, Dave
I will refrain from using that kind of language in response to ignorant comments by BobCousins or others like him in the future, bearing in mind, of course, that they have no idea what they are talking about.
It's closing also was an important factor in the build up of ice at both poles.
For a fuller discussion of this issue, see:
http://www.whoi.edu/oceanus/viewArticle.do?id=2508
The canal is not at sea level (except at the two ends), so there is not direct flow of water from one side to the other.
Providing and installing the lock motors and controls was General Electric's first government contract.
There have been various plans to build a wide sea level canal through either Nicaragua or Colombia that came out in the 1970's by using nuclear explosives. Fortunately those got scrubbed.
The Soviets had the crazy idea before the fall of their system to reverse huge siberian rivers flowing to Arctic so that the dry cental Asian area would have more water. Of course rivers flow to the ocean, then oceans evaporate and it rains in the mountains inland coming full circle. However we know that the freshening of the north Atlantic is now causing a weakening of the gulf stream(30%).The hotter it gets the more pronounced this effect will be. Europe will get pretty cold. The gulf stream will circulate almost completely in the carribean causing monster storms stretching even to Brazil and Spain if not further. My idea is that if we really reversed the huge Siberian rivers to flow south away from the Arctic we could take away huge amounts of fresh water and resalinate thereby the arctic ocean, reversing the current process and save the gulf stream. This would reduce the hurricanes and save Europe from a severe cooling as in the current winter(and USA from current winter "heat wave"). Of course Greenland will hardly stop melting( we could drag away glaciers that start breaking off for fresh water supply before they break up and melt- down St.Lawrence to Great lakes and Midwest with tow barges). Maybe instead of pumping water out of aquifers we could pump it back in via such rivers(instead of filling up huge areas with oil as strategic national reserve better to use salt water). Or else we could channel these rivers to drying up lakes such as Caspian or Aral in Asia to fill them up(of course they would just evaporate in the heat again and rain would fall on oceans?). Speaking of pumping salt water away from oceans I understand this is done in a massive way into oil fields(saudis). But obviously that is also no real answer and is like emptying a swimming pool with a straw.
I also worry about the end of the himalayan glaciers resulting in the drying up of the Asain rivers yangtse, Hwangho, mekong, indus, ganges, etc. I hear the water tables are getting really low there. If the rivers and the water table are gone then everybody there will certainly die(3 billion)? Would it be then a solution to redirect the Siberian rivers to Asia thereby resalinating the arctic(saving Europe and Americas weather wise) and saving all the Asians from death by drought? The mountains are of course too high to somehow get canals from these river over to China and India. Otherwise this idea has a lot of interesting solutions for an entire range of problems for almost everyone(Europe, Americas, Asia).
I agree of course we will have to be very ingenious at every level to somehow survive the coming crisis. Conservation, new technology, permaculture, power down. Obviously there are too many of us using too many resources and such mad hatter solutions as those above would not have been even considered if we had not had such massive problems caused by ourselves(the solution worse than the problem-like nukes and genetic manipulation). Perhaps it is better that billions die and then the aquifers fill up again naturally over thousands of years again and the earth cools again sometime bringing back the glaciers and the asian rivers. Nature will probably know how to come back into balance without us. We must all pray for the best and accept our fate when we can no longer prevent its brutal finality.
The other thing is that a project like this will come around and begin taking effect probably much too late; after half a century all oil and NG will be gone anways, probably the Greenland ice cap too... So why bother?
But I appreciate the creativity.
Here's another crazy Idea;
put a screen up in the lagrangian point between earth and sun (L1).
http://en.wikipedia.org/wiki/Lagrangian_point#L1
The diameter is adjusted for desired blocking effect.
Hey - we could fit some solarenergy device to it and beam the energy home and fix the energy issue too.
Or pray for blacklight to work
Meanwhile: conserve and invest in renewables.
Stuart,
I believe that you misunderstand part of my previous message. I wasn't simply suggesting an optional approach.
I am not saying that we have any meaningful and timely alternative to creating more ice fields, and adding to or stabilizing existing ice fields and glaciers at the poles. We don't have any choice. We have to undertake the effort. Quickly.
It is exceedingly clear from the current meltdown data and carbon emissions projections that we will not turn the corner in time to avoid destruction of the polar caps without a counter-refrigeration effort. Making additional ice in mass quantities must be added to the discussion and interim solution. We don't have the luxury of blowing it off. We don't have that margin of time to screw around. This boils down to basic refrigeration maintenance of an object and available substitute technologies.
Kindly take another look at the following chart and tell me honestly that we will reduce carbon emissions enough in the next 95 years to restore stability to the polar caps. What do you see?
Figure 8 - Global Carbon Emissions, 1990-2100
http://www.accf.org/images/Test399Fig8.gif
There is no way that we will turn the corner quickly enough if relying solely on carbon emission reductions. You have to know that.
I am familiar with your professional background. It's a good one. But I believe it's unfortunate that you aren't also an expert in refrigeration technology as used in large scale applications, such as ice storage plants or sea source air conditioning technology (note the Hawaii projects). There are those who do know enough about the refrigeration field to apply their skills in a timely manner. Taken together with other available supporting technologies, the effort must be pursued at the earliest opportunity.
Anyone familiar with mass bulk ice storage knows that the existing volume of ice is important to overall cold temperature maintenance during a power outage. The larger the stockpile, the better. This is a similar issue to what we are facing at the poles.
The first initiative is to build a demonstration project. Funding for the larger scale operations will follow that technology marketing initiative.
Satisfying the supporting GPM flow optimal yield needs is a secondary issue. Anyone who turns away from this supporting solution is missing the boat. We're out of time.
We need a polar demonstration project and we need it now. That's where some new thinking, funding, and effort need to be applied. Quickly.
You're a physics PhD innovator. Step Up. Help lead the effort.
----
- melting of Greenland ice cap
- melting of north polar ice cap
- widespread melting of tundra
- significant melting of Antarctic ice
All of these would seem to generate positive warming feedback. Perhaps if any one happens the others become virtually inevitable.My musings came to one conclusion, and one only: to get back to approximately current equilibrium should we pass a significant tipping point we would have to have another ice age.
Movieguy is looking to slow certain sea rise that is going to inundate entire coastlands. How much are parts of Florida worth? Or the Eastern Shore of Maryland? or Bangladesh? or Holland?
Stuart points to the magnitude of Movieguy's proposal. Hey, it is one thing we can think about. Who knows how much water can be scooped out during winter months and sent inland to freeze? Could we, for example, use the choke points--Hudson and Bering Straits--as places where we can use current pressure to help us? Besides, these are places where the relatively fresh water flows. This is the water we need to put back.
If the science on sea level rise is accurate, then nothing should be off the table. Just because an idea initially seems madcap, don't dismiss it out of hand just because you can throw a few facts at it.
I wonder what some Chinese said when someone proposed a Great Wall for keeping out the invaders? "You got to be kidding! Crazy! Too hard!"
At some point, we will have to throw everything at this problem that we can. There will be no option. Nothing should be off the table, however initially absurd.
WSJ.com - As Planet Heats Up, Scientists Plot New Technologies
October 22, 2004
Climate Control
As Planet Heats Up,
Scientists Plot
New Technologies
Appetite for Oil, Coal Drives
Search for 'Painless Cure'
To Global-Warming Issue
Storing Carbon Inside a Rock
By ANTONIO REGALADO and JEFFREY BALL
Staff Reporters of THE WALL STREET JOURNAL
October 22, 2004; Page A1
In a warehouse on the outskirts of Tucson, Ariz., engineers are building a
prototype machine they believe could help stave off global warming. The
scheme, hatched by Columbia University physicist Klaus Lackner, would
remove carbon dioxide directly from the air -- and store it in rocks or
under the earth.
Dr. Lackner says it will take decades before his idea for a world-wide
network of wind-powered machines, each able to remove several hundred
pounds of carbon dioxide from the air a day, could become reality. For
now, the plan is more than a little quirky. The company behind it, grandly
named Global Research Technologies, has three employees and operates on a
$5 million line of credit from a wealthy donor.
The wind-machine is a massive long shot. But a growing chorus of
scientists, environmentalists and large corporations now agree that to
seriously address the world's global-warming problem, a major
technological shift is what the planet needs.
If Russia ratifies the Kyoto Protocol -- its lower house of parliament is
expected to approve it today -- it will trigger the implementation of the
treaty for most industrialized nations. The treaty is meant to slow the
rapidly accelerating release into the atmosphere of so-called greenhouse
gases, chiefly carbon dioxide. CO 2, produced by the burning of fossil
fuels such as oil and coal, forms an atmospheric layer that reflects the
sun's heat back toward Earth, heating the planet in a process known as the
greenhouse effect, or global warming.
But the Kyoto Protocol won't solve the world's climate problem, the pact's
supporters and detractors agree. That's not just because the U.S. -- the
world's largest carbon emitter -- hasn't signed on. Or because India,
China and other emerging economies, whose collective global-warming
emissions are expected within a few decades to overtake those of today's
developed world, aren't covered by the pact.
The reality is that the Kyoto treaty, named for the Japanese city where it
was negotiated in 1997, never was intended as anything but a first step.
Countries that ratify it agree to emissions reductions between 2008 and
2012, which add up to a 5.2% cut from 1990 levels for the industrialized
world.
Most scientists believe trimming emissions by 5.2% isn't anywhere near
enough to protect the planet. Atmospheric concentrations of CO 2 are over
370 parts per million today, up one-third from pre-industrial levels,
according to the United Nations' Intergovernmental Panel on Climate
Change. Many scientists say the Earth can tolerate CO 2 levels of about
550 parts per million before it faces a host of dangerous climate effects,
from increases in extreme weather to regional droughts to significant
rises in sea level.
Given current projections of economic growth and emissions increases, many
scientists believe the globe could approach that point around the middle
of this century. Stabilizing atmospheric concentrations of greenhouse
gases at 550 parts per million would require the world to cut emissions
between 55% and 85% below where they'd otherwise be by 2100, a range of
studies predict.
Yet a consensus is emerging that fossil fuels, particularly coal, will
remain abundant for a long time -- and that as long as they're around,
they'll be burned. "It's just too cheap and easy to do otherwise," Dr.
Lackner says.
The upshot is a race to find a technological fix that lets the world keep
burning fossil fuel without heating up the planet.
Wind and solar power and a re-emergence of nuclear power offer potential
help, but they face major political and economic challenges. In the U.S.,
renewable energy's share of total energy consumption is expected to remain
about the same for the next quarter century, the Department of Energy
predicts. In 2001, that was about 6%.
Governments and industry around the world are pursuing two technological
tracks for fossil fuels. One is aimed at improving efficiency, reducing
the amount of fossil fuel that has to be burned. The other is to find a
way to safely dispose of the huge amounts of CO 2 that still will be
produced, before those gases waft up into the atmosphere.
These ideas are the motivation for the Bush administration's main
climate-change response, a $1 billion, 10-year research project dubbed
FutureGen, intended to help the U.S. electric industry develop a "clean"
coal-burning power plant. Not only would it burn fuel more efficiently,
but rather than piping CO 2 into the air, the plant would be hooked up to
a separate system to inject CO 2 underground, where it could be stored
permanently.
Scientists at the Earth Institute, a research center at Columbia, don't
think these steps are going nearly far enough, or fast enough. China is
expected to add immense new coal-burning capacity to meet its energy
needs, but if it builds conventional plants they will only add to climate
problems for decades. "These are not hypothetical issues for the future,"
says economist Jeffrey Sachs, director of the Earth Institute.
Columbia has plans for a $200,000 international prize for ideas on how to
keep CO 2 below 550 parts per million. And the school says it will launch
a roundtable made up of business, environmental and political leaders to
discuss long-term strategies. Dr. Sachs has begun reaching out to leaders
to join the group, and within three years hopes to see "serious
convergence" around some key ideas.
Ways to capture CO 2 and store it are expected to be a centerpiece of any
plan, and so Columbia is also backing Dr. Lackner. He was among the first
to propose "zero-emission" coal plants, an idea now endorsed in a
less-ambitious form by FutureGen. Dr. Lackner believes it may be necessary
by midcentury to begin removing tens of billions of tons of carbon dioxide
from the atmosphere.
That's the reason for the small wind-machine demonstration plant in
Tucson, which is so far funded privately by billionaire Gary Comer, the
founder and former chairman of Lands' End clothing. The project is partly
a technology demonstration, and partly a "backstop" in case all else
fails, says Wallace Broecker, dean of Columbia's climate researchers.
Whether the Tucson project will fly or fizzle is anyone's guess, and some
experts give it low marks for practicality. But the spirit motivating it
-- that seriously curbing global warming will require some very bold
technological steps -- is beginning to wield broad influence.
Already, talks on what comes after Kyoto are heating up. The Pew Center on
Global Climate Change, an Arlington, Va.-based nonprofit group, has
launched a series of closed-door discussions on the subject among
corporate and political leaders from around the world. Russia's possible
ratification of Kyoto "requires that people start thinking about what
comes next," says Eileen Claussen, the Pew Center's president.
Exxon Mobil Corp. is spending $100 million over 10 years on global-warming
research at Stanford University. General Motors Corp. is spending about
$500,000 to fund a Duke University program on research into fuel-cell
vehicles that would run on hydrogen. BP is spending $15 million and Ford
Motor Co. is spending $5 million to help fund research at Princeton
University into ways to reduce CO 2 emissions from burning fossil fuels.
That's much the same thinking that motivates Dr. Lackner's research at
Columbia: acknowledging the necessity of fossil fuels, while proposing a
relatively "painless cure" for the CO 2 problem they cause. "The
do-nothing argument has become that fixing the climate will be just too
expensive, and we're trying to show that it's not," says Dr. Lackner.
Dr. Lackner, who was raised in Germany and moved to the U.S. to work on
physics experiments in California and at New Mexico's Los Alamos National
Laboratory, has a history of hatching big-picture ideas. In the
early-1990s, he developed a proposal for solar-powered robots called
"auxons," able to carry out a host of industrial processes. Thinking about
what jobs such robots could do, Dr. Lackner hit on the idea of removing
carbon from the atmosphere by combining it with minerals.
Nature already performs a similar task, albeit at a slow pace, as air
moves over the surface of the earth. CO 2 in the air reacts with some
minerals to form carbonates, such as soda ash. Dr. Lackner believes if the
reaction was sped up, it could be used to capture large amounts of carbon
pollution inside rocks, which could then be disposed of by dumping them
down mineshafts.
Some colleagues view Dr. Lackner's ideas as unproven, and possibly
unworkable. Massachusetts Institute of Technology's Howard Herzog, an
engineer and expert on underground storage of CO 2, assessed one of Dr.
Lackner's plans last year for a group of energy companies. While Dr.
Herzog's report called the idea "seductive," he concluded it would require
so much energy it may actually create additional CO 2 instead of reducing
it.
Dr. Lackner disputes Dr. Herzog's calculations, but concedes only a
demonstration can prove doubters wrong.
Searching for someone willing to test his ideas, he corresponded with
Allen Wright, an engineer at the environmental research station Biosphere
2, in Oracle, Ariz. The domed facility had already become something of an
accidental laboratory in carbon chemistry. The dome's first group of eight
full-time residents had faced unusual atmospheric conditions after CO 2 in
the air began reacting with the facility's 100,000-square-feet of concrete
flooring.
Columbia had been funding Biosphere, but in September 2003 cut its ties
completely following a legal fight with its owners. That freed up Mr.
Wright to discuss how to build a prototype with Dr. Lackner. Plans to seek
grants to construct a demonstration on Columbia's New York campus quickly
changed after Lands' End's Mr. Comer learned of the idea. Since selling
the apparel company to Sears Roebuck & Co. for $2 billion in 2002, Mr.
Comer has become a major source of private funding for climate scientists,
and he agreed to put $5 million into the carbon project in $1 million
installments over five years.
In March, the new company, Global Research Technologies, jointly owned by
Mr. Wright and Mr. Comer, moved to an industrial park, where they have
been testing a variety of ideas, many supplied by Dr. Lackner who remains
closely involved. Mr. Wright built a 40-foot wind tunnel out of plywood
and plastic to test prototype devices. Since CO 2 exists in air at very
low densities, a key engineering challenge is creating a system of filters
that can maximize contact between the air and an absorbent liquid used to
soak up the gas.
The engineers are now focused only on the problem of efficient
air-capture. What to do with the CO 2 once it is caught is another
problem. It could be compressed and then buried in wells underground or,
as Dr. Lackner prefers, combined permanently with rocks.
Dr. Sachs, the Earth Institute director, believes if world governments
took up similar carbon-storage projects progress could be surprisingly
rapid. "What's special about this technology is that no one has really
worked on it," he says. "There hasn't been any intrinsic interest in
managing carbon, because CO 2 is harmless, odorless and uninteresting from
every point of view except that it could wreck the global environment."
Climate Control - Kyoto Plus What Else?
Stormy is correct. Everything should be put on the table.
It's time to stop whining and focus on every possible solution.
We know which primary climate control initiatives are being considered at this time. We can roll up most of the limited package up and call it Kyoto Plus. While focusing on overall reduction of emissions is important for air quality, global warming (or cooling), and species preservation among other considerations, it's obvious that more has to be done to achieve such goals.
Kyoto has plenty of built-in limitations, particularly among nations not included in the list of developed economies. The rate of improvement on holding the line with emissions output may not be enough to address the overall global problems.
It's my judgment that the existing efforts are inadequate if the goal is to save the polar caps. So, I focused some attention on that issue. And offered one solution. But it's not a solution that should be viewed in isolation. Instead, supplementing the current rate of ice sheet, ice pack, and glacier growth with mechanical hydrology support will be only one component of a broad program of global initiatives. Some will work well, and others will not. That is to be expected. But taken as a package, the collective effort may turn the corner. And that's the goal.
We only have a few global initiatives in play. Why is that the case? Because we haven't taken our thinking far enough. Yes, there are global climatologists, mechanical engineers, and other scientists out there somewhere kicking around advanced thinking on climate control. And we don't have access to most of their new ideas, whatever they may be. But the general thinking by various groups and individuals should be flowing into the public domain. Now, if that is happening, then it's clear that few other major initiatives are under active consideration.
In the meantime, we can mount an exercise on some of the blogs to build a list of possible solutions. Just brainstorm the project and avoid the error of knocking down ideas as they are placed on the table. That's the key to effective leadership. Don't stifle free spirited thinking at this stage. We're not far enough along to whittle down the list. There's only a handful of ideas being floated.
All one has to do is look at the following chart. It's very clear that other initiatives will have to be undertaken along with Kyoto Plus.
Figure 8 - Global Carbon Emissions, 1990-2100
http://www.accf.org/images/Test399Fig8.gif
Others, willing to think big and outside of the box are considering initiatives such as this:
Climate Control Requires a Dam at the Strait of Gibraltar
http://www.agu.org/sci_soc/eosrjohnson.html
Scalar Electromagnetics and Weather Control
http://homepages.ihug.co.nz/~sai/Beard_wmod.htm
scalar potential interferometer & artificial EM fields
http://physics.nad.ru/engboard/messages/1073.html
Paint all roofs white (or require use of materials resulting in white roofs)
* As stated by wkwillis on this blog post at 9:09 AM EST, Tuesday, Feb 21.
** He's right. Similar new or additional reflectivity initiatives need to be undertaken on other objects.
PLANET EARTH HEAT PUMP
The planet operates like a heat pump. There are three primary thermostats managing this heat pump - northern cap, southern cap, and the Isthmus of Panama, along with the oceans' capacity to store heat (seawater stores heat very well; considerably more efficiently than air).
We know that the northern cap is likely to collapse much quicker than the southern cap. It's happening now. So, experts from a variety of fields and disciplines need to burn the midnight oil focusing immediate attention on multiple solutions to save the northern cap. To sit around and watch the cap melt away is simply stupid. It still has the capacity to freeze water. So, at a minimum, we should be adding ice to the northern cap via mechanical hydrology means. If that requires building the largest man-made pumps and support operations ever undertaken, so be it. We've tackled massive projects previously. Against a backdrop of insurmountable odds. That has NEVER stopped the peoples of the world from accomplishing astonishing projects in the past. The only thing that stops collective thinking which can drive major project initiatives are those who resist all new ideas or whine about the obstacles.
CHANGES IN POLAR ICE CONCENTRATIONS
Goddard Space Flight Center
April 22, 2002
http://www.gsfc.nasa.gov/topstory/20020418aqua4.html
Kyoto will not cut it. We must do more.
Let's put everything on the table, including the kitchen sink.
--
Perhaps we do need to try some mechanical hydrology to recreate vanishing ice. I do accept the counter arguments that Stuart and others have made but it is another potential weapon in our armory and worth trying. I would add the proviso that the energy used to do it must be carbon neutral. White rooves, perhaps with some solar water heating, maybe even lighter coloured crops, something to lighten ocean water surface, screens at Lagrange point, we should analyse and trial all.
I disagree about Kyoto, though. The main reason it is weak is it was made so to accomodate USA, it was the best that was practical while USA could be kept on board. Then USA went and ruined that. It was always seen as a statement by the primary greenhouse emitters that they would begin to stabilise, limit and start to reduce their emissions. Once that has been demonstrated the next stage involving limitations by developing nations could commence.
I am damned annoyed by US idiots saying that the greatest growth in emissions is due to developing nations. The per capita emissions by Europe and Japan are half or less than US, and China emits less than a twelveth of US per capita, India even less. If the US refuses to limit emissions HTF (How rather than What in WTF) can one expect countries emitting less than 10% that per capita to limit theirs?
Of course we must do more than Kyoto, that was evident to everyone at the time, Kyoto was just the establishment of the principle - and the US torpedoed it.
The issue needs that level of attention and effort.
No question.
THE ANSWERS HAVE BEEN TURNED IN - IT'S TIME FOR ACTION
There should be no question whatsoever that we must undertake a Manhattan Project to coordinate a global effort to add ice to the northern polar cap. There are plenty of other environmental initiatives that divert attention and funds away from this issue, but it's clear that many are missing the big picture. We have to save the northern polar cap. Quickly. We have no choice. I state again that reducing the existing emissions levels will not solve the immediate problem.
We must concentrate a full scale effort on stabilizing the ice sheets and glaciers in the northern cap region. We have to add ice. Period.
Cleaner Air Aids Global Warming
http://www.cbsnews.com/stories/2005/12/27/tech/main1166599.shtml
New measurements of tiny particles in Earth's atmosphere contain a sobering message: All those hard-won efforts to cut air pollution may unwittingly accelerate global warming.
The result: The planet is likely to warm more and faster than current projections suggest, according to a team of British and American scientists.
The group has produced the most precise estimates yet of how tiny particles, known as aerosols, could affect the world's climate. Aerosols, which include pollutants, have a cooling effect on the atmosphere, and the team's work suggests that the cooling effect is strong - nearly as strong as the top estimates of the United Nation's Intergovernmental Panel on Climate Change (IPCC).
Thus, the dwindling presence of aerosols means that global average temperatures could rise faster than previously estimated and reach toward the high end of projections for the end of the century.
Those estimates currently range from 2.7 to 7.9 degrees F., depending on how emissions of greenhouse gases and other factors play out in coming years.
A Global Warning
60 Minutes
http://www.cbsnews.com/stories/2006/02/16/60minutes/main1323169.shtml
Excerpts:
"The entire planet is out of balance," says Bob Corell, who is among the world's top authorities on climate change. He led 300 scientists from eight nations in the "Arctic Climate Impact Assessment."
Corell believes he has seen the future. "This is a bellwether, a barometer. Some people call it the canary in the mine. The warning that things are coming," he says. "In 10 years here in the arctic, we see what the rest of the planet will see in 25 or 35 years from now."
Over the last few decades, the North Pole has been dramatically reduced in size and Corell says the glaciers there have been receding for the last 50 years.
There's long been a debate about how much of this is earth's naturally changing climate and how much is man's doing. Paul Mayewski, at the University of Maine, says the answer to that question is frozen inside an ice core from Greenland.
Mayewski says we haven't seen a temperature rise to this level going back at least 2,000 years, and arguably several thousand years.
As for carbon dioxide (CO2) levels, Mayewski says, "we haven't seen CO2 levels like this in hundreds of thousands of years, if not millions of years."
What does that tell him?
Even if we stopped using every car, truck, and power plant -- stopping all greenhouse gas emissions - Mayewski says the planet would continue to warm anyway. "Would continue to warm for another, about another degree," he says.
That's enough to melt the Arctic - and if greenhouse gases continue to increase, the temperature will rise even more. The ice that's melting already is changing the weather by disrupting ocean currents.
One big supporter of climate science research is the Bush administration, spending $5 billion a year. But Mr. Bush refuses to sign a treaty forcing cuts in greenhouse gases.
"When you look at the American government, which is saying essentially, 'Wait a minute. We need to study this some more. We can't flip our energy use overnight. It would hurt the economy.' When you hear that, what do you think?" Pelley asked.
"Well, what I do then is, I try to tell them exactly what we know scientifically. The science is, I believe, unassailable," says Corell. "I'm not arguing their policy, that's their business, how they deal with policy. But my job is to say, scientifically, shorten that time scale so that if you don't push out the effects of climate change into the long, long distant future. Because even under the best of circumstances, this natural system of a climate will continue to warm the planet for literally hundreds of years, no matter what we do."
Northern Polar Cap Manhattan Project (NPCMP)
The plan is to actively solicit Congressional support from both houses for creating a new Manhattan Project which will focus national funding, resources, and potential solutions directly on the restoration of the northern polar cap.
A successful sponsoring bill will require 150-250 sponsors (Congressional Members who sign on), so the undertaking is not a mild exercise. It may require reintroduction in a number of successive Congresses to reach passage. One can expect a 1-5 year window prior to successful passage, depending on the level of citizenry and corporate ramp up that pushes for the legislation.
There is a high probability that the Bush Administration would support such legislation once the merits were addressed.
If the United States of America can fund a war campaign of the financial magnitude that we're now committed to, then we have the capacity and means to set up a Northern Polar Cap Manhattan Project (NPCMP) devoted to avoiding a global disaster as will be created once the northern polar cap vanishes.
It's my judgment that the project should undertake a multitude of critical actions, one of which would be to establish a multiple location hydro mechanical watering operation, the responsibility of which would be to repair ice sheet damage, generate new water flow to build additional ice sheets, and undertake additional actions which would help slow the meltdown of the ice cap. The goal is to repair the northern polar cap while it still exists, as the absence of a working platform compounds the problem. Similarly, such NPCMP operations need to be undertaken in Greenland, and other deep cold locations.
There will plenty of detractors, but that is to be expected. The people who will dismiss this idea are not the leaders who got us to the Moon, built the largest dams and bridges in the world, or dug the Panama Canal.
This project takes real leadership. The call to go forward with the Congress is the first. Thereafter, seasoned professionals from a number of fields (mechanical engineering, hydrology, climatology, Corps of Engineers, et al) will take the helm at the direction of the Congress and whatever Administration is serving at the time the Northern Polar Cap Manhattan Project (NPCMP) is authorized as a federally funded and managed project.
I roughed out the basic concept here:
MG
http://www.theoildrum.com/story/2006/2/3/0394/97545#111
MG
http://www.theoildrum.com/story/2006/2/3/0394/97545#162
Stormy's post
http://www.theoildrum.com/story/2006/2/3/0394/97545#169
MG
http://www.theoildrum.com/story/2006/2/3/0394/97545#172
Unfortunately I estimate the likelihood of anything like it happening soon enough to make significant difference is barely more than that of the whole of North America sinking suddenly and silently beneath the sea. But that would only be a temporary solution, LOL, what needs to be fixed is the human mindset.