Science 1101 Part 1: The Science of Oil and Peak Oil Revisited
Posted by Gail the Actuary on June 20, 2010 - 10:37am
This is a repeat of a post from February 2008.
In this article, I provide Peak Oil science curriculum suitable for introductory college science classes, advanced high school classes, and adult seminars. The material requires a little background in high school chemistry, but otherwise does not have any pre-requisites. There is sufficient material for a two to four session unit on peak oil.
The written material is divided into Part 1: The Science of Oil and Peak Oil (in this article) and Part 2: Oil as a Liquid Fuel and Expected Peak Oil Impacts (found at this link). There are also discussion questions at the end of Parts 1 and 2, and numerous links to other references. A PDF version which contains both Part 1 and Part 2 can be found at this link.
1. What is petroleum?
Petroleum (also called oil) is a viscous liquid that is found beneath the earth’s surface that is refined to make fuels, plastics and other goods. Oil is not found in large pools. Instead, it is generally trapped in the pores of sandstone or other porous rocks. It is often found with natural gas, which is formed under similar conditions.
Petroleum is not a single compound. Instead, it consists of a mixture of hydrocarbon chains of different lengths, ranging from about C5H12 to C42H86. It also contains some associated hydrocarbon gasses, with 1 to 4 carbon molecules. When petroleum is burned, the hydrocarbon chains plus oxygen are transformed into CO2 (carbon dioxide) and H2O (water), and energy is released. Carbon dioxide is one of the major gasses implicated in global warming.
2. How was petroleum formed?
Petroleum was formed millions of years ago from the remains of small plants and animals that lived in seas or lakes. These plants and animals died and fell to the bottom of the sea. Gradually, layers of silt and sediment covered their remains, causing great heat and pressure to build up.
Under this heat and pressure, a chemical reaction took place, transforming the hydrogen and carbon from the decaying plants and animals into the mixture of hydrocarbons that we know as petroleum. This petroleum is found in only a relatively small number of places in the world, where conditions were precisely right for its formation.
3. Is new petroleum now being formed?
Not in any measurable quantity. Once we use up the petroleum that was formed millions of years ago, it will be gone for good.
4. Aren’t we continuing to discover more and more oil every year?
No. Once we started looking for oil, we found more and more oil for a while, but then new discoveries started to drop off, as more and more of the world was explored. This is shown in Figure 1, below. We are continuing to discover oil, but the quantity discovered now is much smaller than it was years ago, and much smaller than we are now using. (In all of these charts, the amount of oil is measured in barrels. A barrel is equal to 42 gallons or 158.984 liters. The total quantity is huge!)
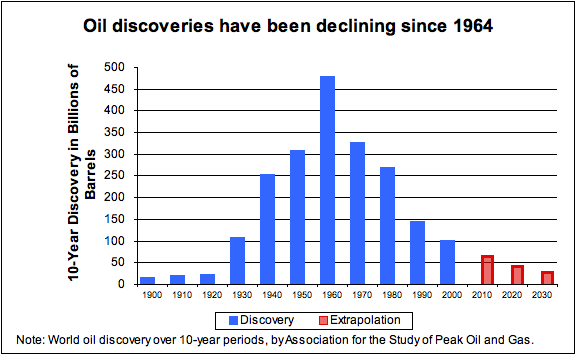
We often read in the news about finding new fields, but these fields tend to be smaller and harder to reach than those discovered in the past. We are now so concerned about finding oil that even small discoveries are reported as news.
Figure 1 does not include oils that are not liquids, like the Canadian oil sands. There are large quantities of these, but extraction is extremely slow. It is doubtful that they will ever become a significant share of world oil production.
5. How is petroleum extracted from the ground?
Petroleum is generally extracted by drilling oil wells in areas where there is some reason to believe oil might be located. When oil is first found, it often comes from the ground very quickly, under great pressure. Gradually, the oil comes out more and more slowly. This happens partly because the oil pressure drops, and partly because the oil that is extracted from the ground tends to be mixed with more and more water, as more oil is removed from the ground. Many US oil wells produce more than 99% water.
In some places, such as the Canadian oil sands, a very viscous form of oil is found. This is mined, rather than extracted using oil wells. Production of such oil tends to be very slow and expensive.
6. Is all of the oil in a given area removed by the use of oil wells?
No. As noted in Item 1, oil is generally found trapped in the pores of porous rock such as sandstone or limestone. The rock is somewhat like a hard sponge, with a goey liquid trapped inside. This oil is very difficult to get out of the rock. If wells are used to collect the oil that seeps out of its own accord, typically only 10% to 30% of the oil originally in the rock can be removed.
Various methods of enhanced oil recovery have been developed to increase the percentage of oil that can be removed. One approach uses water injection to increase the pressure in the well. In another approach, carbon dioxide or some other gas is injected, to force some of the trapped oil out. In one newer process, microbes are used to break up the oil droplets into smaller pieces, so that they can more easily be removed. One method under development uses an underground fire to heat the oil, so that it will become more liquid and drain out of the rock (Microbial Method: http://www.titanoilrecovery.com/ Water injection: http://en.wikipedia.org/wiki/Water_injection_(oil_production) Underground fire: http://www.theoildrum.com/node/2907 )
Usually, even with enhanced oil recovery, not more than 50% of the oil originally in place can be removed. Often the percentage is quite a bit less than 50%. Some of the newer enhanced oil recovery methods offer the possibility that this percentage may be raised in the years ahead.
7. Can an oil company produce a constant amount of oil in a given location?
No, it generally doesn’t happen this way. When a single oil well is drilled, production very often quickly reaches a peak, and then tapers off over a several-year period, as oil pressure drops and the amount of water produced increases.
When we look at production from all of the wells in a given geographic area, production generally increases for several years, as more and more oil wells are drilled. One by one, wells begin to decline, and new wells are drilled. Eventually, there are not enough new places to drill additional wells, and overall production starts to decline. (See Figure 2, below.)
US oil production for the 48 states excluding Alaska and Hawaii reached its peak in 1970. Once energy companies realized that production was declining in the US 48 states, they looked for new locations where oil might be extracted. Alaska had oil, but it was difficult to transport oil out of Alaska without a pipeline. The necessary pipeline was completed in 1977. Production reached its peak in 19888, and has been declining since then.
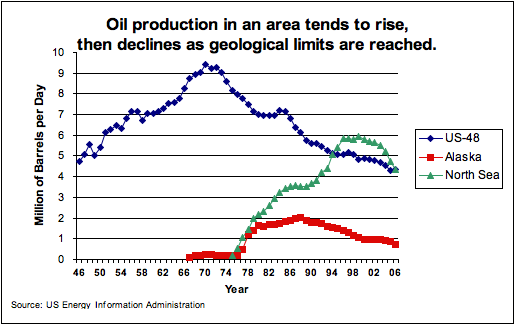
Oil production was also begun in the North Sea, near Norway and Great Britain, but this too soon reached a peak. North Sea oil production has been declining since 1999. All of these declines have taken place in spite of new technology and improvements in oil recovery methods.
Oil is also produced in many other parts of the world, but oil recoveries are starting to decline in many of these areas as well. At this point, much of the world’s “easy to produce” oil has been removed. New oil production tends to be in difficult areas, like deep-sea locations.
8. Will world oil production reach a peak and begin to decline? If so, when?
Since oil is a finite resource, we know that production must eventually decline. There is considerable disagreement as to when this decline in production will occur.
The US General Accountability Office (GAO) released a report in March 2007 titled, “Uncertainty about Future Oil Supply Makes It Important to Develop a Strategy for Addressing a Peak and Decline in Oil Production.” This report indicates that decline is likely to begin sometime between now and 2040. The United States Association for the Study of Peak Oil indicates that the peak and decline is expected to occur prior to 2015.
Even oil companies are beginning to talk about the possibility of future production falling short of demand. This wouldn’t necessarily be a decline; it might be a plateau or slight increase. Shell Oil says, “After 2015, easily accessible supplies of oil and gas probably will no longer keep up with demand.”
(GAO Report: http://www.gao.gov/new.items/d07283.pdf Shell Oil statement: http://www.shell.com/home/content/aboutshell-en/our_strategy/shell_globa... National Petroleum Council 2007 report “Facing the Hard Truths about Energy” http://www.npchardtruthsreport.org/
Canadian Business article: http://www.canadianbusiness.com/columnists/jeff_sanford/article.jsp?cont... )
9. How are estimates of the date of peak production made?
There are a variety of methods. In 1956, M. King Hubbert correctly forecast that oil production for the United States was likely to reach a peak and decline about 1970. Estimates from that time period put the peak in world production at about 2000. Because of efficiency increases and energy conservation efforts that were put in place during our previous energy crises, growth in oil usage slowed and the date of the peak was pushed back. http://www.hubbertpeak.com/hubbert/1956/1956.pdf
Besides using techniques similar to Hubbert’s, estimates now consider additional types of information, including new projects being planned and decline rates on existing fields. Another consideration is the fact that it been very difficult to increase oil production in the past few years. Oil production since 2005 has been flat, in spite of increasing prices. Oil companies are having difficulty finding more oil reserves to replace those used by extraction of oil during the year.
The organizations with the highest estimates tend to put greatest reliance on published reserve estimates of the major oil exporting nations. These amounts are not audited. There is increasing evidence, including Google satellite information, that these amounts are inflated. Exporting nations look more powerful if they report high numbers, so there is a temptation to report optimistic amounts. http://www.theoildrum.com/node/3574#more
10. Can outside factors make a difference in future production?
If every country had infinite resources, and chose to put them all into oil production, it is likely that oil production would be higher than it is. In the real world, that is not the way it is, though.
One limitation is the supply of trained geologists and engineers. The energy field has been stagnant for many years. Many people trained for the oil and gas have left the field, because of frequent boom and bust cycles. Of those remaining, a disproportionate number are near retirement age.
There are also limitations on physical infrastructure. There is a limited number of drilling rigs, especially those needed for the very deep-sea locations now being explored. The forces of supply and demand drive up costs for these rigs, making projects more expensive. Other infrastructure items are in similarly short supply. Companies do not have infinite budgets, and can’t use equipment that is not available, so projects get pushed back.
Another factor is the influence of foreign governments and of government sponsored oil companies around the world. One estimate is that only 7% of the world’s oil reserves are in countries that allow “International Oil Companies” (companies like ExxonMobil, Chevron, and Total) free reign.
Wars and civil disorder can affect production. The production of Iraq and Nigeria have clearly been affected by fighting of various types.
One factor that has the potential to help future supply, or at least soften the down slope, is technological advances. For example, some of the newer enhanced oil recovery methods may have promise. Putting them to work on old fields could be done, but it would not necessarily easy. In many cases, oil rights would need to be obtained from current owners, and new wells drilled. This would be expensive.
11. How certain are future petroleum imports?
Not very. Oil imports comprise about two-thirds of US petroleum use. The amount of future world production is uncertain, and the portion available for import is even more uncertain. Oil exporting countries want to keep their own populations happy. This often means increasing use of oil within the country, at the expense of exports. Also, if it becomes clear that there will be a shortfall in world production, exporting countries may decide to hoard the oil they have, saving it for the future when it is likely to sell for an even higher price.
Another concern is a possible drop in the value of the dollar, because of difficulties within the US financial system, or because of balance of payment problems. If the value of the dollar should decline, oil will be much more expensive, so it will be difficult to buy as much.
Figure 3 below shows US crude oil production. It has been decreasing at about 2.1% peer year.
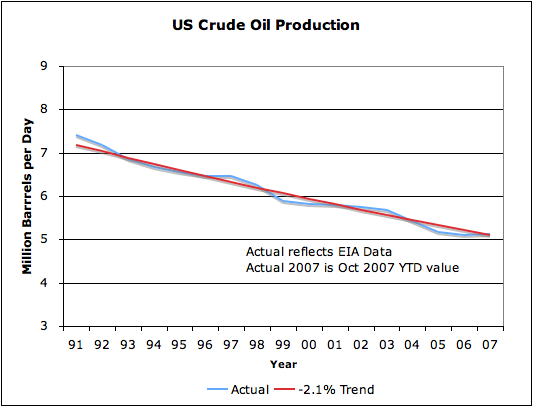
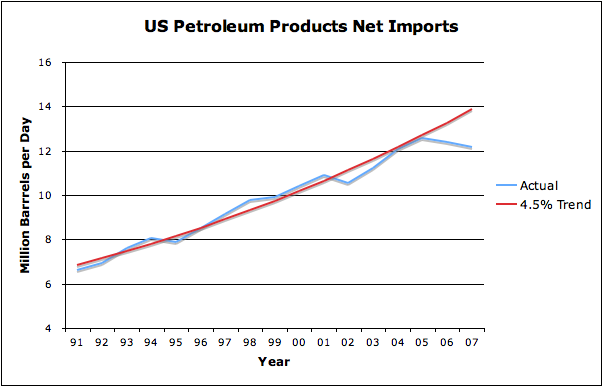
Figure 4 shows US imports of oil and finished products, like gasoline. These were rising at about 4.5% a year, but declined in 2006 and 2007. World oil production has been flat since 2005. (See Figure 5, below). With no increase in world production, it has been harder for the US to find oil to import, and the price of what we have been able to find has been higher.
12. Does the date of the peak matter?
We have already reached the point where oil is in short supply. Because of this, we need to find ways to conserve, and to find alternative energy sources. The actions we need to take are pretty much the same, whether the peak in the world’s oil production is now, or in 2040.
Also, any governmental action taken to change our oil usage, or to find alternatives, is likely to take many years to implement. For example, if manufacturers start making cars more fuel efficient, it will take many years before all of the old fuel-inefficient cars can be replaced. For this reason, we need to start taking action well before the peak.
(See “Peaking of World Oil Production: Impacts, Mitigation, and Risk Management” by Robert Hirsch, Roger Bezdek, and Robert Wendling for US Department of Energy (2005) http://www.netl.doe.gov/publications/others/pdf/Oil_Peaking_NETL.pdf )
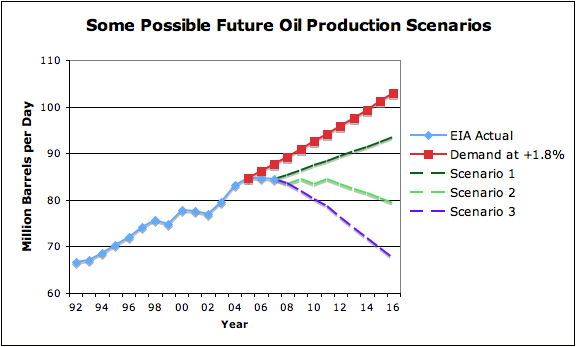
The blue line Figure 5 shows recent oil production trends. Oil production has been on a plateau for three years, since 2005. The line “Demand at +1.8%” gives an idea of how much oil the world would like to use, if it is actually available, at a reasonable (2005) price. It assumes 1.8% per year growth. Scenarios 1, 2, and 3, give three (of many) possible directions future oil production may follow. Even if a fairly optimistic scenario like Scenario 1 occurs, there is likely to be a significant gap between demand and supply.
13. What is petroleum used for?
The vast majority of oil is used as fuel, of one type or another. Figure 6, below, shows that largest share (46%) of US oil usage is for gasoline. The next biggest slice is “distillate”, with 20%. Distillate includes diesel fuel (used in trucks and many types of equipment) and home heating oil (used primarily in the Northeast). Petroleum is also used as jet fuel, and as fuel for boats, so it provides the vast majority of the transportation fuel used in the United States. It also provides asphalt for our roads, and lubricating oils for engines.
The “All Other” category is quite small on the graph, but includes most of the chemical uses for petroleum. Products made using petroleum as a feedstock include plastics, synthetic fabrics, dyes, pharmaceutical drugs, detergents, insecticides and herbicides, and many other products we use every day.

In some parts of the world, petroleum is used to produce electricity. In 2006, only about 2% of US power generation was from oil. http://www.theoildrum.com/files/Generation%20by%20State%20by%20Type.png
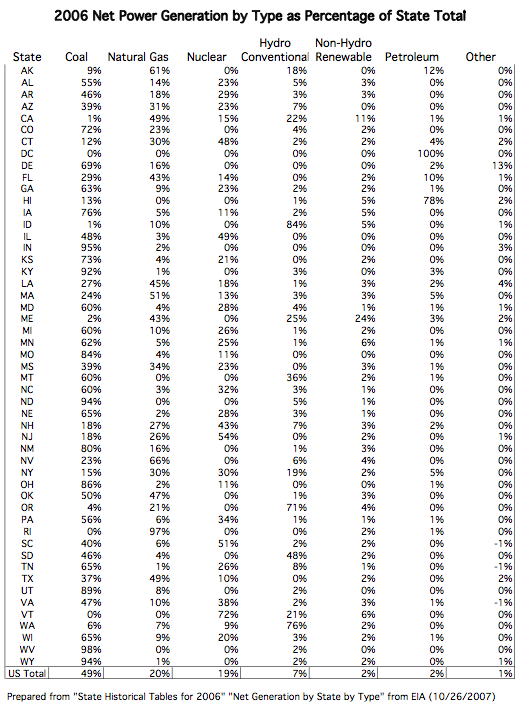
14. How is petroleum processed to obtain its major products?
Petroleum is sent to a refinery, where it is processed to remove impurities and to separate it into its component parts. As we noted earlier, petroleum is a mixture of different hydrocarbons ranging from about C5H12 to C42H86. These hydrocarbons have different properties, including different boiling points and different viscosities. Very short chains, containing 1 to 4 carbon molecules, are gasses at room temperature. Chains with 5 to 10 carbon molecules are thin liquids that boil at low temperatures. The longest chains are asphalt or bitumen. Asphalt is very viscous and has a very high boiling point.
During refining, a process called fractional distillation is used to separate out the mixture into components. Petroleum is heated to a vapor, and then allowed to condense in a tower containing trays at different levels. Because the shorter hydrocarbon chains boil at lower temperatures than longer chains, this process can be used to separate petroleum into its component parts. The lighter the fraction, (that is, the fewer carbon molecules in the chain), the higher up it condenses.
For further discussion see “How Oil Refining Works” on HowStuffWorks.com (http://science.howstuffworks.com/oil-refining.htm )
15. Is petroleum from different locations the same?
No. Some petroleum is “light” – that is, composed mostly of the shorter chain hydrocarbons. Other petroleum is “heavy” – that is composed mostly of longer chain hydrocarbons. Some is even “very heavy”. Oil also differs in the amount of impurities. The highest quality (and highest priced) crude oil is light oil, with few impurities. The lowest priced crude oil is heavy oil, with many impurities.
The reason that light oil is prized is because when fractional distillation is used, it yields a high proportion of gasoline and diesel fuel, and relatively little asphalt and other lower priced products. When fractional distillation is used on heavy oil, it tends to yield a high a proportion of asphalt and other low priced products. A process called “cracking” can be used to break very long molecules into shorter, more commercially valuable molecules, but this process is expensive, and requires specialized equipment.
The amount and types of impurities in crude oil is also important in determining the selling price of crude oil. Special processes, available only in certain refineries, may be needed to remove certain types of impurities. In some cases, it is necessary to build a refinery especially for oil from a particular location, so as to have the proper equipment to remove the impurities from the oil.
Some of the oil that has not yet been extracted is oil with difficult to remove impurities. This oil was bypassed in the past as too difficult to process. Saudi Arabia has some oil that it is not extracting because a refinery has not yet been built to handle the impurities.
16. How is oil transported from place to place?
When crude oil is found in a location, it must be transported to a refinery for processing. There are two major ways this is done. One is by “oil tanker” (type of ship). The other is by pipeline. When oil is discovered in a remote location, new pipelines often must be built before production can begin so as to have a way of transporting the oil once it is extracted. This is costly, and may take several years.
Once the oil is refined, the refined products are again shipped by pipeline to a location near where they will be used. Trucks are generally used for transportation to the final customer.
It might be noted that each pipeline has both a maximum and a minimum flow rate. If production or use drops too much in an area, its pipeline may no longer be usable.
One exception to the use of pipelines for transport occurs for gasoline with ethanol. The gasoline base is shipped by pipeline, but ethanol cannot be shipped by pipeline, because it tends to absorb water. Ethanol must therefore be shipped by other means (railroad, barge, and /or truck) to a location near where the gasoline will be sold. There, ethanol is blended with the appropriate gasoline base to make gasoline. After it has been blended with the base, it is shipped by truck to the retail location where it is sold. This whole process is expensive and difficult to co-ordinate.
Part 1 - Discussion Questions
1. In 1957. Rear Admiral Hyman Rickover gave a speech in which he talked about the expected peak of oil and gas production in the first part of the 21st century, and the likely decline of coal toward the middle of the 21st century. He also talked about the need to tell young people, and to start planning for the difficult transition that likely lay ahead. http://www.theoildrum.com/node/2724
Why didn’t people take his advice?
2. In 2007, there was considerable publicity about the Tupi field in Brazil. According to newspaper articles, Tupi may transform Brazil into a major oil exporter. When you read further, you find that the oil field is nearly 200 miles off shore, and is at record depths. Furthermore, the oil is found beneath layers of rock and salt.

The salt is unstable to drill through. A problem with thermal shock is expected when oil is extracted because the temperature of the oil in the reservoir is expected to be nearly 100 degrees Celsius, while the water above the rock is expected to be 4 degrees Celsius. In order to extract the oil, new technology will need to be developed to drill this deep and to overcome the problems of the unstable salt layer and of thermal shock.
Also, some means of transporting the material extracted will be needed. Because natural gas will be included, the usual method would be a pipeline, but the distance will be a challenge. Therefore, the company is considering building a floating liquefied natural gas to liquid plant, so that tankers can transport both the oil and liquefied natural gas.
The expected oil production from Tupi is large relative to recent discoveries, but not large relative to the amount of oil we need to discover each year. At full development, Tupi is expected to produce 500,000 to 1 million barrels a day. This is equivalent to 2.4% to 4.8% of the United States' current daily oil usage, or 0.6% to 1.2% of world usage. Just to offset declines in existing fields, we need to discover 5 to 9 fields the size of Tupi each year.
a. What probability would you assign to this project actually succeeding?
b. The company hopes to have initial production by 2013. Given the technology and infrastructure issues, how likely does this seem? Would you be surprised by setbacks?
c. If this is the major discovery of the year, what does this tell you about other discoveries?
To read about Tupi (not needed for exercise)
http://www.theoildrum.com/node/3269
http://www.iht.com/articles/2008/01/11/business/oil.php
http://www.afxnews.com/about488/index.php?lg=en&c=00.00&story=2305842
Contact
- Content: editors at theoildrum dot com
- Tech support: support at theoildrum dot com
License

This work is licensed under a Creative Commons Attribution-Share Alike 3.0 United States License.
Gail,
Thank you for posting this. It should be widely disseminated...it would be great to have teachers present this in schools...but I am afraid that there would be enormous blow-back from some parents who would complain about anti-American, anti-capitalists, etc. etc. propaganda being foisted upon their young impressionable kiddos.
One question:
Do you or someone else here have an updated graph for Figure 5, which I believe is plotted with historical data through 2008? I would like to see how 2009, and 2010 (such that it is) compare to the prediction.
I of course would be one of those parents. But my objections would be based on the factual errors, misrepresentation of what is actually happening in the form of "problem solving", and general implication that these conclusions and speculations qualify as anything remotely resembling science.
For example, the relative common occurrence of oil generation in most sedimentary basins of the world versus its characterization as "small number of places", oil discoveries are, as usual, misrepresented with the standard "only oil we want to count" graph provided by the usual suspects, the quantification of resource extraction without mentioning the direct dependency of flowrate on investment, oil wells under "great pressure" versus everything normally pressured which is quite a bit more common and become even more common with pressure depletion within the reservoir, the water cut representation is completely baseless if any analysis of the IHS data is to be believed, and might only be representative of waterfloods in a few areas at best, 50% maximum enhanced recovery ignores everything going on for the past quarter century in the California heavy oil fields and the technology prototyped as their recovery factors are driven well over 50%, individual oilwells do not "peak" in anything resembling the bell shaped profile offered by Hubbert, the standard declines being quantified by Arps back in the late 1940's, the peak profile has nary a thing to do with geologic limits as implied in the graphic title for Figure 2....and the list continues.
The teachers who would present this thing would in most cases not have a clue as to the actual geoscience issues behind it, good or bad. It is difficult enough teaching our children to think critically without the headwinds of this type of implicit agenda being presented by an authority figure.
I do not like calling teachers or their curriculum out, but when my child brings homework into the house asking for an answer to 12 divided by 0, I become annoyed enough to do just that. The geoscience issues in this presentation are comparable that level of basic confusion on the topic.
Gail this is truly excellent, beautifully illustrated and accessible.
I understand liking pretty illustrations and how accessible anything on the web is, but under what circumstances do you consider it reasonable to say things, even if for the purposes of beautiful illustration, which just aren't the case?
Having read some of your web based materials, it doesn't strike me that you, at the professional level, misrepresent to your clients pr the world in general the actual workings of, say, reserve calculations. Certainly it isn't acceptable where I work, why would it be acceptable elsewhere?
RGR2,
Would you be willing to post a more detailed, Figure-by-Figure and major point-by-point rebuttal/analysis of the Gail's article?
Would you please expand upon your refutation of the idea that geological limits were/are the primary cause of the shapes in the graph in Figure 2? What mechanisms do you offer to explain the shapes of the data plots in this figure?
Do you posit that oil companies and/or the USG are deliberately under-producing from the extant wells and fields in order to make the supply last longer? Do you posit that there is some covert collaboration to withhold production in order to maintain artificially high prices?
Do you accept the premise that all oil wells start production from a rate of zero, then at some point achieve a maximum per-year flow rate, perhaps maintain the maximum flow rate for some period of time, then inevitably experience a decline thereafter in per-year extraction rates? Understanding that various enhanced recovery methods make temporarily slow or even reverse the per-year production rate, but not affect the overall transition from a maximum per-year production peak/plateau to a long tail thenceforth of various slopes?
Willing...sure. Allowed...unlikely. Research and conclusions from it which relies heavily on proprietary datasets alone is itself a deal breaker, until its been approved and appropriated published.
The long version would require 4000 words. The short version is, the geology isn't what defines the shape of production of something dependent on human whims and how it is expressed through our economic systems. It would have been just as easy for humans to make global oil production look like a standard field profile, short ramp up, stable and sustained plateau spanning decades or a century, exponential tail spanning another century.
Surplus global supply by definition means that someone, somewhere, is not producing as much as they are capable of. Pressure maintenance on individual reservoirs a century old fit under your definition for "under-producing". And OPEC is a cartel, certainly nothing covert about its intent, or effects.
Oil and gas wells usually achieve maximum flowrates soon after being put online. They almost NEVER maintain that flowrate for any length of time except under cases of artificial restriction such as tubular size, infrastructure constraints, etc etc. And while they "inevitably" decline, its a perfectly natural effect of their drive mechanism which is not new and isn't a surprise to anyone who has ever produced one. It isn't even inevitable, because you said "well", not reservoir. I have recompleted 30 year old wells and the inevitability of their decline went right out the window, as they created another peak production rate as the new reservoir came online. And I haven't even said the words "secondary" or "tertiary" yet. Certainly nothing is inevitable about a well except its end, someday it will die, become uneconomic, and be plugged. Everything in between is up for grabs.
The basic driving mechanics of wells are about decline, managing it, reversing it, maximum wellbore utilization. Ignoring a single wells ability to access multiple reservoirs is not a factor to be ignored. Petroleum engineers get paid to completely reverse or stabilize the decline of wells whenever possible, by whatever means they have at hand, technical or economic. Reversal of field declines is an aggregation of the work being done at the well level, a point which Hook seems to forget in Natural Resources Research at every opportunity.
Please write the 4,000 word version and then submit it to the editors of TOD. I look forward to seeing that article, and IMO many others at TOD would be delighted to read the article and comment on it. Could you break it down into two 2,000 word articles? That would be better than the 4,000 word block in one big gulp.
Sure. As soon as TOD becomes the online equivalent of the GSA Bulletin I'll consider it.
I googled "Peak Oil" and "GSA Bulletin" and this TOD post that we are writing is the first link I saw.
But then I found this:
That was written in November 2009, so it looks like a very good idea.
Notice how close that parallels what I have written in terms of modifying the presentation. Start with some premise that stimulates critical thinking and improves the students understanding. Then they can use the fundamental scientific analysis to support policy decisions when they graduate. Sounds idealist but that's a college education for you.
Every post you have in this thread has the following tone: "There is so much wrong here, you all are amusingly incompetent, and I refuse to help you, being content to rub your noses in your ignorance." If you are only willing to provide veiled attacks and vague disapproval and very little backup, then what are you doing here?
Better not. His ridiculous comments on the last 'Oilwatch Monthly' leaves you guessing what he is smoking.
Very funny. Put a number on it in barrels and province.
I did not appreciate being called out. We do deterministic reserves estimates and shun "fill to spill." See http://www.cwsx.org/reserves_workflow.pdf
Stacked pay is typical of sand/shale sedimentation. Exploration wells drill to the basement or an ancient horizon to log every formation. The practice of drilling corkscrew holes to intersect multiple bright spots is a waste of money. That's a side issue (I'd much rather have two cheap vertical wells), but it illustrates the perverse psychology of management. What they want is blue sky best case, fudged up from a few shows, without bothering to interpret the geological setting or annoying details like coarsening/fining and basin floor channels.
Nothing wrong with Gail's presentation.
I think it is a good syllabus as well. To make a good presentation, it needs to change the individual questions into statements of scientific principles. What that means is that all the assertions have to be written in terms of a premise backed by a law, or at least a model. Nothing else but a law would suffice for a physics-based approach to the science, and at least a model for engineering or applied math. That would transform the assertions into testable hypotheses.
What Rulz says in the following demonstrates exactly how geology intersects statistics.
Statistically we know that extraction exceeds at a greedy pace (we extract as fast as technically allowable) and that extraction is dispersed across the world. This makes it very predictable once the data start rolling in and we see the effects via the Law of Large Numbers. It is misguided to let geology and technology dictate anything but the unknown constraints and the average rates. The complexity would overwhelm us.
Next comes the challenging part. The students will need to be taught that the data provided is incomplete and held in check by governments and corporations. This is nothing new as, for example, actuarial science relies on incomplete information to fill in the missing pieces of such things as insurance and medical trials all the time. Oil depletion analysis then becomes a study of applied statistics.
So the arc of the course for Part 1 (Oil Depletion) should start with some logical arguments about the geology and constrained resources and then transform into an applied statistics investigation for supporting policy decisions.
The class needs to be taught from the perspective of "what if we were starting from scratch and found a new material resource and had no idea how long it would last", just like "what happens if we had a new medical treatment, and we had no idea of the outcome". Just like with the case of medical research, you start out with real science and then transform it into an applied statistics investigation.
a
I don't understand the amusement. I spent 18 months doing recompletions on that project in the Appalachian Basin. The wells are now 50 years old and still producing from the recompleted zones.
For basic college students? As a science presentation? I'll admit its been a few decades since I was in college, but surely things haven't gotten THAT bad in that length of time.
There are a lot of examples of second peak's, though much lower than the first one. Rulz is just blowing smoke in a crystal clear written article by Gail. And trying to sell pipe dreams of the effects of tertiary EOR in a 'past peak oil world'.
By "Hook" do you mean the fellow from ASPO, Mikael Hook?
Yes.
Gail
ditto
excellent intro
I've bookmarked it in case I have to provide someone with a PO 101 lecture
well done
RGR2,
Thank you for your insights. The 'true' picture of a complex topic such as PO is surely very complex and difficult for non-experts to understand...maybe even difficult for experts to understand and agree-upon.
Have you worked with HO and other staff members here to develop an article or post or to collaborate on producing better, more factual written descriptions charts, graphs, etc? If you have articles posted here or elsewhere I would certainly read them to try to achieve a fuller understanding of the spectrum of data, analysis, and opinion on PO.
Big picture, what is your analysis of the future of oil production? Do you predict that demand will increase by x% per year and that supply will also increase with demand? If so, do you predict that economically recoverable oil is finite?
Maybe the teacher was looking for the students to conduct easy internet-based research come back and provide some information along these lines:
http://en.wikipedia.org/wiki/Division_by_zero
I don't believe that PO requires realigning the goesciences to fit the theory, more the other way around. If we are going to talk about resource depletion correctly, this is an important distinction right out of the gate.
Chris V made me the offer awhile back, yes. Terms of employment preclude it.
It will usually remain 2 to 5 million barrels a day above consumption.
They were not. The curriculum answer was 0. I had to actually write a correct answer in place of the numeric answer requested and told the daughter to hold fast in the face of ridiculous assertions no matter who was making them. She did as instructed and learned a valuable lesson in the process. The teacher had her read my response to the class, and backed it to the hilt. She knew better, just hadn't done anything about it. Maybe the actual people who are supposed to know better were busy trying to find ways to exclude evolution from the curriculum, who the hell knows. Irritated me to no end.
Over what time horizon do you claim your prediction remains valid?
The way you phrased this answer leaves open the possibility that if oil becomes more expensive, and demand drops as a result, then supply will drop in tandem (since supply will be the constant 2-5 MBPD above demand of 'x')...of course this is an application of supply/demand theory, but my question is: Do you predict increasing or at least flat annual World oil consumption, with supply being consistently 2-5 MBPD above that, or do you predict a downward smooth slope or stair-step decline of oil consumption followed by oil supply?
The foreseeable future.
I did not answer your future oil production question in absolute terms because I do not believe absolute terms are relevant. If the world requires/consumes 20 million barrels a day, and the world is capable of producing only 25 million barrels a day, that strikes me as a completely reasonable scenario, no matter how fast or slow it got to that configuration. The time component of peak, past (1979), present (2005) or future (?), just doesn't matter.
Real oil prices have been trending higher since about 1969. It could very well continue to do so. I will adapt by using less. So will others. Businesses will have competitive advantages over their peers if they figure out how to use less, just as I will have more disposable income as I do the same. If it turns out that the trend in real crude prices continues, this is a good thing for just the reasons I've expressed in this paragraph.
My personal opinion on the topic is that crude oil is obsolete, and just doesn't know it yet.
RGR2,
Since your employment prohibits your writing of articles, books, etc, can you recommend articles, posts, books, etc. which you think describes more correct ways of describing oil depletion?
I have published domestically and internationally. Perhaps I was unclear. My restrictions relate to the location of those publications. There are appropriate locations, internal use studies for future research directions, preliminary results and writeups, transitioning to peer reviewed journals, national and international conference presentations, etc etc, and then there are inappropriate locations. Internet blogs are the latter.
Well, that is dependent on what you think oil depletion is. As best I can tell peakers can't even really seem to decide if its something as formal as a definition, or just a word which they equate with their favorite "kill off the yuppies" scenario. Oil has been naturally depleting before Drake drilled his well, they are called seeps. Oil started depleting in the modern era with Drake or the Caspian, depending on your favorite dates. Production rates themselves certainly aren't "oil depletion".
My normal smartass answer would be to say "go acquire a copy of Craft and Hawkins and knock yourself out" but that is just that, a smartass answer.
http://www.amazon.com/Applied-Petroleum-Reservoir-Engineering-2nd/dp/013...
How does one distill down a couple of decades of training, field experience and research work on the topic? I read a few books on the topic, this one explains more than a little about the topic from a contrary point of view, but its much "bigger" than just oil depletion, assuming I even can guess at what you mean by it.
http://www.amazon.com/Battle-Barrels-Myths-World-Futures/dp/1846680123
Thank you for taking you time to provide the two book links, and refraining from offerring a condescending response.
I am not an expert in the oil field, but am an interested citizen. Perhaps I do not understand the concept or definition of 'oil depletion'.
I understood oil depletion to be the movement of oil from the various formations underground where oil is concentrated/trapped to the surface...either by the mechanism of natural migration (seeps) or through extraction through wells. In either case, the oil is either biodegraded over time or is piped, processed, and transformed into waste products through combustion or transformed into plastics and other products which are no longer oil.
In short, over a specified time frame, oil depletion results in less oil being in the ground that at the start of the time frame. I have read that most oil that ever was created has seeped to the surface and degraded over time. However, I was also under the impression that most of the reduction in 'known' existing oil reserves since Drake et al has been through human extraction.
Is this incorrect?
You are correct. By all accounts production is the complement of depletion. Much of engineering, as well as accounting, is about keeping track of the "gozintas" and "gozoutas". The course just needs a data flow diagram describing how we keep track of the material. If you did this in Matlab, every engineering student would immediately pick up on what is going on.
Find a Petroleum Engineering textbook that actually does something like this and it would knock me over.
Works for me. Now, how would you like to measure it?
Nope. Once Drake and humans got in the game, I bet we've outstripped "natural" depletion bigtime. But depletion isn't measured properly against reserves, its better considered against the full endowment, which then alleviates net versus gross measurement problems. A common issue when conversing with peakers.
Would you like that abiotic or heavy? We're running a special today on Arctic funfetti, served with crispy FSU graft and a dash of Chavez.
I like heavy. I haven't seen anyone quantify abiotic yet, so I have no way of including it in any estimate of the full endowment.
You always subtract the steady-state value! Natural seepage does not change over the years. You can assume it is a constant rate and thus subtract the value for natural seepage from the total. Over a short geologic time-scale it does not matter in any case.
At the same time, the lecture material can explain how large reservoirs form due to dispersive growth over millions of years. Seepage and flow from surrounding areas converge on natural storage points, and thus through a fluke of nature give us these super-giant reservoirs. So, in some ways, we should be grateful for seepage. And what I just said is an example of a model, of which we can scientifically test against by tabulating the volume sizes of reservoirs to see if it follows the laws of dispersive growth.
RGR2,
I'm sorry, but there is no such thing as a proprietary dataset if what you're looking for is a conclusion. Data are all around us. I suggest you spend an hour at the window staring at the clouds and use your brain to come up with a experience-based common occurrences that relates why the explanation above is full of errors and misrepresentations.
If you are unable to, you may be suffering from religion.
What do you mean, no such thing as a proprietary dataset? Perhaps I am using the wrong word? A sum of money is spent with a commercial data collection company, like IHS.
http://energy.ihs.com/
They are particular about what can, and cannot, be published from that data. They will sue you if you get it wrong. To avoid this, you approve, with them, what you wish to publish in advance. I call their data proprietary even though it is commercial. Perhaps you disagree with this characterization?
If staring at clouds for an hour would infuse me with the production and reserve data on all the oil and gas fields of the world, I would certainly invest the time. Believing it would leads me to believe that perhaps I am not the one suffering from "religion".
At the time I wrote it, I wrote a rough draft, and then had input from Oil Drum readers before I wrote the version you see.
I will agree that there is a lot of non-liquid oil. We have been unable to get this out in very large quantities to date. Melting it does not give very much flow. Also, the oil you do get out, once you take those steps, seems to need a lot "cracking" to make it very usable.
The university I was writing this for wanted me to cover a fairly short list of topics, for a short unit for their overview science course. With more days, more could be covered.
I have written about heavy oil and oil sands:
A Visit to Chevron's Kern River Heavy Oil Facility
Canada's Oil Sands - Part 1
Canada's Oil Sands - Part 2
There is. But the Orinoco isn't non-liquid. And it has been quantified recently by geologists who measure these sorts of things. The amount is non-negligible, and its size is not reflected on the discovery chart you reference. While I recognize that ASPO has a history of only counting the oil they like, doing so certainly does not do credit to Hubberts methods which included what I would say were generous estimates of resources, versus restrictive ones.
There are good reasons to consider "conventional" oil separately from "non-conventional". Non-conventional oil has much lower EROEI, has much higher production cost structures, and for the types that are plentiful (i.e. Canadian oil sands, Orinoco extra-heavy oil), there are technical reasons for believing that production rates will never reach anything like rates for conventional oil.
Peak Oilers focus on conventional oil because that is what will drive the peak of oil production generally. A large socio-economic impact from the peak would still be felt even if conventional oil was replaced entirely be the much lower EROEI of non-conventional oil. Given that there will never be huge production rates from non-conventional oil, the socio-economic impact will be that much larger.
The good news, however, is that the relatively low production rates of the Canadian tar sands & the Orinoco extra-heavy can be sustained for a very long time. This will give the Hubbert Curve a fat tail and (along with intelligent use of renewable energy) will mean the predictions of the doomers will not come to pass. Society will be forced to make massive changes, yes. But it won't amount to the end of civilisation.
That would be one of the peaker claims which is repeated quite often. Could you please point out where Hubbert decided to exclude certain types of oils, or natural gas, when he did his estimates of peak? Certainly he must have did excluded some, I just don't recall the conventional/unconventional distinction being the criteria. Particularly in his early work, which I am more familiar with.
The distinction between the types of oil makes analysis a bit more challenging. Crude oil is distinct in that it accumulates differently such that you find thhe power law distribution in size. Crude also goes through a different production life-cycle. All the heavier forms of oil seem to occur in very dispersed areas and will get processed much more gradually.
To do the analysis correctly, we have to isolate the types. All I can say is that it is easier than trying to do the same thing with mineral resources where the mineral grades can vary by orders of magnitude. Crude oil does not show the same dynamic range as say uranium, from high density deposits to low concentration in seawater.
Different compared to what? Growing apples?
What does this mean? Heavy oil occurs across a wider range of area? The areal density of its occurrence is different than lighter crudes? What is a dispersed area, something run by an NOC versus XOM? And processed more gradually why? I can make production rates more dependent on well counts than API gravity depending on the particulars of the reservoir and the economics involved, let alone the politics. Every time you use the word dispersed I figure there is a secondary meaning related to your favorite curve fitting routine, when you use it this time it looks like you are claiming its got a density relationship to...something?
When you see something that covers several states or provinces and they call that one huge shale field or tar sands area, I consider that spatially dispersed.
I am still in awe of how well the oil reservoir size distribution matches what dispersion theory would predict. When I wrote the TOD key post on diversity (http://www.theoildrum.com/node/6255), I was trying to point out how similarly the dispersive rates operate on completely unrelated phenomena. So when you look at species diversity which disperses based on rates of evolutionary strategies and reservoir sizes distribution which disperses based on the various rates that a reservoir can accumulate, you realize how universal these entropic forms are. Yet they still refer to classifications, so that you don't compare coral against moths, and so you don't compare crude oil against oil shale.

So you do not mix crude oil with coal or tar sands or shale oil because the dispersion differs.
This is really so beyond what GSA Bulletin can handle because it deals with a paradigm shift in thinking.
Whats wrong with calling it "one bigass oil or shale gas field"?
Curve fitting doesn't necessarily "predict" anything, if you are referring to the GOM proven reserves chart, you aren't quantifying all the reservoir sizes anyway. How well does your favorite curve fitter explain the missing data which might cause some to use pareto's to represent field size distributions? Parabolic fractals? Double pareto lognormal? Loghyperbolic?
My bad, thinking that research journals might be looking for new ideas. Much better rationalization than the alternative explanation I suppose.
I love it. What you are referring to are pure heuristic functions. These things do not explain anything! They are junk placeholders that analysts use because they have no clue about actual dynamic processes.
Nowhere will you find an explanation for the parabolic fractal, as it is simply a polynomial with variable coefficients. The pareto usually only fits the tail. Lognormals work if the item of interest that you are measuring is the logarithm of some measure.
Give me something based on some scientific principles and it may interest me.
And dispersive based functions which want to create recovery factors >100% do? Seems like all they explain is why Rockmans opinion on modeling is quite apropos.
When you can explain the dynamic geoscience process which allows recovery factors >100%, I'll stop asking questions and start taking notes.
Of course there is an explanation. Lets play Jeopardy. "Mathematical cuteness designed to fit non linear data trends with no predictive ability but a maximum R^2 for $200!"
Strikes me that this is exactly the question I've been asking you. Let me know when you change the laws of physics enough to explain that recovery factor thing.
I wish you would give me some challenging questions, I really do.
Statistically you can get recovery factors greater than 100% as long as your prediction of the mean recovery rate is on track, which means that you have a spread in recovery rates and thus you have assumed recovery rates of less than 100% to balance it out.
That is what the Maximum Entropy Principle is all about: if you only know the mean, then maximum entropy automatically gives you a variance.
BTW: ROCKMAN's view of modeling (that you can get whatever results you want) is a piece of crap advice to those people that want to make a difference and have the skills.
Well, we are going to have to disagree on the explanatory power of statistics on this topic then. I am perfectly aware of uncertainty around the mean in any particular statistical operation, and the instant someone tells me "don't worry, the mean is okay" when the particulars are claiming the physically impossible, its time to politely nod and move on.
Rockmans advice on modeling is undoubtedly the result of someone saying to him what you just did above, and him knowing where such a statement leads.
Look Web, I've been handed that answer before, to paraphrase, "don't worry, the math is good" and been kicked right in the teeth by its implied effects. You might bash heuristics every chance you get, but if real world examples keep someone from making the mistake of presenting a statistical answer which contradicts some law of nature or another, it is completely understandable why people would avoid it like the plague. That doesn't mean a statistical answer for a question is bad, just that it strikes me as completely understandable why engineers might be gunshy from falling for it hook, line and sinker.
Fat-tail statistics is only slowly being adopted.
Any time you use a Gaussian distribution it will give you st least some nonsense results.
Because the Gaussian is symmetric and tails extend to +/- infinity, there will be values less than zero. And if your physical model doesn't allow that, well tough luck.
Where I draw the line is with the concept of negative probabilities.
Find me a case of where I made a mistake and added up probabilities that exceeded unity, or go negative and we can talk.
What I am getting at is a logical foundation for how to think abut these problems. Something that no one has seemed to have tried. Your lack of referencing a textbook is testimony to that sad fact.
Do you have some philosophical objection to truncating a distribution?
Yes, if it doesn't make physical sense. The Wall Street debacle of 2008 was partially about that problem. Too much probability in the tails and no good way to handle it.
OTOH, fat-tail distributions have a physical justification.
If you do truncate a distribution you have to re-normalize it if the truncation is significant.
dup
It's a shame Gail never looked at this.... Oops!
http://www.theoildrum.com/node/5098
The word hubris comes to mind.
Or the one which references its recovery factor of being nearly 70%, based on the current estimates of ultimate recovery and OOIP. Apply Webs reserve growth randomizer to that one and presto! Recovery factor > 100%!
Kern River fits inside a statistical distribution.
That's the point of a dispersed set of data -- you can't single out any one area for deeper analysis at the risk of reducing the power of the law of large numbers. It is best to take an ensemble and make sense of it that way.
If Gail's course material has any further depth to it, the course itself should have prerequisites in Probability & Statastics. Discussion of probabilities, reasoning under uncertainty, entropy, and randomness/disorder would promote the critical thinking required to make sense of all the so-called "enigmatic" behaviors that come out of the numbers.
Everything fits inside a statistical distribution. You have me convinced that you can do so much with so little that pretty soon you'll be able to do everything with nothing.
This would be called, the engineering axiom of "when you actually know something you can't hide your ignorance inside a huge averaging scheme anymore"?
I do agree with your comment on introducing probability and statistics early though, if there is one thing I notice at the SPE nationals or in the research, its a lack of stochastic modeling, very little incorporation of uncertainty into models or calculations, not much in the way of probabilistic analysis and generally an attitude that problems have a single answer which can be calculated to 3 decimals.
Regarding doing everything with close to nothing, we are forced to either because of (1) noise (2) uncertainty or (3) disorder. Oil depletion analysis definitely involves the latter two, with some noise thrown in there due to mixing in things that should not be counted.
The biggest "averaging scheme" known to mankind is called entropy, which is basically a measure of the disorder in a system. In physics, the laws of entropy are captured in the field of statistical mechanics. We rely on the statistical distributions (Maxwell-Boltzmann, Fermi-Dirac) to understand how transistors work, which drive our computers, which allow us to attempt to communicate. The idea of random-walk statistical models drives the concept of diffusion which leads to Fokker-Planck advection/diffusion equation and ultimately to Darcy's model that reservoir engineers will run across at some point in their careers.
I can't help it if Petroleum Engineering courses forces its students to learn differential equations without understanding the fundamental basis behind much of that knowledge. Stick in the concept of uncertainty that applied statisticians deal with all the time, and noise that signal processing engineers have to deal with and you have a challenging problem, no doubt. This doesn't mean that you can't solve it through a systematic analysis.
The reason that research scientists aren't really interested in the problem is that it doesn't reveal any new laws of nature. This is just meat and potatoes applied probability and statistics, what Jaynes calls the Logic of Science.
Well, maybe thats why we're better paid for votech level math training? If more advanced mathematical knowledge leads to clever equations which imply that Kern River can have a recovery factor greater than 100%, certainly we don't want any of THAT sort of break with reality to take place in front of investors and the like.
Yeah, well fortunately some of us did real work once which made us cognizant of what passes for "knowledge" among the "I don't need to know anything to make up a model explaining it" types.
Again with the tone. So, again, what are you doing here?
WHT,
The answer to this,
is this,
http://en.wikipedia.org/wiki/Central_limit_theorem
which rgrulz2 doesn't know about.
Stop hyperventilating over dumb skewed distributions.
That one I do happen to be familiar with. And WHT is correct in worrying about skewed distributions.
As someone who has followed your blog for a long while and has difficulty following your math (I ask friends who do to look at it) that would be very nice! I can get the concept but it would be nice to better understand the methodology.
As oil is removed the pressure in the well drops. Does this not suggest the integrity of the well's rock is compromised, particularly in large wells?
Not really, no. There are more than a few mechanisms involved in the process of how pressure responds within a particular wellbore. There is initial pressure to consider, which can be greater than, equal to or less than hydrostatic. There is the differential pressure applied by lowering the pressure in the wellbore to a point less than that pressure, and then there are the rock and reservoir drive properties which dictate the size and duration of a particular flowrate.
I am not exactly sure what you mean by a "well's rock is compromised".
As a layman, if the pressure above the well was more than inside the well then the well would be compressed before drilling starts. After drilling and extraction the pressure inside the well would reduce, the peak oil syndrome would manifest and some sort of incremental pumping action would be needed to extract more.
So unless extracted oil is replaced by something, the pressure inside the well would drop and if the well extended over a large area then might it not eventually compress? Or even collapse?
I'm just a software engineer and this, as we like to say, is a hardware problem :)
Above the well? Versus inside the well? As the guy in charge of a well, I can make its pressure whatever I wish. I can cement in casing and pressure up on it, I can perforate and frac it, which can involve any pressure inside the well from ABOVE reservoir pressure (such as if I were building an injection well) all the way up to and beyond the fracture pressure, I can produce it for a long period of time and reduce wellbore pressure to near atmospheric, I can attach a compressor and pull a vacuum on it, nearly anything necessary.
Reservoir pressures are dependent on all sorts of things, and they aren't the same as wellbore pressures which I can induce through regular operational techniques.
As far as "the peak oil syndrome", I can't even say to know what exactly that might be. Peakers have confused bell shaped curves with regular well production profiles for so long now, its in their dogma.
There are drive mechanisms in reservoirs, some more efficient than others, some nearly ineffective, such as anything in poor permeability rock. Overburden pressure is capable of being a drive mechanism, some California fields are subject to this and the subsidence actually expresses itself on the surface.
Only some people confuse "bell shaped curves with regular well production profiles".
As I have developed the only arguably correct derivation of the Hubbert Logistics sigmoid, you might want to take a look at this post from a couple of days ago.
Hubbert Peak in Five Easy Pieces
This derivation is bulletproof given the premise I have stated. The strong law is that localized depletion will show asymmetric and skewed peaks, and non-localized, large scale depletion will become less skewed and will show the more familiar symmetry. (Not to say that it will ever turn completely symmetric, except in the perfect Logistic case)
After all these years, I doubt you can find any textbook that demonstrates this in any other fashion other than hand-waving. If you can find a derivation as good as that I liked to or the one I used in Dispersive Discovery, let me know.
Of course. They are called peak oilers. Nonsense straight from Wiki: "His logistic model, now called Hubbert peak theory, and its variants have described with reasonable accuracy the peak and decline of production from oil wells...." No, it doesn't. Hubberts approach wasn't bottom up in the least, but that doesn't stop peakers from acting as ignorant as possible on this issue. This is exactly the type of misrepresentation which gets into these peaker "science" presentations which tee's me off.
As far as your "bulletproof premise"...please.
When you get around to explaining the basis for that statement, let me know. Certainly nothing presented to date would lead me to that particular conclusion.
Not too hard to answer the question.
Just something in the ballpark of a Petrleum Engineering text or a Reservoir Engineering text that can derive a Logistic.
I believe it doesn't exist. You can try to act nonchalant about it but it looks like a seriously missing piece that I have tried to address.
Excellent. I would venture then that we have done quite well without it.
If somebody did the derivation I likely wouldn't have invested all this time, so that is why I have been badgering you about it.
Badger away. Although I'm not the guy to ask about derivations, usually if I need something solved at the higher end of the math world I round up a mathematician and ask them.
I believe we each have pretty thick skins. Thanks.
No problem. I usually get banned for pressure testing ideas, anyones, pro or con. Most people don't have a clue how science works, you would think they imagine its like the paintings of Aristotle, everyone lounging around in the Mediterranean sun, explaining the meaning of everything to eager students and peers, everyone eating grapes, using big words. What a load of crap. Its mental combat, people yell, storm out of rooms, they publish opposing papers calling each other names, its absolutely beautiful.
Plus you have to sell yourself to some extent, with is at odds with the typical engineering reserve displayed in the corporate world.
Clarification please:
A liquefied natural gas plant (LNG) is a different thing than a gas to liquids plant (GTL). An LNG plant cools and compresses natural gas until it changes state to a liquid. A GTL plant does a sort-of reverse distilling that makes longer chain hydrocarbon liquid from shorter chain gas molecules. The result is a clear very clean burning diesel fuel. Also, it take two very different kinds of tankers to transport LNG and any hydrocarbon liquid.
This is what one Bloomberg article from the time-period when the article was written said:
I don't think this was the article I was using as a source, but at that point they hadn't decided which they were using.
The production - price plot for oil is one of the most convincing curves support the theory of peak oil production, IMHO. It is essentially the supply plot, for the economics101 'supply-demand intersection is price' concept. When large, expensive reserves are developed over time (i.e., Canadian oil sands), the supply line will extend to higher production at a price level determined by where demand can support it and the cost of production for higher EROEI sources. Price of oil/energy essentially correlates to EROEI.
which was Figure 8 of the post:
http://www.theoildrum.com/node/5969
I'd love to see an updated version of this since it was created in 2008.