Bumpy Crude Oil Plateau in the Rear View Mirror
Posted by Gail the Actuary on April 4, 2008 - 6:10pm
Which countries are increasing in oil production? Which are decreasing? How is this changing? Can we expect that the increasing ones will continue to increase in 2008? Does the megaprojects data give any insight into the future increases of growing countries? These are some of the questions that Matt Mushalik and I explore in this post using what Matt calls "incremental production graphs".
Matt Mushalik is a retired civil engineer and regional planner from Sydney, Australia. In this post, he provides an update of his incremental production graphs, which he first provided in the post Did Katrina Hide the Real Peak in World Oil Production? And Other Oil Supply Insights
Matt has an ingenious way of graphing oil production. In his graphs, he separates oil production between base production, which stays the same during the entire graphing period, and incremental production, which is the "top" of the graph, after base production is subtracted. He then groups together different countries with similar production patterns, for some interesting analyses.
It has been about six months since our previous article. The additional time allows us to continue and deepen the analysis. As in the earlier post, incremental production profiles of various countries or groups of countries are stacked in such a way that it gives us information about production trends. Incremental production in a given country and period is defined as the production exceeding the minimum production in that period.
Individual Country and Small Group Profiles
Figure 1 shows incremental production profiles for selected countries and groups. The tick marks on the side correspond to 1 million barrels of oil a day, so one can tell approximately how much production has recently been increasing or decreasing, for the countries or groups shown. What is shown for each country or group is equivalent to the top "slice" of the graphs for that country or group.
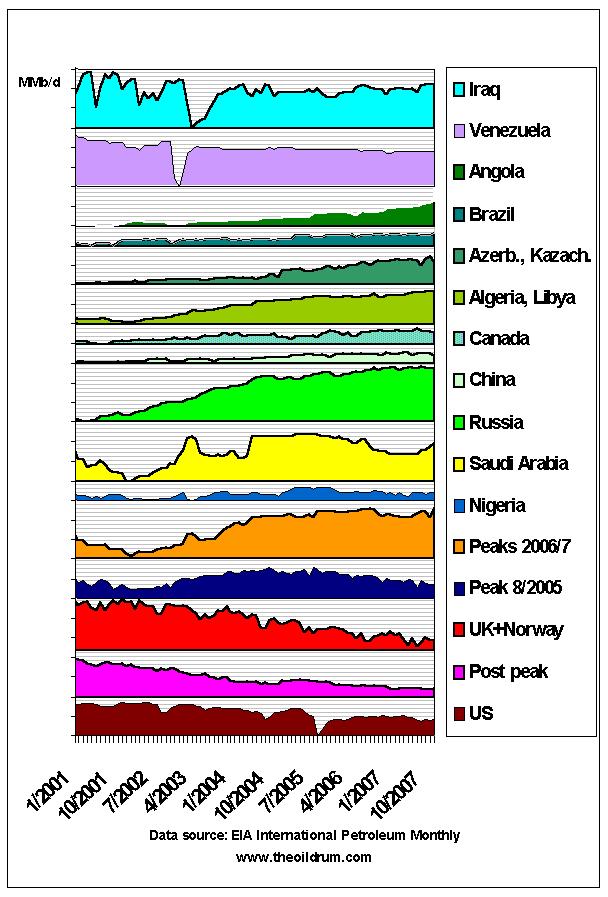
A few comments about the profiles on the above chart:
• Iraq - production drops during and after the Iraq war
• Venezuela - a steady decline and a big drop during the strike in 2003
• Angola, Brazil, Azerbaijan, Kazakhstan, Algeria, Libya, Canada, China, and Russia - all countries with increasing production
• Saudi Arabia - boosts production during the Iraq war and in 2004, but then is not able to maintain production levels in 2006/07. Recent uptick in production still leaves it below 2004/2005.
• Nigeria - fairly flat production; high year 2005
• Peaks 2006/2007 - Ecuador, Vietnam, India, Qatar, EIA's "Other", Kuwait, UAE - These countries appear to be on a plateau or slightly declining.
• Peak 8/2005 - Iran, Mexico, Malaysia
• UK and Norway - shows North Sea decline
• Post Peak - Indonesia, Egypt, Syria, Gabon, Argentina, Colombia, Australia, Oman, Yemen, Denmark - all in terminal decline
• US - on a declining path since its peak in 1971, showing production drops during hurricane seasons
Four Major Groups of Countries
To get a better overview of the underlying trends further groups are formed:
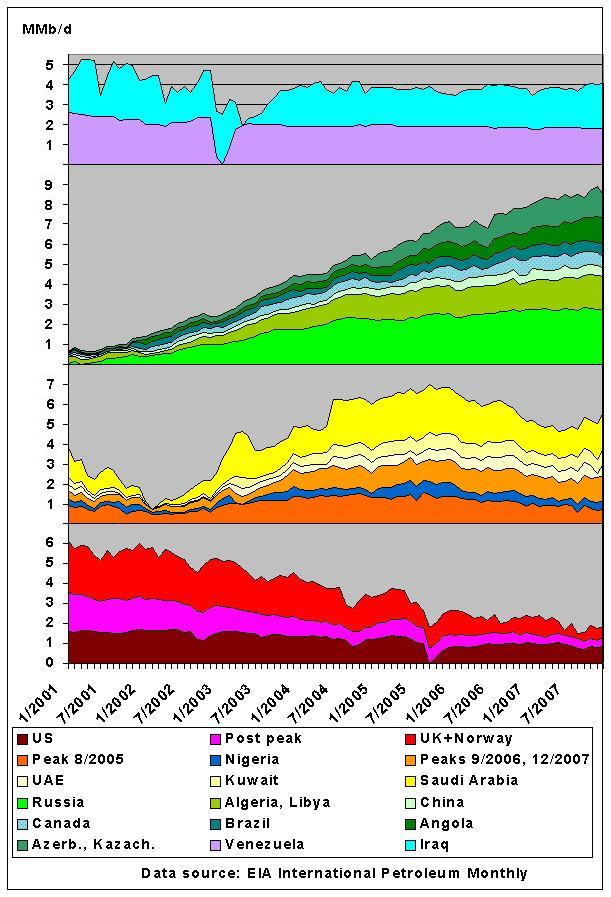
• Top Group - Iraq and Venezuela shown separately with their big production drops in 2003
• Second Group - the growth wedge (+ 8 million b/d) showing clear signs that Russia plus some other hitherto growing countries are maxing out
• Third Group - "peaking group" - the various recent peak and the plateau groups - This group is dominated by Saudi Arabia, Kuwait and UAE. The rebound in 2007 is mainly from Saudi Arabia. Production for this group dropped between 2001 and 2002, then increased by a whopping 6 million barrels a day between 2002 and 2005. If one compares 2001 and 2007, production is just 2 million barrels a day higher now.
• Fourth Group - the decline wedge (US, North Sea, others post peak). This group's incremental production went down from 6 million barrels a day in 2001 to 2 million barrels a day in 2007.
In these graphs, note that the base production (the amount that did not change) is not shown. Also note the colors of countries are the same between graphs, so that they can be better identified.
These groups can now be stacked in two different ways to give us different information:
(1) Starting with declining countries on the bottom
(2) Staring with the growing countries on the bottom
Graph with Declining Countries on the Bottom
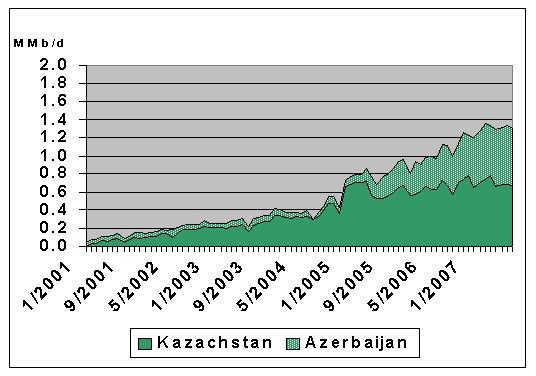
From bottom to top: declining group, peaking group and growing group. Iraq and Venezuela are put on top as their one-off production drops in 2003 distort the picture if stacked somewhere in between. Because of the definition of incremental production, their layers are disproportionately thick because of the big temporary drops in production. To minimize the distortion this causes, they are put at the top of the graph. This is the graph shown at the top of the post, which we show again here.
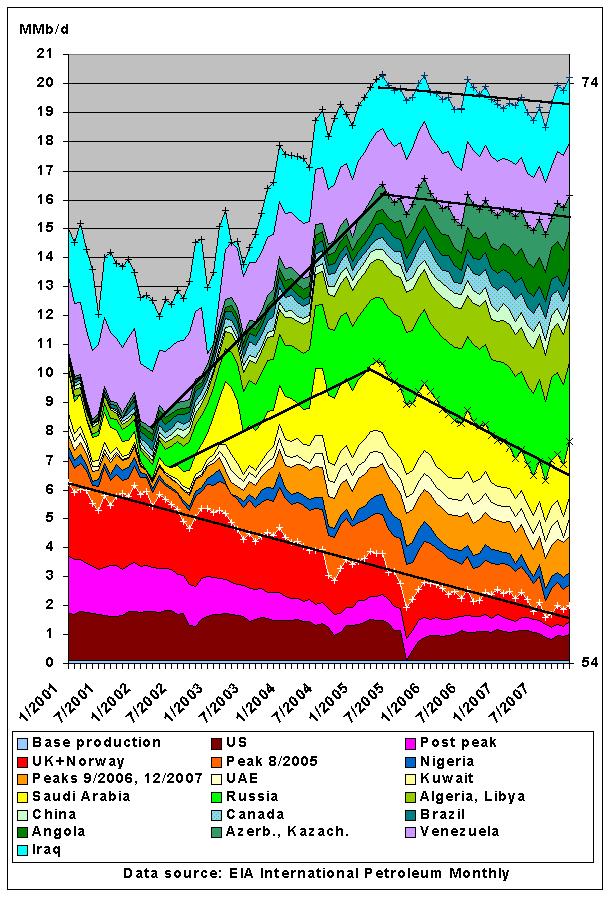
The bottom black line shows the underlying trend in the declining group of countries.
The second from the bottom black line outlines the sum of the bottom two groups - that is, the declining group, and the recent peak/plateau group. The trend line clearly shows an underlying peak when these two groups are combined.
The third from the bottom black line adds the "growing group" to the previous two groups. The growing group of countries was able to offset the declining trend after the peak and lift total crude production to an only slightly declining trend.
White and black crosses mark the points used for the declining trend lines. Increasing trend lines have been inserted by estimating the growth between a low in 2002 to a maximum in May 2005.
Graph with Growing Countries at the Bottom
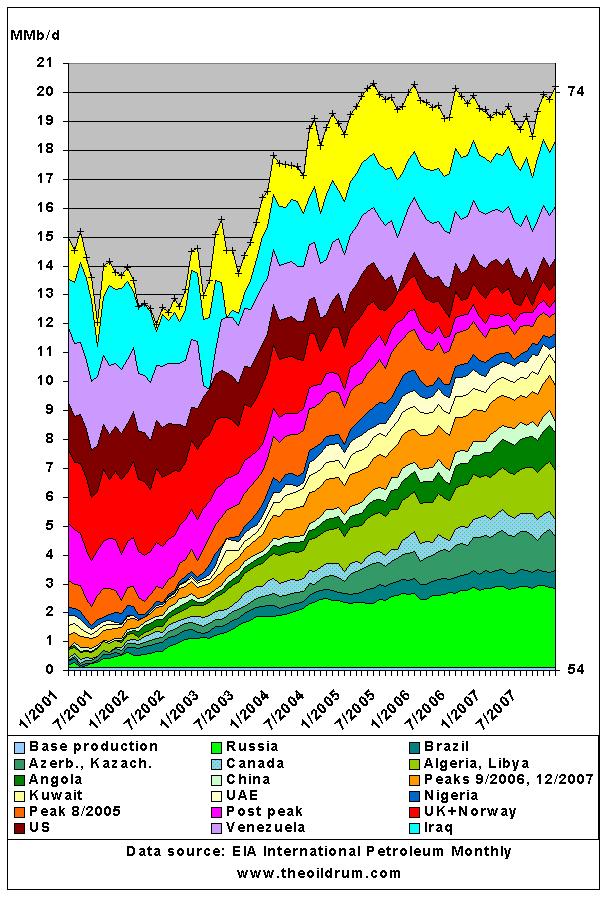
In a different view of the same data, production profiles from growing countries are stacked at the bottom and Saudi Arabia on top. The graph clearly shows that Russia, Kazachstan and Brazil have maxed out (unless megaprojects change this in the future) and that Saudi Arabia is no longer performing its function as swing producer.
This analysis helps us understand what the late Dr. Ali Bakhtiari called the transition phase T1 between growth and decline. During the Australian Senate hearings on oil supplies in July 2006 Ali said this transition phase would start in 2006 and last for three to five years. It seems the transition phase is marked by two crude oil peaking events, one in 2005 and another one happening right now. The big question is therefore how long will that peaking of the hitherto growing group take? These are the current trends:
Former Soviet Union
We have already mentioned that Russia seems to be at peak. In other Former Soviet Union countries, Kazachstan's doubling of oil production starting in 2005 has stalled, leaving just Azerbaijan with an annual increase of 200 thousand barrels a day.
It is possible that the increase will be greater than this. Russia, Kazachstan, and Azerbaijan have megaprojects scheduled to begin production in 2008 which total 1,186,000 million barrels a day in maximum production. This total production is not expected to be reached in 2008, and a significant share of it will be needed to offset declines in older fields. Given these considerations, increased production for the Former Soviet Union may be somewhat more than 200,000 barrels a day, perhaps on the order of 400,000 barrels a day. This may very well be an overestimate. Numerous reports suggest, such as this one, indicate that Russian production will fall in 2008.
Angola and Brazil
Angola joined OPEC and will come under a quota system. A recent announcement indicates that Angola's production for 2008 is expected to reach a plateau of 2 million barrels a day, and maintain that level until 2013. Production for December 2007 is reported to be 1,986,000 barrels per day, so Angola has apparently now reached its peak production, and only a plateau can be expected henceforth.
Brazil's growth has apparently flattened. There are four megaprojects scheduled to start production in Brazil in 2008. The ultimate production for the 2008 projects is expected to be 475,000 barrels a day, although not all of this is expected to be realized in 2008. There are also a number of megaprojects (totalling 648,000 barrels a day in ultimate production) that were expected to begin near the end of 2007. If the various 2007 and 2008 projects come on board as planned, Brazil's production may increase by 400,000 or 500,000 barrels a day in 2008. (All of these future production estimates are very rough.)
Other African Countries
In another group of African countries Algeria's and Libya's growth is modest, but steady while Sudan and Equatorial Guinea grew at 300 Kb/d last year. There do not seem to be any significant megaprojects for these countries for 2007 and 2008. If decline rates are as in other countries, the increases for these countries may be smaller for 2008.

Canada
For Canada we know the potential is in syn crude from tar sands but this is limited by the supply of natural gas. CO2 emissions are a big problem and NASA climatologist James Hansen has not included this un-conventional oil in his carbon balance. There is just no room for it, according to this paper he wrote.
Irrespective of environmental and climate change concerns, there are a number megaprojects planned for the Canadian tar sands. The ultimate production from these total 266,000 barrels a day from projects with 2007 start dates and 605,000 barrels a day for projects that are planned to start in 2008, according to the megaprojects list. Some of these are very long term projects - not to be completed until 2018. Actual production increases are likely to be much more modest. Canada's oil production grew less than 100,000 barrels a day in 2007. It would be surprising if Canada's 2008 oil production grows more than 200,000 or 300,000 barrels a day.
Conclusions
This analysis is mostly a review of what has happened in the past with oil production. Another article, very closely related to this one, was written by Matt and is posted on the Sydney Peak Oil website.
We have included a few very rough estimates of production for some of the increasing countries for the future. It looks as though there still will be countries with increases in 2008. Our rough estimates of increases for the countries shown total only about 1.0 to 1.5 million barrels a day. This is fairly similar to what the increases for the growing group of countries has been over the past five years. This is not very much to offset the countries with declining production.
There are many countries that we have not considered to be growing, that theoretically may grow in the future. Saudi Arabia and Iran would be two in this category. We have not made any estimates, upward or downward, for these countries. If oil production is to stay on its current plateau, it would seem like we would need increases from some of these countries as well.
We remain on a bumpy crude plateau, where the exact timing of new projects and the coming hurricane season will determine which temporary wiggles we get on the production curve. 2008 should be an interesting year.
Contact
- Content: editors at theoildrum dot com
- Tech support: support at theoildrum dot com
License

This work is licensed under a Creative Commons Attribution-Share Alike 3.0 United States License.
Thanks for another very interesting piece.
I love that this is for crude only. This chart can be juxtaposed with all liquids charts to reveal the vulnerability we have in the system. It might be one of the better charts for getting the attention of those either unaware or not convinced a problem is brewing.
If those trend lines won't scare a person into belief, nothing will until TS has HTF.
Cheers
On behalf of Matt, thanks! The idea of looking at things this way was all Matts. We worked together on refining a few things, and I think it gives some ideas of different ways of looking at things.
I for one want to watch how the "growing group" really develops on a monthly basis. Also, the plateau group really needs to hang on the plateau, or we have a huge drop ahead of us.
I too appreciate the crude only aspect of these charts, kudos to Matt for the amount of work it took to produce this quality analysis. For those looking to do the same with biofuels/etc, it would be nice for any "liquids" to be assessed for the energy balance required to produce said 'liquids', subtracting the appropriate figure (oil equivalent) from the overall total.
Crude and Condensates is the energy source on which our economy is built. Until some other source of energy proves for a decade that it can form the base of a sustained economy, focusing on crude seems the most wise choice.
The way you grouped data helps show the deterioration in Energy Growth.
Lack of crude growth is impacting the economy. Mortgage foreclosures caused as rising costs and interest rates make it difficult for more and more people to pay for their commute, food and home.
I would like help refining some metric for measuring lack of growth. A rough draft is:
Economic growth = (Energy Growth * Efficiency Growth) / (Energy Price Growth * Critical Importance Factor)
I think that lack of growth is what we are seeing in the current recession (or pre-recession, if you don't yet believe it is a recession).
I will think about your formula. I have to leave for an appointment now.
Thanks. I have been trying to find the right analogy for economic growth. The best I have come up with so far is:
The economy is like a freight train that to grow must constantly increase momentum as it gains speed and more and more people get on. Increasing momentum requires some combination of factors. I adjusted the formula to:
Economic growth = (Energy Growth * Efficiency Growth * Discretionary Income) / (Risk Factor)
Numerator:
Energy Growth: more applied power
Energy Efficiency: power more effectively applied
Discretionary Income: Power to drive and innovate
Denominator:
Risk Factor: Some fuzzy factor for risk
Unlike the 1973 Oil Embargo where everyone suffered, Peak Economic Growth (May 2005) affects people based on their spendable incomes.
I like Matt's graphs because you can see trends and subjectively visualize risk and growth potential.
I tried to capture the effects of discretionary income, in this graphic. The horizontal scale on the two left graphs are indicated. Peak Growth(May 2005), discretionary income and foreclosures are indicated.
I think that there are a lot of things that work into this that we don't think of:
A lot of bad practices look like efficiency, and feed into current efficiency measures, but really are not, in the long term. In not long, we will have to pay the price:
• Failure to maintain the grid, at above minimum levels
• Failure to replace bridges, water infrastructure, oil and gas pipeline systems, at above the absolute minimum levels
• Failure to train new engineers - just let a smaller and smaller number of people nearing retirement age handle all of the issues, as they arise
• Deplete the land and pollute the land, water, and air;
Built into current efficiency and growth measures is some expectation regarding the long-term use of assets, like cars, trucks, and factory equipment. To the extent that we need to change to a new fuel system, or our current fuel becomes available, we suddenly have a huge amount of assets that become essentially worthless overnight. Somehow this needs to be built into the measure. This is a sudden inefficiency cost.
Our current system assumes that we can use factories in China and other developing countries to produce our goods. If this no longer is the case, perhaps because they cannot buy enough fuel, or have not maintained their grid, or we have balance of payment problems, we suddenly have the need to build a huge number of new factories. This cost may be a heavy drain on energy resources that might be used for other things.
Historically, the energy needed to do a given activity has tended to fall a bit, because of improved technology. We now have a countervailing force, as we reach resource depletion:
• The EROEI is going down for almost everything, and is reaching low enough levels that the greater energy required makes a difference (going from 100:1 to 99:1 makes a lot less difference than going from 4:1 to 3:1).
• When we run short on fresh water, there are technologies for getting it (desalination; pumping water long distances, even uphill, to the required location). These require more energy, to get to the same end point where we were before.
• Mining requires more and more dirt to be removed from the oil, as ores become lower grade.
• Most any of the climate change proposals are very inefficient. Carbon capture requires burning vastly more coal, and using more of it to store the CO2 underground. Substituting ethanol for gasoline is horribly inefficient, in terms of the amount of energy required to get a liquid fuel (and is doubtful whether there are any benefits from a climate change point of view).
Historically, our energy efficiency growth has been something like 1.6% per year. It is easy for these things to overwhelm it.
Hi Gail
Here is another cut:
Economic growth = (Energy Growth * Efficiency Growth * Discretionary Resources * Durability Factor) / (Risk Factor)
Numerator:
Energy Growth: more applied power
Energy Efficiency: power more effectively applied
Discretionary Resources: Capital and capacity to innovate
Durability Factor: Maintenance and skills of the system.
Denominator:
Risk Factor: Some fuzzy factor for risk
I like the comments about maintenance, water, education, etc... and added the Durability Factor. It would probably be advisable to detail contributors. Listen to Matt Simmons talk about the age of the oil infrastructure. It is terrible. So is the current age of the electrical grid.
I also like the EROEI comments. Part of the reason I think Total liquid fuels should be ignored is that the net work capability is over counted. Oil sands and biofuels are double counted, their energy and the energy of natural gas to create them. We got to the party on conventional crude. It's health is what sets the health of the economy.
Re-tooling transportation will require Just-in-Time local manufacturing. Here is a link to an article I wrote on Re-tooling Transportation. Durability of the grid is one of the reasons we integrated power generation into our concepts.
The cost savings in re-tooling can pay for the re-tooling. It is not hard to get the electrical equivalent of 200 mile per gallon urban transport. CSX notes in the TV ads they get 423 mpg to move a ton of freight.
I do not think the sump cost of superseded infrastructure matters. As the infrastructure that is the cause of climate change is superseded, it will gradually be recycled. Transportation is currently an intense capital and expense activity(car, gas, parking). As we automate highly repetitive travel, it will gradually change to a lower cost service. Read PB-244854 for a blueprint, NJ Study and EU study.
Innovations will have to be profitable, add more value than the cost to compete. This will be essential post peak. Few subsidies will survive.
It is not hard to get the electrical equivalent of 200 mile per gallon urban transport.
No, not hard at all. Since it is less than the reported average for Urban Rail in the USA per Strickland (and my own sense of the #s, I do not think in those units).
http://strickland.ca/efficiency.html
Spend our money on stuff that we KNOW works and not unproven gadgetbahn,
Alan
Hi Alan
I am not asking to spend "our" money. JPods will be privately funded.
If we followed your thoughts in 1984, we would not have the Internet or cell phones.
Our current infrastructure is the cause of Global Warming and Peak Oil. Our current infrastructure is not working.
We can reinforce current failure or we can change.
France is changing with mature, workable technology.
Velibs (rental bicycles), 1,500 km of new tram lines in a decade, 3 TGV lines under construction, electrify every meter of French railways.
We do not have the time or resources to spend on gadgetbahn and related debugging (if it every works properly for decades in the Real World).
I know that you are posting here to advertise your business. Those before you have done serious damage to REAL transit projects.
Alan
The reason I post here is hoping to find people looking for viable solutions to peak oil.
Peak Oil is a civilization killer. We have a relatively short time to solve the problem.
I do not understand why you are hostile to rail that is not yours? I think rail is a good idea.
Your argument that we should not invent new and better solution makes no sense. Do you think we should return to rotary phones and stone tablets?
Your argument that we should not invent new and better solution makes no sense
It takes quite a few years/decades to first debug and second optimize any new gadgetbahn technology. We do not have the time or resources to go down a potential dead, or even invest in a seriously sub-optimum technology.
Also, I have seen (did not fully understand) a mathematical proof that PRT "networks" are severely limited in their complexity and reasonable "flows" of pods. Once past a certain complexity, scheduling gets tied up (traffic jams) at rush hour.
A wide variety of things have been tried in the last 175 years of railroads. Funiculars, cog railroads, different gauges, 3rd rail, elevated, etc. A wide spectrum of possibilities, all proven.
There is no real need for jpods, a hypothetical solution looking for a problem.
I do not understand why you are hostile to rail that is not yours ?
I have seen gadgetbahn salespeople come into town as cities were voting on good, workable Light Rail systems, sell their snake oil, defeat the workable systems with over-wrought claims of "better, cheaper", and then pack their bags the day after the vote, never to return.
Thus I cannot tolerate unsubstantiated claims of "better, cheaper" gadgetbahn. Hostility, skepticism and "Prove it !" are the only correct responses IMHO.
In my considered judgment, jpods sales efforts will have a negative impact on moving forward with real solutions (and will never fulfill their promoters promises).
That is my honest opinion.
I do *NOT* know if you are a misguided idealist or a cynical con-man, but in either case I cannot support your efforts. In the first case, I feel compassion, but will still move to block your claims, etc.
Alan
I see your point Alan, re the simplest/most robust/existing engineering solutions [I'm an engineer myself], but since the hurdles to getting the public/gov mindset around to public transport are both huge [and paradoxically small - once its built and everyone tries the damn thing..] surely a new gadget idea in one or 2 locations could spark the public conciousness. Dumb humans love new gizmos - even when TSHTF in 2009.
I grew up in an area of joined up public transport with electric urban rail [not streetcars] and I know the advantages. It is a huge quality of life advantage for the majority of any community.
http://en.wikipedia.org/wiki/Tyne_and_Wear_Passenger_Transport_Executive
http://en.wikipedia.org/wiki/Tyne_and_Wear_Metro
Any public transport is OK with me.
Yes, Tyne & Wear, a KarlsRuhe type of operation (a mix of Urban Rail types) and with the unique "pretzel" line :-)
Consider if some town builds a jPod system. In the first couple of years, breakdowns (including wheelchair bound pax traveling alone) are common, and scheduling software "locks" up periodically.
Costs come out 12 times what was promised, and cracks appear in the lightweight supports (bad welding it turns out), Rust also appears after a few years and it looks like the whole lot will need to be junked in a few more years (Remember that it was all speced to be built for 1/10th the cost of a real transit system).
Has the public benefited ?
Alan
Personal attacks seem so unworthy. I would like an open debate on possible solutions. Emotional "gadgetbahn" seem like saying in 1989 the Internet will not work or PC are gadgetbahn, mainframes are proven. Both PC's and the Internet are like PRT, the application of distributed collaborative networks. PRT is nothing more than web browsers you get in, look up a web site and travel on a packet-switch network.
The need to find solutions is so great and time so short. I do not see the harm in trying to find niche solutions. Morgantown's PRT has delivered 110 million injury-free, oil-free passenger miles. Not a bad result from a beta version. We would not have the Macintosh computer without the Lisa. On the Internet, we would not have megabit transfers without 300 baud iterations.
Perhaps the big problem between us in talking about this is you want an answer and I think we need a process for testing and finding answers. I think if we had the answer, we would have solved the problem.
A great limitation of the the age of cheap oil in America is we made the car the answer to fill all niche needs. We built cities (long term investment) around cars/cheap oil (finite solution).
Just as background for anyone interested here are some comments:
European Union
Contract No. GMA2/2001/52046-S07.13187
The Swedish Agency for Innovation Systems Report
VR 2001:3
Booz, Allen, Hamilton Study for the New Jersey Legislature

This is the expected growth of these networks:
There are many more studies. There is current construction at Heathrow and Uppsala Sweden. In the process of iterating to find solutions.
Visit www.jpods.com/studies.html for more studies and notes on other efforts. The page starts with a quote about the car from a systems engineering perspective. Scroll down the page to see a significant amount of academic work.
I think if we had the answer, we would have solved the problem
WE DO HAVE THE ANSWER !
It is only the will to build it !
Gadgetbahn distract from that will.
I do not see the harm in trying to find niche solutions.
Austin Texas would have the first 20 miles of Light Rail operating TODAY ! and 50 more miles in planning if it were not for gadgetbahn salespeople.
Morgantown PRT is an economic failure, the costs per pax-mile are too high.
The computer analogies are valueless, we cannot shrink people like we did transistors. And the shrinking transistor is the underlying basis for advances in computers.
We have had 175 years to try alternatives, develop and debug the best operating system, we KNOW the solutions.
And it was not meant as a personal attack. I do have some compassion for you if you are a misguided idealist. But personal feelings of sympathy cannot sway me to support a self destructive course for society.
Best Hopes for Mature, Robust technology,
Alan
Lobbying for an ultimate solution to distract from an immediate improvement that competes with a current system is an intresting tactic.
Even if it has been used it do make sense to do research and development projects for new solutions, it is healthy for a technological society do do such RnD. But we should not mix RnD and starting solving problems today, we need to do both in parallell.
Even if "gadgethbahn" yet again turns out to be fairly useless good research programs will give new insights. You use to refer to Moscow metros 90 s headway, why do that work? What insights would a stressed "gadghetbahn" system give for such situations?
And it could have market niches. They could be good for saving the property value for current style Swedish external shopping centers if plug-in hybrids dont work out, but that would only be 10-20 systems. They could be a topographic solution inbetween streetcars and cableways for making some towns denser.
Sweden is in the enviable position of having a viable Non-Oil transportation system largely in place (yes it can and should be enlarged and improved).
The USA will have to strain every effort to get where Sweden is today in less than twenty years. We need tracks on the ground ASAP, and we are NOT doing that today. Diverting too small efforts and attention to gadgetbahn is the wrong strategy for the USA, but Sweden has that luxury.
If get them to work, we may buy some in 2026.
Best Hopes for Swedish R & D,
Alan
We act as a host for one such project and there are some RnD being done.
In RoI terms the situation is more or less the same in USA and Sweden. There is a very long list of reasonable rail investments and it tends to get longer with the growing traffic. There are efforts in finding ways to hurry up the development but it is not easy.
Collective traffic investments in towns and cities is slow planning that often is driven by other things then good economy. The fast moving part is changing to biofuels in the busses and adding more busses. Most tend to focus on commuting rail to other towns since that is a long term grow or die issue and road investments if there are any local bottlenecs since those give an immediate effect.
Car traffic is still growing with a petrol price of $8 per gallon and overall growth is centered around regions with a european style town in the center with a growing city center, external trade via car travel, a halo of suburban growth that often are an extension of old building structures and satellite towns connected via rail. We more or less got two trends running in parallell, one US and one "continental city". The loosers are deep rural areas and towns withouth good rail service to a growing center, they only survive if they have a key industry.
Quote from Swedish study:
Quote from you
Heavy and Light Rail, for all their great attributes are not personal transport. Your claim "We have the answer" seem to be unsupported by the places that already have extensive light/heavy rail systems.
That percentage will increase dramatically in an oil supply emergency. Ridership will climb quickly and total miles traveled (motorized) will fall dramatically.
Please note that the study excludes two vital modes, walking and bicycling, since they are not "motorized". A vital role for Urban Rail is to enable and encourage walking and bicycling (both forms of Non-Oil Transportation, and the supply of both modes can be easily doubled or tripled in an emergency *IF* the basics are in place).
Look at Sweden during WW II, when very little oil was imported.
Best Hopes for Sweden, walking and bicycling,
Alan
WW 2 gave an emergency electrification of the railways and a large part of that infrastructure is still in use.
There are still parts that are not electrified and there are suggestions for it but it is not a major win. The benefit is to a large degree in being able to use more unified wehicle fleets and get fewer diesel-under-wire freight trains. But it is at least somthing that is quick and easy to do for some added benefit, everything that is needed is anyway available for maintainance and reinvestment of electrified tracks.
What we got now is a reasonable electrified rail infrastructure between all large and most medim sized towns. But we lack high speed rail between the major cities and there are more initatives for additional freight and commuting then capacity. The freight demand is a free market demand, the commuting demand is subsidized with tax money.
During WW 2 we imported coal from nazi Germany in exchange for iron ore and machine parts. Trade and lick ass or get invaded, it were not our bravest moment.
There are more than 4 million miles of car roads in the US. By my best guess, we will need about 1.4 million miles of rail to build a sustainable infrastructure.
That rail will have to move both people and cargo.
From our perspective, we need to build a circulatory system for our economic community. Trains may provide some arteries but we need secondary and capillaries to survive.
The USA does not need 1.4 million miles of rail (OR PRT), unless you want to preserve Suburbia and Exurbia (and their associated energy use patterns).
The USA has about 178,000 miles of railroads today. Assuming most people can walk, bicycle or take a 25 mph GEM NEV (like a golf cart) a mile or two, I see little need for more than 300,000 miles of rail of all types (and that is pushing it).
For the next 25 years we should be focused on building the electrified arteries ! And in 2033 we can buy the debugged and improved PRTs from Sweden to fill in the gaps :-)
Walking is Good !
Alan
Walking is good. So it biking.
We have the cities we have. The 1.4 million miles is to get logistics and transport within a couple miles of most places in most cities.
We cannot build 1.4 million miles of sidewalks before significant effects of post-Peak Oil bite.
We have the cities we have, we have wasted trillions on Suburbia, Exurbia, McMansions, drive-in banks, strip shopping centers and shopping malls. We will not have the energy to heat and cool, light and support roads, water & sewer and police this overgrown mess.
Average homes have gone from 1,000 sq ft to 2,500 sq ft as average people/household size has shrunk. Average shopping sq ft/capita has increased ten fold since 1950.
Even absent personal transportation, we will not have the energy to support this Megapolis !
Urban Rail provide a nucleus for people to escape to.
Alan
The most advanced PRT project in Sweden in South Korean. They are here since our authorities are flexible enough to give a within EU ok for new kinds of rail technologies if they work out ok.
The effort at Uppsala is good. The general interest in Sweden is good. I have done a fair amount of business in Sweden and believe the Swedes will provide a significant jump to the industry.
POSCO has put an estimated $50 million.
I have seen perhaps half of the suggestions in media and otherwise. It is a mix of reasonable ideas, realy bad ones and some good.
I have personally adviced to not invest public money in PRT:s for my home town Linköping since we got good busses and a potential dual mode tram line that would be a nice combination with old railway lines.
But the "Kungens kurva" mall area and Arlanda airport suggestions are good ones that seems to make business sense. They could with a reasonably sized system connect multiple points of already present demand and some of the end points are on premises owned by interests with deep pockets.
Suggesting PRT:s anywhere is ok for the small number of people who live on selling studies but I realy hope the first systems are built at the best locations where they can add something unique that no other system can do. I would advice aginst PRT:s in my home town even if I loved them.
You are correct that networks need to be put where they fit their niche well. If properly placed, they should be a financial success.
I do not believe subsidized transport of any sort is sustainable in the time of peak oil. Transport will have to operate at a profit, add more value than the cost to compete.
It is likely that once put into operation, profitable solutions that achieve public policy objectives, will likely be refinanced under some bonding support. This will free the private capital to recycle and build more rail.
If a private company cannot build fast enough and operate profitably, the mode of transport they create, then they will fade away. The risk to choose well, build quickly and effectively needs to be a private responsibility.
I completley agree here, as although tradition is good in some forms of life, we should look for innovation when discussing peak oil, and technoligical advancements. Although this is the case, I do not think that we should consider it a civilization killer just yet. This is because most people dont face the problem until it is actually in front of us. It doesnt hurt to be technlogically prepared , but reality wont hit until its there.
Hi Alan
I looked at the web page and really like it. I will study more of the assumptions.
There is no doubt that rail can provide radical reductions in oil use and emissions.
We may not agree on some rail specifics. I do not oppose trains beginning built and used. I like trains, especially for freight.
I do not like trains for move individuals and individual pallets of cargo for several reasons:
I wish you good luck with trains. Connecting trains to airports and each other looks like it will be an initial use of PRT.
* You cannot manage quality in a batch. This is at the foundation of Just-in-time and Six Sigma concepts. Drive the batch size towards one and drive out sources of variation.
Huh ? It is easy to manage a small number than a large number,
* Parasitic Mass. In most cases, trains move 3 tons to move a person; it is like giving everyone a Hummer. They just don't have to park it. Every Start-Stop requires power be reapplied to rebuild kinetic energy. Trains Start-stop at every station in their route regardless of the value added; ie, people getting on or off.
You overlook:
Regenerative braking, recycling stop-start electricity with good efficiency
Rolling Resistance, steel on steel is hard to beat
Aerodynamic resistance, the great advantage of trains and a serious failing of jpods.
* Cost to build and maintain is expensive 10 times that of PRT
BS ! Unproven BS from a promoter. ESPECIALLY maintenance over a multi-decade lifespan (rail car standard is 40 years, but longer is not uncommon).
* Capacity of trains is 25% that of PRT. Trains moving 10 minutes apart with 200 seats provides 1200 seats per hour. Cars and PRT with four seats moving 3 seconds apart provide 4800 seats per hour. The reason you have 20 trillion red blood cells in your body is that small packets stream resource to need on-demand better than batches. The only batch processes in nature have to do with waste management not delivery.
BS ! Moscow subway operates with 90 second headways. More people/hr than your unbelievable pod every 3 seconds!
Even if physically possible (NOT in Real World), you will never get insurance for that density.
* Land use and conflict with existing traffic patterns is severe
HUH ! Not is my world.
* Service and convenience is critically important to attract drivers from their cars. Waiting for a train, getting mugged waiting, no service in off-peak times, missing connections, finding the right platform, etc... detract from value.
BS ! None of above will EVER happen with jpods, right ?
DC Metro carries more people to work every weekday in DC than single occupancy cars do. So semi-good transit cannot atrract peopel out of their cars ?
* Security. Unlike the terrorist attacks on subways (Spain, Japan, etc...) terrorist do not attack people riding in elevators. Small targets are not worth the effort.
Every a jpod every second, possibilities emerge. Of course, 45,000 people die every year in the USA is cars, plus 100,000s of life altering injuries.
* Success. Based on riders per day, the elevator is the most successful form of public transport. A network of horizontal-elevators mimics a very successful model.
Elevators go back and forth in a VERY limited corridor. They cannot pass each other. They charge nothing. Does jpod mimic that ?
Funiculars are a close mimic of elevators, and serve a niche market.
Alan
We disagree. The next 5 years will tell.
Please stop using the "frog in boiling water" analogy. It's long been known that this is a myth (IOW, the frog always jumps out in short order — frogs don't sit still in containers).
It's a metaphor, dumbass. Like the tortoise and the hare. Like lemmings.
Thanks. And the reference to is to "proverbial frogs" not real frogs.
In all the proverbs I have heard, the frogs stay in the pot.
Two thinsg that are never discussed about fogs and boiling water.
1. Put a lid on the cold pot and then turn the heat up slowly. The frog will stay alive but or how long?
2. If a frog was put inot a pot of boiling water, even if it was only momentary, it couoldstill suffer third degree scalds and die shortly after hopping out.
Has anyone ever done the experiment on some poor unsuspecting frog?
I'm claiming its a frog in a microwave situation not a pot of boiling water.
And we won't discuss experimental proof :)
;)
Use of an inappropriate metaphor fails to make the point. Continued failure to make the point by use of an inappropriate metaphor is what's dumb.
Not weaning ourselves from oil after the 1973 Oil Embargo was not very bright. Yet here we are.
So maybe the parable should be of the frog that was put in a slowly boiling pot of water in 1973 then popped in the microwave in 2005 ? We just don't know the power setting and the cook time.
I think the frog, for all it tribulations, might be facing an easier path than we have chosen.
On that, at least, I can agree !
Alan
LOL
Great, now I'm confused. So are we all going to boil to death when oil declines?
Nah, its probably the global warming that'll boil us. Or maybe some friendly nuke exchange if we're really unlucky.
Great work, Matt. Those graphs are very illuminating.
More analysis on what 2008 will bring using upcoming megaprojects can be found here:
Delays Will Tighten Global Oil Markets (PDF), Rubin, CIBC World Markets, Jan 2008
If you also add in the contribution from new projects that where brought online during this time period you can determine the underlying decline rate.
Increases without new projects would be from excess capacity brought online or infield drilling which
is basically the same concept.
So by removing the effects of both excess capacity and new projects we can get a good handle on the underlying aggregate decline rate.
It will be interesting to see how this works out in practice.
One thing I noticed when looking at Megaprojects for older years was the limited extent to which they actually seemed to be correlated with production increases. Most of the increases seemed to come in places like Saudi Arabia and some other OPEC countries that had excess capacity, and did not depend on the presence or absence of Megaprojects. Russia also generated large increases in production, presumably because of new technology applied to old fields, but these did not seem to be not reported as Megaprojects, either. It may have been that in past years the IOCs were more conscientious about reporting Megaprojects than NOCs.
You stole the punch line :)
Exactly and this is why I'm a bit dismissive of the mega projects approaches. Not that its not invaluable information but the recent increase was primarily from pushing our fields harder either through rework or bring excess capacity online. This has simply increased our depletion rate. The lack of impact you see from mega projects indicates that the real decline rate has probably increased which makes sense since the depletion rate has increased. This is why I think the downslope will be steeper then the upslope for production since new production will be agianst higher and higher depletion rates eventually and I think now coupled with declining global production rates that is showing up in the price of oil and will eventually have to show up in the reported production numbers.
In Texas for example the depletion rate was increased significantly at the peak and failed to result in production gain well before production itself actually began to fall. And further extraction technology advanced significantly as the US peaked and declined. The global peak is occuring in the context of both advanced extraction technology and a political that prevents its use in a significant number of countries.
At the minimum I think the production gains since 2002 are temporary and will drop off rapidly because they are primarily the result of increased depletion. In addition a lot and my opinion close to all of the reason we maintained production rates as high as we did since the 1990's is the result of technology and increased depletion so I don't expect the steep decline to slow down once it starts.
However if new field production is really showing up in global production and you can show that increases in depletion are not a big part of maintaining the current production rate then I'm wrong and we will remain flat or grow production at least through 2010 if not longer.
Note the US military which is capable of commandeering any traditional oil sources if needed is working rapidly on running on alternative fuels. But I guess this means they are just being extremely foresighted to figure out new sources which might be a issues for the military in 2020-2030 if we have a symmetric peak at 2010 or later or they plan to be real nice to civilians and let us use oil for our SUV's while they use CTL for their tanks and jets. However given the time lines by starting now they would be able to phase in CTL over say 2010-2015 which matches my expectations. If I'm right the military would have difficulty getting oil by 2015.
So ...
memmel-
You will find this is not the first time I have said this. I pointed this out to Stuart, when he first started the Megaprojects.
http://www.theoildrum.com/node/3347#comment-275488 and following comments.
I presume what you mean by
By this, I think you mean that the only way we have increased production since 2002 is through "better straws", but this will just leave the fields more depleted. I don't know whether 2002 is the right year, but I am sure this is happening to some extent.
You are right. The military certainly acts as if they believe in peak oil.
Yes better straws. 2002 marks the start of a surge in the better straw approach but its been going on for decades the development of horizontal drilling and more extensive use of water/gas secondary recovery earlier in the fields life are probably the two critical technologies that pushed up depletion rates. However the decreasing field size also plays a large role.
In general since the late 1980's early 1990's we have seen most of our reserve increases come from backdated old discoveries not new ones and a steady increase in our technical ability to extract at both high depletion rates and high production rates. In general the oil industry loves to use production rates to justify reserve levels. We have seen only Shell write down its reserves I can't imagine that they are the odd man out. Sort of like banks right now not marking down their losses but playing a game. They are now steadily marking down a few billion each quarter and saying this is the last markdown. And some are still not marking much down. The point is I think that all the majors and if forced obviously a lot of the countries would need to make serious markdowns in reserves. Your post showing reserves and production where not correlated was in my opinion one of the most important posts on the oil drum.
http://www.theoildrum.com/node/3664
This is critical because most models outside of HL feed in this data as inputs to the model.
HL itself is a symmetric model so its not going to catch asymmetric production profiles.
Although the US has a good fit to HL it also has 50% of the worlds oil wells. We cannot expect
this kind of intensive drilling world wide esp as a global peak increases the EROI of production.
Thus from high level arguments we can see that most approaches to estimating future oil production
can be significantly high.
We have all kinds of facts which all point towards the high possibility that technology has already saved us as far as oil production goes.
Yeah the way the military is acting was unnervingly consistent with what I'm thinking is going to happen.
And you have to assume if anyone really knows the status of oil its them.
And this is not just because they want to invade Iran since they could easily reduce civilian usage if needed for quite some time. Thats what really bothered me about their actions since it means they are worried about getting any oil within the next 5-10 years or they would have not started on a CTL replacement wedge project right now. If you did not find the military interest in CTL alarming you should.
You can't be serious. You are talking about a military that could be rolled up in short order in Irag when faced with a serious opponent (Iran)(see what William Lind says - pro-Yank, as I am not.) Indeed, you are actually talking about - bar nukes - what I have characterized, accurately, as pound-for-pound the weakest military in the history of the world, whose only historically close anologues are the Fascist Italians.
Foresight? From people that lost wars against Korea and Vietnam, and who are losing, as we speak, in Afghanistan and Iraq? And who will lose, catastrophically, against Iran, shortly? (Caveat: unless the Iranians show a spectacular failure of imagination ... something all too common across the world nowadays, and so quite likely).
The US couldn't even afford its loser wars if the Chinese and the Japs weren't paying for them (which of course they are ... c.f. the 'failure of imagination' point above ... those stupid bastards might yet live to rue this ...)
Eric Blair posted some interesting comments on another article of mine:
http://www.theoildrum.com/node/3747#comment-322714
He posts these links, to a book called "Nemesis: The Last Days of the American Republic" by Chalmers Johnson", and a review of that book.
http://www.amazon.com/dp/0805087281/ref=nosim/?tag=nationbooks08-20
http://www.bullnotbull.com/archive/chalmers-1.html
A couple of quotes:
(quote by Johnson of an analyst)
It seems like there is a tie, though, between our supposed military might and out ability to run a huge balance of payments deficit year after year. It seems like we have to keep up the look of being a major world force, if we want to keep buying huge amounts of goods on credit.
Franz--
We (the US) has not won one for quite a while (unless you count beating up a few ex-CIA employees of the month in Panama, etc.).
Americans are getting shorter and dumber, and that has translated to the military.
In all the cases since WWII that you have mentioned America did not fight a all out war. We limited the war for political reasons. Considering the US has a wide range of biological, chemical and nuclear weapons at its disposal not to mention some serious conventional firepower not to mention kinetic spaced based weapons that could rapidly be deployed and rival the effects of a nuclear blast. I disagree with you. America can win any war we chooses to win. In winning however the potential exists to touch of a broader nuclear or biological/chemical war. But don't confuse the limiting of wars for political reasons with actually losing them. And as times get more dire the political constraints will become less stringent. Your a fool to underestimate what America could do if pushed into a corner.
Totally agree. If America takes te gloves off, you don't want to be the one who picked the fight.
And yet, there are examples of nations bankrupting themselves through military adventurism/overreach throughout history. Given the US is *already* essentially bankrupt, how does this work?
I dub thee Sir Kool Aide Drinkalot.
Cheers
You are only talking about firepower. In some wars, firepower is the determining factor, in other wars not.
The USA lost Iraq War II because of a lack of understanding and very poor strategy, not for lack of firepower.
We may yet lose in Afghanistan. Again, not for lack of firepower. More firepower, killing more Afghanis, will *NOT* turn defeat into vistory.
For they made a Desert and called it Peace
Alan
I don't believe that the US could win a war against China over Taiwan. In war games with the Indian Air Force, US pilots won simulated encounters against Indian pilots flying Chinese designed aircraft only so long as their satellite targeting systems were operational. When the sat based systems were switched off, Indian pilots prevailed against US pilots. In the event of war the 1st thing China would do would be to take out all the US military satellites, as they're fully capable of doing. The US military is so utterly dependent on its space based targeting systems that it would be at a great disadvantage if it had to fight "blind." Another thing is that the US Navy seems unable to detect Chinese attack submarines. In naval exercises near Guam, a Chinese sub tracked a US carrier group for over a week before surfacing in the midst of the group. The carrier group had been pinging yet had no clue the sub was there until it surfaced. It could have sunk the carrier and any of its support craft at will.
In the case of a full scale nuclear exchange between the US and China, both nations lose.
Again if the result is global nuclear war so be it. We where willing to go to the brink of global nuclear war and beyond in the past for far less provocation. As far as china goes the US would probably come out nominally better in a nuclear exchange and I'm pretty sure we would launch a first strike if needed.
Your missing the whole point. If pushed the US can and will do what ever it takes to win even if this means destruction of a most if not all of its major cities and the major cities of most of the world in a nuclear exchange. I'm pretty sure the Russian's where aware of this during the cold war and I'm sure that China will understand this in the future.
We are the ones that bombed Hiroshima lest you forget to save American lives.
Are you sure you know what America would and would not do esp if it becomes controlled by a fascist leadership.
I'm not sure what the body count is but the US is certainly a contender for having killed the most people during the 20th century. I'm pretty sure we have surpassed Nazi Germany and its a probably a close call between us and Soviet Russia. However I suspect we are pulling ahead.
Given that we have killed millions to gain and keep our position I've got no doubt that we will do whatever we have to even if it means nuclear war.
The concept of destroying a village to save it is American.
Demand destruction can take a number of forms it may even mean sacrificing your unsustainable large population centers for the greater good of the wealthy.
I'm sure the Chinese understand this the Russians do.
This is false. The war in Iraq is pretty much an all-out war, short of large-scale nuclear weapons (there have been some small-scale nuclear weapons used). Yes, the government could try to impose a draft, and it would be immediately refused by the public.
Odd as it may seem, the Mighty US Army really was fought to a standstill by the Iraqi resistance. If the US military doesn't leave quick, it might be destroyed in place.
It is not an all out war. An all out war would have been a stalin style operation settled after half a year with the non submissive populations eradicated. All out war would have been a resource efficient genocide and not a relatively carefull application of extremely expensive high tech force.
Lots of people like hating USA but USA have a long way to fall before turning realy evil.
Source for this nuclear claim? Dates/times?
All out war includes the US Army's reduction of Aachen. We aren't using Aachen tactics on Iraq. What the US military is doing in Iraq is extremely restrained in comparison.
All out war was Nagasaki and Hiroshoma. All out war was the fire bombing of Tokyo. All out war was the inferno of Dresden. All out war was the entire Eastern front between Germany and Russia.
We do not see all out war today. We see complex restrained dances.
Little bit of selective leftist cherrypicking there I think. Care to mention WWII and the Cold War. Korea wasn't a loss but a draw. Saddam got rolled in pretty short order. So did the Taliban. I'd count that as wining the war. Winning the peace...well thats another thing entirely.
Military readiness management is far different to strategic military engagement which is a political decision. The US military does not decide which wars it is going to fight but it must be ready for all threats and if they see peak oil as a threat, you better be damn sure they are going to do something about it. If CTL is that solution then they will do that.
Increases without new projects would be from excess capacity brought online or infield drilling which is basically the same concept.
Infield? INFILL. INFILL!!!!!!!
Sigh....
Hmm I was also including rework of a older fields etc. Infill is a specific type of older field rework.
Maybe instead of Infield I should saw reworked fields but I also mean undeveloped old discoveries ? Its my catch all term for oil production that not a new discovery and brought online ? Infield is probably not a good one as you point out.
I like this graph the most: Figure 1 - Incremental Oil Production Stacked with Declining Groups at Bottom.
It gives an immediate picture of the current oil production, by showing declining vs. inclining that seem to cancel each other out at a flat rate of production, i.e, a plateau.
It makes sense that a plateau would be the first evidence of a Peak. The idea of some French alp pinnacle as analagous to peak oil was apparently we look in the rear view mirror, a misleading notion. However, that says nothing regarding how fast the descent may be once it ensues.
I agree that it makes sense for it to be a peak plateau. We are talking about the amalgamation of oilfields throughout the world. There's not likelyh to be sharp moves in either direction unless there is a mjor above the ground event. Hey, is the water getting hotter in here? Probably just my imagination. Great work you guys.
All true, I think. But we can see clearly from these charts how it might become a rather steep downslope quickly enough. In other words, being three years into the plateau, how much time do we have left before the decline curve shifts into 1st then 2nd then 3rd then 4th gear?
The key for me at this point in time is Russia. We all know of the fall in production during the break up of the USSR. But look how steep the rise in production was. How often have we heard here on TOD that steep increases seem to correlate well with steep decreases? Russia is currently at 1%. While it's nothing more than supposition and instinct, I see a very fast fall for Russia. Perhaps not quite that of Cantarell or the North Sea, but steep. Given that upslope, though, could we see the same curves as for Mex. and the North Sea?
Cheers
It is difficult to say, but new technology seems to lead to steeper decline rates.
This type of analysis doesn't really look at decline percentages. To do that, a person really has to use ground up (as opposed to incremental) data. Since Russia's production is land based, and reflects the production of quite a number of individual fields, its decline may be slower than in some parts of the world.
Russia's fall and rise was purely above ground factors so you have to split this out.
It has no geologic underpinnings. However now we have them back on track so to speak and adopting advanced technology. I think that Russia will be fairly symmetric in production since they in a lot of ways are following a technology adoption scheme similar to the US but shifted in time. Now as the field production drops Russia has the leeway to apply western extraction methods. Also most of the fields are on land which makes it much easier to do exhaustive extraction.
I think whats missing in a sense from HL is how hard it is to keep decline rates close to the HL curve. I don't know the number of wells drilled in Russia but I'd have to guess that they could well be second behind the US. Also a lot of their production is high water cut 90% plus similar to the US. This tends to be limited by water handling not oil thus throttling back the depletion rate.
So overall I'd expect Russian declines to pretty much follow HL. Note however that the US is starting to get significantly off curve if you will for HL. The dogleg seen in the HL plots is now probably significant and we are at a sort of plateau. Its late in the extraction cycle but it looks like we are getting a asymmetric production profile with a plateau forming this implies a steep drop back below the symmetric production curve for the US. So any time you get a aggressive extraction campaign regardless of the depletion level of a region you can get a plateau and thence drop.
So you could well see Russian production drop a bit until prices increase more spurring serious investment in extraction then a plateau for a few years followed by a steep drop.
For KSA I think unlike most people that they do maintain a real spare capacity level and they maintain production by eroding this. Also they are aggressive technology users. Both factors will lead them to follow a stair step like pattern downwards. With production dropping by a significant amount periodically.
Since they have a buffer they can for the most part time this drop with external events to hide the real reason.
So you should see KSA drop plateau for a bit then drop again probably at 250-500kbd increments.
The basic point is that these plateau's esp for post peak regions are not good since they signal increases in depletion rate.
I think Canada's production will grow more than is forecast. From the portion of the Bakken formation in Saskatchewan. Also, the new THAI/Capris recovery methods for the oilsands in Alberta and Saskatchewan.
I think the US is heading back into growth mode as well. Bakken, gulf of Mexico. Plus enhanced recovery could start making a bigger difference as well.
I think Brazil will do better than is forecast because of the offshore oil.
Africa would be doing better if Nigeria stopped flaring natural gas and using that as a fuel/energy substitute.
Over the long term, it is possible that the areas you are looking at will do better than what we are forecasting. I think there is a question, though, when we get to as short a time period as 2008. For this time-frame, production pretty much depends on infrastructure that has already been built.
One thing to keep in mind with Brazil is that in many areas, off-shore oil has peaked and declined pretty quickly. If that is the case for Brazil, it may take a whole lot of projects just to maintain the status quo.
"From the portion of the Bakken formation in Saskatchewan."
show us the data.
Do you think there is potential for a floating HB facility that can be used to exploit stranded gas to create ammonia? Or is the gas flared due to its poor quality?
Wish Buckminster Fuller was still around, I think he could have worked pretty well with Amory Lovins
I don't think in most cases stranded gas is flared because of its poor quality, although in a few cases this might be true. It is usually just too expensive to build pipelines to take it somewhere.
I understand that in the Middle East, there are plans for fertilizer plants, to make use of stranded gas. I am afraid I am not the one to talk to about floating HB facilities.
I don't see any comment on the recent (fairly steep) production icreases. Anyone have any ideas? Misreporting? or is the clue in the graphs somewhere? Saudi is the only obvious one but that only seems to account for about a third of the recent increase.
Marco.
The main increases, some rebounds from earlier drops in August 2007 (>100 Kb/d, rounded to the nearest 50 Kb/d):
US: 100 kb/d
North Sea: 300 kb/d
Mexico: 100 Kb/d
Saudi Arabia: 500 Kb/d
Iraq: 400 Kb/d
Angola: 250 Kb/d
I think Saudi Arabia can keep production at a higher level for a little while. There is a question regarding how long. They have a megaproject coming on later this year, but it is not clear to me that higher production can hold until them. Saudi production is still quite a way from its peak production back in 2004-2005.
Iraq and Angola are both fairly variable in production. The recent uptick seems to reflect slightly less violence.
The North Sea and Mexico have some variability due to planned maintenance and weather conditions. What we are seeing could be partly random fluctuations down in about August 2007. These conditons lessened later in the year.
The real test is how long this higher production will hold.
Columbia has massive deposits of heavy oil. As heavy oil technology imporvements and a reduction of violence coincided; there is some hope in the potential for future developments there.
http://www.rigzone.com/news/article.asp?a_id=59398
"a reduction of violence"
indeed, a number of companies are exploring in colombia for more conventional oil. mostly canadian companies, afaict.
but how do you invision a "reduction in violence" taking place ? is the cia planning a withdrawl ?
Looks like Russia is flat/down for now......
Wire: BLOOMBERG News (BN) Date: 2008-04-04 14:00:15
Lukoil Plans `Big Acquisitions' This Year; Cuts Output Target
By Torrey Clark
April 4 (Bloomberg) -- OAO Lukoil, Russia's largest
independent crude producer, plans ``big acquisitions'' this year
after cutting the output target for its existing oil fields,
Chief Executive Officer Vagit Alekperov said.
Oil output, not including possible acquisitions, will
increase 1.8 percent to 2 percent this year, Alekperov said in
St. Petersburg, according to an e-mailed statement. In January,
he said combined crude and natural gas production may rise 5
percent to 7 percent in 2008.
``The company is preparing for big acquisitions,''
Alekperov said. Lukoil is still looking to buy refineries in
southern and northern Europe, Alekperov said. He declined to
comment on whether the company would by ERG SpA's refinery in
Sicily.
Russian oil production may fall in 2008, the first annual
drop in a decade, hampered by rising costs and harder-to-reach
deposits, Natural Resources Minister Yuri Trutnev said last
week. The country's economy has grown for the past nine
consecutive years, buoyed by a 58 percent surge in oil output
since 1998.
Output from its West Siberian fields have been declining
faster than new projects are brought on line and new
technologies applied. Lukoil's oil production in Russia dropped
to about 1.8 million barrels a day in the first quarter, 2.9
percent less than in the year-earlier period, according to the
Russian Energy Ministry's CDU-TEK dispatch unit.
Thanks Matt for a really useful post. I guess the crucial question is what will this look like in 5 or 10 years time.
WT would it be possible to do produce similar graphs for net exports, that could be more telling.
BTW I am grateful for the ELP plan. I have the same disposable income as people who are earning 50% more than me.
Thanks again to all who contribute here its a truly impressive resource and a good mix of ideas, witty comments and wild speculation. Keep it up :)
Congrats on your decision to live simply (I just wish we were presently living in a two bedroom rented townhouse, where I could walk to work).
Here is our work on the Top Five Net Exporters. Their combined net exports declined about 800,000 bpd in 2006 and I estimate about one mbpd in 2007 (total liquids).
http://graphoilogy.blogspot.com/2008/01/quantitative-assessment-of-futur...
I think that we may be looking at something akin to a hyperbolic increase in food and energy prices, as prices are set at the margin by increasingly desperate food and energy importers.
We live in a modest 1br apartment in the dc metro area. I didn't need ELP to know I dont need a whole lot of wasted space, I hate cleaning. Actually I think its a great time to buy a modest foreclosed condo in the DC metro area with walking distance to the metro and shopping/nightlife . Those folks living in the outers suburbs will start fleeing for inside the beltway as long as gas prices stay high. Even I understand that Gas prices are likely to stay in the 3.50 range while demand destruction takes over and people find alternate ways to get to their job.
theantidoomer, take care - judging from what is happening in many parts of the world now the inner cities are NOT the place to be.
Just as there is 'peak lite' World Crude Oil there seems to be a simmultaneous 'peak lite' World Food Grains.
It seems that the country areas will always have food (since that is where it is grown) but when the excess stocks get low (even though production may still be at maximum) the country areas don't send the food to the cities, the food isn't available there at any price. You can live without oil but not without food.
The 'Net Exports' phenomenon applies to any traded commodity, not just oil, and the reduced trade can be within a nation as well as between nations. Watch and learn.
For examples of hoarding THIS WEEK ALONE look at rice - several leading exporter countries (including Vietnam, India, China and Eygpt) have now TOTALLY BANNED rice exports causing a run up in price of around 10% this week and 50% in two weeks.
http://www.ft.com/cms/s/0/4813b3c4-0250-11dd-9388-000077b07658.html
Let's hope the same does not start with oil.
But you can't grow food enuf to feed 6.7 billion people without oil.
"Whatcha gonna do when the well runs dry honey?
Whatcha gonna do when the well runs dry baby?
Whatcha gonna do when the well runs dry
Sit on the back porch & cry Cry CRY
Honey baaaaaaaaaby mine" \:D/
The trouble is it won't just be 6.7 billion - if we use all the oil for agriculture the world population can carry on growing for quite a while - until it can't for whatever reason!
Growing population is the underlying uncontrolled problem and no politician dares to even admit to it - collectively, we are not smarter than yeast. The particular environmental niche our species is exploiting, fossil fuels, is finite and short lived - get used to it.
I wonder if oil will turn out to be the Liebig's minimum to ensure maximum food - in countries that import a large percentage of their food needs I suspect not.
Hyperbolic, as in in asymptote. Now your talking.
Speculation? Not!
Let the data speak for itself. It is interesting that speculators are long and commercial contracts are net short. Do the commercial contracts include hedge funds or strictly refiners and large oil users like airlines? Why are they short?
I forgot to mention that this is the number of outstanding light sweet crude oil contracts. (1 contract = 1,000 barrels of oil) Source: CTC Commodity Trading Commission. Note: Commercial + non-commercial is not equal to reported. I'm not sure what non reportable contracts are.
Excuse me if this is a naive' TOD question: Since this is the end of March, where is the Peak oil update chart ending Mar. 31st? Still in the works?
Oil data comes out awfully slowly. The data used in this analysis is that from the United States Energy Information Administration (EIA). It doesn't come out until about 70 days after the end of the period, so at this point, the most recent data we have is December 31, 2007 data. Hopefully January data will come out in the next few days.
70 days?! Doesn't infuse a lot of confidence in the Govt., especially as we await the down slope after the plateau of Peak Oil. Thanks for the information. I'll stop checking Peak oil update awaiting March data.
Its actually worse that. Semi real data could be delayed by 4-6 months.
First you have the reporting delays.
Next if production is falling the reports are as far as I know voluntary your free to use your capacity number for production. Or any number you wish for that matter. In the US their are a few more checks and balances. Outside the US the tanker trackers keep things reasonably honest.
So you have a lot of wiggle room if your in decline before you have to report. I you feel the decline is politically sensitive then hey don't report it. Venezuela for example reports some fairly bogus production numbers routinely these days.
Eventually of course you need to bring the number close to reality. But when is a unknown.
Finally if you have enough oil storage you can draw down storage to cover a temporary drop that turns out to be not so temporary.
Import data is also spotty with only a few countries reporting so you can't use it to verify production and tanker traffic is export only. Internal consumption numbers in exporting countries are the difference between the fuzzy production and exports. So internal consumption numbers are fuzzy and can be used to hide falling production. I'm not dismissing WT's export land model at all just saying that splitting export land effects from production issues is not trivial. I think given that data his projections are pretty good. Also we know per-capita oil usage fairly well in the US and this can be used to prevent completely bogus consumption numbers. By this I mean your not going to consume 10 times the amount of gasoline that the average American does or your basically in your car 24/7.
Statistically their is about a +/- 1mbd error in reports. I think their is also a systematic error elevating the numbers thats on the order of 1mbd. So you can see that eventually given the error the numbers line up with reality but if production starts to fall fast like I think it is price is your only sensitive metric to the current state of the oil industry.
So your should lower your confidence quite a bit more your not talking about one government but many with political agendas.
So the data isn't very good and the analyses & projections are even worse. Take all the charts & grafts with a grain of salt. Don't obsess over the short term ups & downs. Take the long view & relax. We are living in exciting times. Terrible & exciting. We have the great fortune of living thru & witnessing not only the downfall of human civilization but also a great mass extinction event, the likes of which hasn't been seen for 65 mys. What drama! What more could we possibly ask for?
International Energy Agency (IEA) also puts out data. In the last year or so, it has differed a fair amount from the EIA. My level of confidence in the IEA data is lower than in the EIA data.
Just a thought for everyone to ponder here: why doesn't anyone start collecting and posting articles that look at "progress" in the review mirror. Here is a small example I've pulled off msnbc.com:
http://www.msnbc.msn.com/id/23744617/
It talks about the comeback of turboprops in the airline industry as jet fuel costs rise through the roof - up 70% over the last 12 months. Goodbye jet engines, hello turboprops - again! These relics were supposedly resigned to history, but now that it appears we're heading down the back end of hubbert's curve, they're staging a comeback. How many other "relics" will be revived over the coming years? And how long will they last before they truly are left in the annals of history?
There will be a lot of modernization of technologies that were set aside by cheap oil. Airships is another example that is coming back.
Lead Zeppelin
A interesting thing to do is to figure out how fast our goods need to be transported. I've done it a bit. When I look at various items for sale. For example winter clothes need to arrive before winter. Adult clothes are less delivery sensitive than childrens.
Diaper supplies are critical :)
To some extent you have to take into account consumer expectations but 1-4 weeks for the physical delivery is not untenable. The return of maintaining stocks can also help.
Even better as you explore this concept is a move to local computer controlled manufacturing of goods with only the design being moved. As and example consider say pvc pipe. Right now its shipped in finished form no reason all the various parts can't be done locally as needed. This holds for most plastic and even metal items. This reduces a lot of shipping to refined bulk sources that could be turned into manufacturing goods as needed.
Also just in time manufacturing with storage of raw materials seems to be a good fit the the ELP concept. So if you take ELP as the goal then this seems to be the best solution.
You still have ties to your sources of raw materials but this is a natural tie. Also flexible/configurable manufacturing lines should have the same economies as optimized lines.
Its different in that any one item may be less efficient but the overall efficiency is actually higher since nothing is produced thats not used.
Whats missing is we don't have programmable factories. We have programmable machines and robots on a factory line but the line itself is not programmable. The parts of the factory line are not easily reassembled into new configurations and you can't synthesis a line for multiple products.
I've played with the concept of a universal micro chemical plant thats programmable to produce any industrial organic material and take the outputs of a synthesis as inputs to other processes.
So say you need to produce X this means you also get side products Y-Z and need inputs A or B or C. Its a sort of traveling salesman problem. But not intractable.
The reason we never did this is because cheap labor markets opened up in Asia and the move to automated factories could not compete with slave labor and for chemicals as the environmental laws became tougher instead of closing your process you simply moved to china.
As you can see in both cases cheap labor and pollution globalization has actually retarded technical progress toward systems that rival the complexity and capability of natural systems.
I believe there will be vast revolution in micro and local manufacturing.
If forced to operate with 30% of current oil use, there will still be relatively unlimited ability to move things by rail and ship.
The transition will be dicey.
The key is bulk good ore plastic oil certain food stuffs etc can be easily stockpiled and are not stressed for timely delivery thus the transportation of these can be adapted to meet the best way to ship these goods. Given a good design bulk carriers could also work with different loads thus the problem of returning empty might not be a issue.
The ancients solved this problem with the ubiquitous amorphae in some sense this is our 55 gallon drum. The problem of changing contents can be solved by simply exchanging jars or drums. We also have our container ships. Given better liquid containers we probably could create a sail powered unified carrier that can carry liquids or other goods.
By going this route the ships sail as fast as possible and the ships cargo is varied.
Assuming storage of the bulk cargo by importers you can get a nice steady stream if inputs up to a certain point. Larger custom carriers are still valid.
The ancients profitably shipped a wide range of goods including wheat and wood that one would not consider necessarily a profitable cargo.
You probably will still ship manufactured goods around when it makes sense but it seems like balancing trade vs local manufacture and slow delivery of basics would work out well. Only high value handmade luxury items would generally be shipped around. Common goods would be manufactured locally. In addition complex items like computer chips would probably still be made in certain regions.
As you see the bit thats missing in the world now is just in time manufacturing. The ancients actually did better than us since the artisans where present in every large city and only raw materials where needed. We no longer have the equivalent of the blacksmith and carpenters in every village. Thats the hole if you will in ELP and its a big part of my decision process for a post peak homestead. So cities with a reasonably rich industrial base is important. But then we bump into the size issue.
So I'm actually looking at towns between 20k and 150-200k surrounded by rich agricultural lands and good rail/water transports as ones that should be ok later on.
I might add I was a bit surprised that New Orleans did not look at that bad for ELP. I had always dismissed it in the past. But the only thing it must do is shrink a bit more so people are not living in the most flood prone areas and then take control of its flood control system and maintain it itself. I was surprised to see it was viable. However its been around for centuries so maybe I should have had a bit more faith.
Currently its a bit large for my criteria around 300k but the surrounding area could easily absorb half the population of the city and people could live denser. I'd expect that a few hurricanes without federal aid would result in the city quickly moving to a sustainable level with good locally maintained flood control.
On the flip side smaller towns in the Ohio/Mississippi valley which look good on the outset are too small to rebuild the protecting levees so these could well be abandoned as rivers become unmanaged. In anycase if your looking for a retreat paying attention to flood plains and the historic floods in regions is probably prudent given global warming and the possibility that we won't have federal aid.
Sorry for the sidetrack but it somehow fits in :)
We have a choice. Peak Oil, like the plaque of the 14th Century, is a civilization killer.
Like the plaque, we need only stop living in sewage, clean our house and kill the rats. The consequences may be global but, for the most part, you can build an economic lifeboat.
We can transition as a nation. Efficiencies in energy use can be increased from less than 4% to about 70%. Preempt the waste and you preempt Global Warming and Peak Oil.
We de-monopolized communications infrastructure in 1984. It took 6 years for the free market to hit a tipping point and since we have radically retooled our communications infrastructure.
If we de-monopolized transportation rights of way and power generation we would likely see a 3-6 year ramp to tipping point and then a radical re-tooling. Time to re-tool is likely to be 15-50 years.
The problem with Peak Oil is we missed our wakeup call in 1973.
City size and parameters to navigate the post peak transition would be interest to layout in an article. I think it is in the 5-30k size. I think Peak Oil is going to be great for world peace and terrible for local peace. It will take local collaboration to endure the transition.
Long term I think we will implement efficiency. In which case, transportation and electricity will be very much like Internet and cell services. Small monthly fees will provide virtually unlimited access. Alan posted this link on efficiency. We do not really have a energy problem, we are just wasteful with oil and whiny about adapting our lives to live, like most organisms, within a solar budget.
It would make a cool article. It would be nice is someone had real numbers on sustainable cities. I use a variety of different metrics as I think of them.
On huge reason to not go with the smaller towns say under 20k is medical care. You have a real problem providing advanced medical care below a certain population level.
Today we have medflights fast highways and local emergency care but this is obviously something that could easily get chopped. Along with firefighters police etc. Next the economies of most of these towns are heavily distorted to tourism or retirement communities. Pensions are another thing thats risky post peak. At first I was surprised that the 100-150k number kept coming up from a number of metrics but its actually close to what we saw in city states like Athens.
http://www.bbc.co.uk/history/ancient/greeks/greekdemocracy_03.shtml
The lower bound that I'm looking at may be less important overall then a good estimate of the upper bound before a population is not sustainable post peak. My opinion is your probably in trouble as you approach 250k even in a rich agricultural region. But this is my opinion only. I don't see any real gain in living in cities much over 150k and your just stressing the system at that point. Although the actual failure level is not known its a safe bet that as you climb past a 1 million you probably crossed it.
And on the low side diversity drops of rapidly as the population drops below 100k so you seem to have a sort of natural sweet spot for cities.
The radius depends on the energy requirements of transportation. Superb water and rail links extend the reach, even pre-oil.
Consider Chicago and New Orleans.
Chicago #1 rail hub, New Orleans distant #2.
Chicago has Great Lakes and seasonal access to North Atlantic. Limited access to Mississippi River system.
New Orleans has mouth of Mississippi, East-West Inter-coastal Canal, closest Gulf Coast port to Panama Canal (and Yucatan Strait). Also Lake Ponchartrain was important in 1800s and early 1900s.
Food
Chicago: Corn and soybeans south of Chicago, apples, dairy in Wisconsin, etc.
New Orleans: Downriver from most fertile area of the world, locally rice and fishing and limited dairy, etc. Easy access to tropical areas (bananas by sailing ship was a unique treat when visiting New Orleans in mid-1800s)
There is value in a limited number of larger cities, such as universities, mints, industrial activity, distribution centers, etc.
Even so, Chicago has a quite large population to sustain. Less of an issue in New Orleans. Small issue of hurricanes unfortunately.
Best Hopes for the Big Easy,
Alan
I am sure there are metrics that can indicate sustainability.
It seems that as long as you can maintain governance, you can extract enough resources to support as large a port city as you want. Although I suppose that nearby port cities might object. A port city can draw resources from anywhere on the planet. Wiki mentions 225K people for London in 1605. Edo had 1000000 by 1721 (although every 50 years or so it would be leveled by earthquakes or kaiju or something). Rome is also believed to have had about 1000000 people.
Inland cities are a different breed entirely, but even so will have river transport. No river probably means no city.
From my point of view large towns and cities are not singular entities but part of a network held togeather by unexpensive and fast transportation with electrified rail.
Well, coming back to a tiny niche market. Beyond that, we'd fill them with just exactly what?
We've already been having helium shortages, and helium is a byproduct, so that's not going to scale. A vacuum would be an even lighter filler, but good luck with the mechanical issues. Next up would be hydrogen, but the Bubble Wrap Generations will never allow that after what happened to the Hindenburg. Then there's methane, same problem as hydrogen and much less lift. And neon, far less lift and too fantastically expensive. Leaving us with, oh, maybe hot air, energy-intensive and incredibly bulky, making it even harder to control a craft that is already strictly a fair-weather friend?
We might indeed see more retro stuff, but all of those technologies were originally done on a much smaller scale amongst a far smaller population. Many simply won't scale very far. The ones that won't scale can't have any noticeable effect on our overall fuel or energy balance, and are thus of little relevance to the discussions here.
I think we are entering a time of niche solutions.
I also doubt that our current rules will apply post peak. Need trumps niceties.
Even hydrogen airships had pretty good safety records. The British could not even shoot them out of the sky until they found the right mix of high-explosive and incendiary rounds.
I doubt we will ever go back to passenger airships, but for fright and observation, they are pretty interesting.
The Navy had 168 airships in World War II. Convoys crossing the Atlantic guarded by airships did not lose a single ship to U-boats.
But my purpose in noting airships is that there are many technologies and skills that atrophied in the age of cheap oil. We have lots of opportunity to invent better and revive things like Stirling Engines.
I hope they get rid of new electric things that don't do much, like paper towel dispensers in ladies' rooms that you wave your hand in front of. A crank works fine.
I expect that windows that open and close will make a comeback, especially if we start having more power failures. So will walk-up buildings.
College dorms with cafeterias that are open on weekends make sense, if it is expensive to drive anywhere.
Why do you consider turboprop engines to be relics?
Rather than stacking all four of the categories, how about showing a graph of the sum of two different stacks - one of the decliners plus the peakers, and a second of venezuela/Iraq + the "growers". Since even the "growers" seem to be appraoching their own peak, this two-stack graph should show how the decline rate of the "growers" suggests that post peak will continue.
Thanks for the idea. Matt is in Australia, so is asleep at this time of day.
Matt stacked things a little differently in the earlier analysis.
One thing I would like to look at on a monthly basis is how production changes on a three group basis - 1. Known decliners (I think I would include 5/2005 peak in this group, plus other groups that are in clear decline)
2. Hopefully increasing - The top ten, which is the eight shown separately, plus Equatorial Guinea and Sudan.
3. The Swing group, - the stuff in the middle, including Saudi Arabia and Iraq.
The solution is really simple
humanity is the pollution.
so kill every body
who owns more than a million dollars
every body who drives a suv
every body who has more than 2 children
every body who has a gun or riffle
and soon enough we'll be living between green hills and daisies.
So while we not down to 1 billion people on this earth, humanity is the pollution.
"The solution is really simple
humanity is the pollution.
so kill every body"
You first.
"every body who has more than 2 children"
In the kind of misery you want to return to everyone will have more than 2 children unless they die first.
"every body who has a gun or riffle"
I see certain logistical problems with this.
"and soon enough we'll be living between green hills and daisies."
And dying of easily curable diseases.