General Dispersive Discovery and The Laplace Transform
Posted by Sam Foucher on October 3, 2008 - 10:15am
This is a guest post by WebHubbleTelescope.
 I find it interesting that much of the mathematics of depletion modeling arises from considerations of basic time-series analysis coupled with useful transforms from signal processing. As a case in point, Khebab has postulated how the idea of loglet theory fits into multi-peak production profiles, which have a close relationship to the practical wavelet theory of signal processing. Similarly, the Oil Shock Model uses the convolution of simple data flow transfer functions that we can also express as cascading infinite impulse response filters acting on a stimulated discovery profile. This enables one to use basic time series techniques to potentially extrapolate future oil production levels, in particular using reserve growth models ala Khebab's HSM or the maturation phase DD. [1]
In keeping with this tradition, it turns out that the generalized Dispersive Discovery model fits into a classic canonical mathematical form that makes it very accessible to all sorts of additional time-series and spatial analysis. Actually the transform has existed for a very long while -- just ask the guy to the right.
Much of the basis of this formulation came from a comment discussion originally started by Vitalis and an observation by Khebab (scroll down if curious). I mentioned in the comments that the canonical end result turns into the Laplace transform
The following derivation goes through the steps in casting the dispersive discovery equations into a Laplace transform. The s variable in Laplace parlance takes the form of the reciprocal of the dispersed depth, 1/lambda.
What does the term lambda really signify? A fairly good analogy, although not perfect, comes from the dynamics of an endurance race consisting of thousands of competitors of hugely varying skill or with different handicaps. If one considers that at the start of the race, the basic extent of the mob has a fairly narrow spread, roughly equal to the distance traveled. The value of lambda over distance traveled describes this dispersion. I postulate that the dispersion of the mob increases with the average distance that the center of gravity of the mob has traveled. Overall, we empirically observe enough stragglers that the standard deviation of the dispersive spread may to first-order match this average distance. The analogy comes about when we equate the endurance racers to a large group of oil prospectors seeking oil discoveries in different regions of the world. The dispersion term lambda signifies that the same spread in skills (or conversely the difficulty in prospecting equating with certain competitors having to run through mud or while wearing cement boots) would occur in the discovery cycle just like it does in an endurance race. The more varied the difficulties that we as competitors get faced with, the greater the dispersion will become and a significant number of stragglers will always remain. The notion of stragglers then directly corresponds to the downside of a discovery profile -- we will always have discovery stragglers exploring the nooks and crannies of inaccessible parts of the world for oil.
The basic idea behind dispersive discovery assumes that we search through the probability space of container densities, and accumulate discoveries proportional to the total size searched (see the equation derivation in Figure 1) . The search depths themselves get dispersed so that values exceeding the cross-section of the container density random variable x with the largest of the search variables h getting weighted as a potential find. In terms of the math, this shows up as a conditional probability in the 3rd equation, and due to the simplification of the inner integral, it turns into a Laplace transform as shown in the 4th equation.
Figure 1: Fundamental equations describing generalized Dispersive Discovery
The fun starts when we realize that the container function f(x) becomes the target of the Laplace transform. Hence, for any f(x) that we can dream up, we can short-circuit much of the additional heavy-duty math derivation by checking first to see if we can find an entry in any of the commonly available Laplace transform tables.
In the square bracketed terms shown after the derivation, I provided a few selected transforms giving a range of shapes for the cumulative discovery function, U-bar. Remember that we still need to substitute the lambda term with a realistic time dependent form. In the case of substituting an exponential growth term for an exponentially distributed container, lambda ~ exp(kt), the first example turns directly into the legendary Logistic sigmoid function that we derived and demonstrated previously.
The second example provides some needed intuition how this all works out. A point container describes something akin to a seam of oil found at a finite depth L0 below the surface.[2] Note that it takes much longer for the dispersive search to probabilistically "reach" this quantity of oil as illustrated in the following figure. Only an infinitesimal fraction of the fast dispersive searches will reach this point initially as it takes a while for the bulk of the searches to approach the average depth of the seam. I find it fascinating how the math reveals the probability aspects so clearly while we need much hand-waving and subjective reasoning to convince a lay-person that this type of behavior could actually occur.
Figure 2: Cumulative discoveries for different container density distributions analytically calculated from their corresponding Laplace transforms. The curves as plotted assume a constant search rate. An accelerating search rate will make each of the curves more closely resemble the classic S-shaped cumulative growth curve. For an exponentially increasing average search rate, the curve in red (labeled exponential) will actually transform directly into the Logistic Sigmoid curve -- in other words, the classic Hubbert curve.
The 3rd example describes the original motivator for the Dispersive Discovery model, that of a rectangular or uniform density. I used the classical engineering unit-step impulse function u(x) to describe the rectangular density. As a sanity check, the lookup in the Laplace transform table matches exactly what I derived previously in a non-generalized form, i.e. without the benefit of the transform.
Khebab also suggests that an oil window "sweet spot" likely exists in the real world, which would correspond to a container density function somewhere in between the "seam" container and the other two examples. I suggest two alternatives that would work (and would conveniently provide straightforward analytical Laplace transforms). The first would involve a more narrow uniform distribution that would look similar to the 3rd transform. The second would use a higher order exponential, such as a gamma density that would appear similar to the 1st transform example (see table entry 2d in the Wikipedia Laplace transform table):

Interestingly, this function, under an exponentially increasing search rate will look like a Logistic sigmoid cumulative raised to the nth power, where n is the order of the gamma density! (Have any oil depletion analysts have ever empirically observed such a shape?)
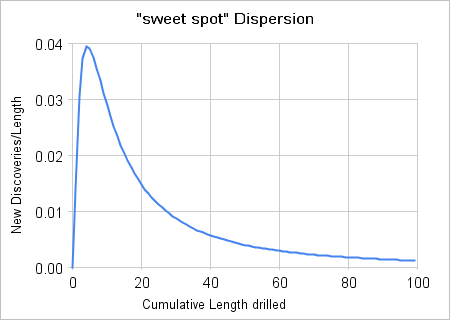
The following figures represent some substantiation for the "sweet spot" theory as it plots Hubbert's original discovery versus cumulative footage chart against one possible distribution -- essentially the Laplace Transform of a Gamma of order-2.
 |
 |
| Figure 3: Derivative of the oil window "sweet spot" Laplace transform. |
Figure 4: Eyeball fit to Hubbert's cumulative footage data. |
The following scatter plots (Figures 5 to 8) demonstrate how we can visualize the potential discovery densities. Each one of the densities gets represented by a Monte Carlo simulation of randomized discovery locations. Each dot represents a
Figure 5: A uniform density of potential discoveries over a finite volume gives a normalized average value of 0.5. This distribution was the impetus for theoriginal Dispersive Discovery model.
Figure 6: A damped exponential density of potential discoveries over a finite volume gives a normalized average value of 0.5. When combined with an exponentially accelerating dispersive search rate, this will result in the Logistic Sigmoid curve.
Figure 7: A gamma order-5 density of potential discoveries over a finite volume narrows the spread around 0.5
Figure 8: A gamma order-10 density of potential discoveries over a finite volume further narrows the spread around 0.5. At the limit of even high orders, the density approaches that of the "seam" shown as the solid line drawn at 0.5.
I discovered an interesting side result independent of the use of any of the distributions. It turns out that the tails of the instantaneous discovery rates (i.e. the first derivative of the cumulative discovery) essentially converge to the same asymptote as shown in Figure 9. This has to do more with the much stronger dispersion effect than that of the particular container density function.
Figure 9: The set of first derivatives of the Laplace Transforms for various container density functions. Note that for larger dispersed depths (or volumes) that the tails tend to converge to a common asymptote. This implies that the backsides of the peak will generally look alike for a given accelerating search function.
In summary, using the Laplace Transform technique for analyzing the Dispersive Discovery model works in much the same way as it does in other engineering fields. It essentially provides a widely used toolbox that simplifies much of the heavy-lifting analytical work. It also provides some insight to those analysts that can think in terms of the forbidding and mind-altering reciprocal space. Indeed, if one ponders why this particular model has take this long to emerge (recall that it does derive the Hubbert Logistic model from first principles and it also explains the enigma of reserve growth exceedingly well), you can almost infer that it probably has to do with the left-field mathematical foundation it stems from. After all, I don't think that even the legendary King Hubbert contemplated that a Laplace Transform could describe peak oil ...
Footnotes
[1] I recently posted here how the Oil Shock Model gets represented
as a statistical set of "shocklets" to aid in unifying with the loglet
and HSM and DD approaches
[2]  I use depth and volume interchangeably for describing the spatial density. Instead of using depth with a one-dimensional search space, essentially the same result applies if we consider a container volume with the search space emanating in 3 dimensions (see figure to the right). The extra 2 dimensions essentially reinforce the dispersion effects, so that the qualitative and quantitative results remain the same with the appropriate scaling effects. I fall back on the traditional "group theory" argument at this stage to avoid unnecessarily complicating the derivation.
Web References
- http://mobjectivist.blogspot.com
- http://graphoilogy.blogspot.com
- Finding Needles in a Haystack
- Application of the Dispersive Discovery Model
- The Shock Model (A Review) : Part I
- The Shock Model : Part II
- The Derivation of "Logistic-shaped" Discovery
- Solving the "Enigma" of Reserve Growth
TheOilDrum.com
Contact
- Content: editors at theoildrum dot com
- Tech support: support at theoildrum dot com
License

This work is licensed under a Creative Commons Attribution-Share Alike 3.0 United States License.
Huh?
Seriously, this is what I like about TOD; it forces me to learn. Thanks for the link to the "enigma of reserve growth." That was a huge help.
For further analogies, see the next comment. The math is pretty straightforward but inverted in the sense of no one thinks in terms of rates. Once you do that, it may help in understanding.
The "enigma" arises because no one ever thought to come up with a workable model.
A couple of examples of dispersion that I have analyzed since writing this post:
The dispersion in finish times among marathon runners
http://mobjectivist.blogspot.com/2008/09/marathon-dispersion.html
The dispersion in network latencies between two interconnected nodes
http://mobjectivist.blogspot.com/2008/09/network-dispersion.html
These give a bit of context into other domains. The math is the same but the perspective differs. In all the cases the goal is to reach the finish line first.
I need to digest this more. I've just been playing around with iterated sigmoid curves and they get more pronounced with a steeper inflection; maybe that's the discovery sweet spot.
On dispersive discovery generally I could point out that Fosset's plane was outside the 'container'. Also what is happening now with oil, gas and metals is technology enabling of already discovered reserves, some of the acronyms being EOR, ISL and UCG.
With the damped exponential or gamma forms, there is no strict "container", it just becomes more and more improbable as you go along the profile.
So if you are referring to Steve Fosset, the analogy is that there is a slight probability that they could have found his plane all the way on Mars -- it is just a very, very, very slight possibility using an exponential distribution. Yet the fact that it took this long to discover it makes sense to me, as the rate is effectively very slow in exploring outside of the zone they initially started searching. As you radiate outward, you effectively go that much more slowly as you have more ground to cover.
... EOR, ISL and UCG.
Sounds good. To first order, at least some of these may be the equivalent of the long tails in the dispersive profile. They don't get reported until now so have gotten deferred from the reserve accounting for quite some time. Yes, it could be that one of these technologies could turn into a Black Swan event. Yet, in general, you should make the new enabled regions exponentially more difficult or slower to process since that is a historically accurate observation.
Very nice. Not sure I get it all, but helpful none the less. I know simple is better, but is there some way to introduce a new component (multiplier) applied over the cumulative length of hole drilled? That number would actually expand Easy Access Volume, Difficult Access Volume and More Difficult Access by virtue of improved exploration/exploitationist efficiency and product price as the mean explorer matures? Not simply shift the population betwixt and between.
Could that component be modeled by inference by curve fitting the known increased reserves in existing fields over time? That retroactive reserve growth rate does extend to improvements in techniques in new efforts as well. Sort of an "attack effectiveness" rate coupled with a change of perception as to what is an ore (economic), not just a mineral (fossil). It might better suggest behavior of the "tail".
Also do the shifting sands of political barriers alter the relative availability of the access volumes or just move forward or push out discoveries as a function of hole drilled?
To some degree, that's in there already. The multiplier could be an exponentially increasing search speed. If you add this to the exponential Laplace profile you get the classic Logistic Hubbert curve!
1/(1+1/x) => x ~ K*exp(at) => 1/(1+1/(K*exp(at))The key thing to remember is that dispersion and the average speed (aka multiplier) are distinct characteristics. Dispersion is like the variance and the multiplier is the mean.
So with an inbetween search speed we would get something between the two?
Yes, you certainly can vary the speed along the path, and this will get you something in between the formulas to the left and right.
For example, here are a couple of sets of graphs demonstrating exponential growth and power-law growth over different container distributions. The first curve shown is the classic Logistic Hubbert curve.
As you can see, the power-law growth starts off faster than exponential but then slows down relative to the exponential. This gives you a much broader peak as it takes longer to sweep through the container volume along the critical interval.
Also what I find interesting is that the tails of the Hubbert peak have nothing to do with the underlying distribution of potential finds, but everything to do with the dispersion of search rates.
"but everything to do with the dispersion of search rates"
Applying the map to the territory, does it suggest that the various dispersed searchers in the various dispersed geologically and constrained politically basins will broaden the peak but not so greatly affect the shape or area under the tail?
yes. First, if you look at all those curves, the area underneath each curve is identical. (This is not always obvious on a semi-logarithmic plot, but trust me)
The speed in the search will effect the profile like squeezing a water-filled balloon. If you slow it down one place, it will pop up in another part of the curve
The speed also has an effect on the tail but apparently only in its slope. Once the fast dispersions sweep through their search space container and the slow ones start to approach the boundaries of the container, the actual distribution of discoveries ceases to become important. It essentially amounts to picking up stragglers from all over the search space. This is basically an entropy argument, as all the details in the original distribution (seam, uniform, gamma, etc) get washed out with dispersion.
Ugh, this brought back several nightmare visions for the second time today. This morning, a guy at work who is taking Calc III, mentioned using a cross product on a test this week on vectors.
Ditto, thanks for reawakening the PTSD of Convolution Theory. Wrote the major mid term with a hangover only a 22-year old could survive and somehow managed to pass the course.
Then we go down diffy-calc memory lane - ugh! (Well basic calculus really). However, the salient point to take home from this, and I believe HubbleT, may have academically alluded to, is the analysis lies in the frequency domain - not in the time domain.
In fact, the revelation and acceptance of frequency domain as the dominant mode of analysis is considered an informal right of passage in electrical engineering. With a novice's understanding of many other technically based professions, I think this same condition holds throughout. The rookie financial traders work in the time domain (daily, quarterly, etc), while the pro's work in the frequency domain; i.e. Buffet's latest cash coup by putting cash into certain positions. He saw the cycles, not the year over year quarterly earnings.
And to echo what has been said on this thread, this is why I like TOD. Where else can you read volunteer posts of this caliber that can stand the scrutiny of any peer reviewed journal? And, sometimes a joke is thrown in for levity!
Why do you need to remind me about Buffet? I took a huge (HUGE) bath on stupid mutual funds the last two weeks, and now realize that perhaps I should have been applying my "expertise" in signal processing to personal finances instead of trying to educate people on when we might deplete the world's oil supply.
Khebab, on the other hand, is probably a stock market multi-millionaire with his skill set.
My mutuals are tanking too. Sorry about the Buffet reminder. A young engineer in our office circulated a question about opinions or knowledge regarding the retirement mutual funds a couple of weeks ago. I responded with, "Who told you you get to retire? Didn't you get the memo? Retirement will be allotted by discretion with a minimum age of 82."
They took me seriously and I just had to laugh. However the last laugh may be on me if this does in fact become truth 15 years from now.
Mine are too. Collectively (PSPFX, OEPIX) around 50% down from their peak at the beginning of July.
Daily reading the dour news on TOD, as well as seeing ever declining inventories, I figured it would rebound any day.
Certainly I am not the only one who considers our energy resources - not finance, not real estate, not gold -to be the main support on which our civilization survives.
All the other resources we have are recyclable, all the gold that has ever been on Earth is still here, same with all metals, elements, whatever. ( with very minor corrections for that launched or thermonuclearly changed ). Our hydrocarbon energy resources are the sole exception to this. There is no such thing as recycled fuel.
What I am seeing confounds me to no end. Its like one knows the well is the only source of water - yet is selling it. The well would be the LAST thing I would sell. Take my gold, take my horses, but once I lose that well and what it provides, my lifetime can be measured in hours.
I think you're on the wrong track.
You have volume/dispersive depth L-lambda but L-lambda(transform 2d) in the really represents a median/standard deviation of a variant of the standard binomial probability function a.k.a
the Poisson probability function
Pr=e^-L * L^n/n!
gives the probability of independent events like find/no find occuring with an empirical mean of L(lambda) which is also equal to . The gamma probability function F, just gives the waiting time to the nth successful event is just 1 - cummulative poisson probability and the the exponential function is the gamma function for the first successful event.
These events are 'random' and mutually exclusive. They have little to do with finite volumes or finite depths.
Bayes Theorem which partitions events by conditional probabilities(infinitely?) would tend to prove that human judgement rather than a specific physical mechanism might be behind the logistic function.
http://en.wikipedia.org/wiki/Thomas_Bayes
There is a difference between what you use to describe a probability density function (PDF) and the application you use it in.
So for example, if you keep increasing the gamma order, you can transform it into a seam delta. It makes for an understandable mutable parameter. The mean and variance for each order of the gamma are well characterized which makes it a good statistical metric as well.
And plus I don't buy into that the only way you can understand the gamma is via Poisson statistics. That is a Stat 101 point-of-view. You can also get an order N=2 by convolving 2 damped exponential PDF's. This may be the result of a probability that a layer of oil gets diffused to the surface convolved with another exponential that says it starts at a given depth.
I would like to see the math behind the Bayes/human judgement approach. If it is worth bringing up, it might be worth demonstrating.
What your saying would be on top of if you will the geologic constraints or physical constraints of the problem. The probability of rolling a 12 with a normal die is zero. Its outside of the physical constraints. What WHT is proposing is the constraint under which you could apply Bayes Theorem.
I'd say the biggest problem is that a worse distortion using the runner analog is to consider the case of a distribution of sprinters and long distance runners with a small number of super athletes if you will that can run 20 times as long as the rest.
What happens with you introduce this inhomogeneous population vs assuming equality is interesting. Other constraints such as your suggesting would act to effectively change the population. For example methods that extract oil faster could be modeled using the runner analogue as adding more sprinters. Export land can be treated as removing some of the runners etc. Bayes would be another mutation.
In a perfect world production would be and exact mirror of discovery. Because of above ground factors this is not true so we know real distortions can be caused by economic and political events. And we know from the production vs sizes of fields vs quality etc that our actual oil production is heavily weighted to a small number of fields.
So then the issue becomes how important is the base discovery curve in predicting future production even if its on a sound mathematical basis.
You can certainly add in distortions but then how do you prove you have accounted for all of them ? I'd use export land as and example its significance was discovered very late. And Bayesian is great but how to you weight ? You can quickly create any answer you want even given that your also probably correct that Bayesian stats play a role. All that really means is that underneath the covers the system is non-homogeneous or its weighted. And we know thats true.
What really happens is it seems you lose all predictability to a large extent. However almost all the probable distortions serve the reduce the total amount of oil produced and steepen the declines that you pretty sure that what ever the model you use the real answer is probably lower.
And now to go a bit further a field this is actually the result that I seem to get as you attempt to add more and more shocks and feedbacks and other effects the real solution i.e how much oil will be produced in the future goes to zero. The only thing that keeps the curve from being a simple cliff is that the distortions themselves take time to build up and interact.
Again using export land will drive total exports to zero well before we run out of oil but it has its own doubling time and growth rate.
So the real answer for future production is it will go to zero well before we run low on oil.
How soon depends on the external factors and how you model them. Thus although I suspect your right and the better model is Bayesian our ability to actually create the right weighting scheme is limited. This is actually a problem that plagues neural nets and other AI methods.
Its not the algorithms thats the problems but the inability to either quantify effects or even show that you have "thought of everything" that hobbles these sort of holistic approaches.
The human brain gets around this by simply inventing and answer then using facts and fabrications to justify it. The art of the WAG.
Sorry for this tangent but my point is that if you start down this path of trying to add more and more distortions or shocks or what ever you want to call them you end up with two problems.
To many subjective weighting decisions and and obvious trend that the solution drops to zero much faster than the base equation suggests with the error making it harder and harder to predict when. Better maybe to be simple and wrong but realize it.
I also think a very interesting case is the one where no dispersion exists at all. This I believe happens in a few special cases. That of extinction, see the famous figure =>

And what happens in gold rush towns, where everyone uses the same technology, the number of prospectors accelerate quickly, and the collapse occurs suddenly. People jump out of this situation the minute they see the peak hit the cliff edge. Unfortunately, with dispersion in technology and geography, this isn't always possible to detect, and we get into the situation akin to the frog being slowly boiled alive. We don't know what is happening until it is much too late, and get lulled into a false sense of security by the slowly uncovered new discoveries. Gold rush towns know immediately when they hit the boundary, yet we as oil consumers don't and keep on saying "Drill, Baby, Drill", not knowing what diminishing returns lay ahead.
I call this "The Curse of Dispersion"
http://mobjectivist.blogspot.com/2008/09/curse-of-dispersion.html
Thanks WHT. I sleep much better at night knowing that there are people like you amongst us who have a far greater intellectual capacity than I can aspire to.
It reminds me that as much as we think we understand here how the oil gets from the well to our tank, there is so much more complexity, which is so remote from the consumers experience, that is built into the system that keeps the whole industrial-consumer economy going.
While I didn't understand anything much of what you said after "I find it interesting..." what I did take away from it is that we focus on a peak of production that is built on a very broad and complex production system that is made up of thousands of much smaller components. All that we can ever do is look at small samples of those components and try to get them to reveal their secrets through mathematical modelling.
Perhaps if there was a healthy dose of energy modelling put into financial modelling, we wouldn't have the mess and panic that is happening today.
Perhaps if there was a healthy dose of energy modelling put into financial modelling, we wouldn't have the mess and panic that is happening today.
A bit harder, but indeed just as vital. I think what makes it more difficult is the number of feedback loops built into the financial system.
O.k., after reading the comments by the mathematicians in the group, I am convinced the Tower of Babel was really the Mathematics depart of a Babylonian university.
I believe that even HL was mathematical overkill. All this much more so. I believe that what can be predicted about peaking, can be predicted using a simple graph. It will be somewhat wrong, but no more wrong than something more sophisticated. There are areas where mathematics is very powerful, and areas where it is totally useless. This is in between. MRoMI is low here.
Excellent, well said. This is verifiable as well. A few hours researching stories in Bloomberg about oil producing nations and a few more hours looking at the numbers on oil production will give you as good an idea about what to expect from production as all these models and formulas.
I disagree actually see my long drawn out post.
I think WHT is 100% right. And it serves as a baseline to work from. The time shifted discovery curve is for sure the best case model. We cannot pump oil we have not discovered. Next his methodology is spot on in my opinion.
You will not get this out of looking at production since production is not a predictor of discovery.
However the problem you run into is fairly simple. Lets take our economy as and example its based on the concept of infinite growth as long as we continued to increase our resources it was a pretty sure bet we would continue to grow. Thus the discovery curve is a excellent predictor for production during the growth phase. For the most part this is int the past.
However it becomes and upper bound for long term production. And looking at oil production or bottom up approaches become short term because they don't take into account depletion.
The problem is that when complex systems begin to decline it seems at least as far as I can tell we don't have the mathematical tools to handle them. Whats interesting is I ran into a similar problem when I was working on chaos theory. We have basically zero tools to predict the dynamics of chaotic systems. So it turns out that real post peak production is a similar problem. Or global economy is actually entering into this contraction phase for example and the dance if you will between global contraction and oil production is as far as I can tell unpredictable because of the nature of the system itself at least with any tools I'm aware of.
This failure of mathematics or at least the mathematics we know is what I find fascinating.
I've gotten interested in three problems chaos, wave mechanics, and complex systems. All three end in a sort of complexity breakdown and it becomes impossible to use math as a predictive tool that guides experiments we are back it seems to the place where experiment will have to lead math. Given that one of the problems is how our society will evolve over the near future this is not comforting.
Neither approach takes into account external factors or distortions thus both will be very poor predictors of future production. And worse both approaches are optimistic.
But you can't begin to get this out of looking at production the models play and important role esp the discovery model since any real model for production has to be based of a good understanding of discovery. Heuristics like HL are powerful but are not based on what we call first principals. Given a model built on a firm foundation one expects that it will produce a result that is similar to HL but HL in and of itself is not a "real" model of oil production.
And finally the real problem at hand is oil production over the next 5-10 years. Most of our models show that decline will be obvious within ten years and taking into account export land export decline will almost certainly be obvious within 5 years. This means that from five years into the future forward the world will be forced to deal with peak oil and what ever the real decline rate is. If we are lucky the models we have developed will be accurate enough to help policy makers decide how to deal with peak oil.
However its the next five years that are going to be the interesting part to say the least and in my opinion nothing I've seen is capable of predicting when and how we slide down the peak oil slope.
However given the above base models some exploration into extraction rates and recently some research into the financial problems and the impact they will have on oil production we do have some important results. One of them is that we will not see all the production come back online in the GOM after the hurricanes. Exactly how much depends on the details.
Your not going to get a prediction like this looking at production numbers and I've not seen it made any where else but the oildrum. And it would have been impossible to make without basic models like what WHT works on.
This failure of mathematics or at least the mathematics we know is what I find fascinating.
This is deep, Memmel. If this is the Holy Grail that you have been seeking out all this time, you have a kindred spirit here.
Mathematics allows us to probe into areas that our pea-brains struggle to comprehend. And when the math starts breaking down, I figure that we are completely lost in the wilderness. So, if we do enter into an oil/financial "collapse", and we have no understanding of what is going on, predictions will become purely arbitrary.
First, I just want to thank both you and the TOD editors. You for having put together this post and the TOD editors for being willing to host it and expose us all to alternate perspectives.
With regard to the remarks by both you and Memmel on collapse, would it be fair to restate this as the occurrence of a set of black swan events which take place on the boundary, or outside of, current knowledge domains?
The second aspect of this collapse would appear to be that it occurs too quickly for us to gain insight and understanding of it. In essence, real world events "speed up" and the dynamic exceeds our ability to interpret, rationalize, and react to it. Would you concur with that observation?
Tainter appears to provide the current accepted interpretation of civilizational collapse. I am not comfortable with Tainter but have yet to devote the time required for a through critique (the collapse of the Roman Empire was a positive event. Had it not collapsed our own civilization may not have had the opportunity to occur and Londinium would still be a small peripheral market town). Do you have any comment on your insights into collapse and those of Tainter?
Apologies for moving the goalposts on the discussion. It's what one does when one is mathematically challenged :-)
One telling feature that I think is vitally important to this discussion is that the search speed in the Dispersive Discovery model has to continue to exponentially increase to match the Logistic Hubbert curve profile. More directly, it has to exponentially increase on the downslope of the Logistic. As many a number-cruncher knows, when you take a large number and multiply it by a small number (the search spots remaining), the result is very sensitive to values in each if it isn't compensated by a constant additive factor.
You gave me a good idea. I will try to look at the noise characteristics on each side of the Logistic Dispersive Discovery curve after placing fluctuations on the search speed. This will likely be very revealing, and it may tell us about chaotic effects on the backside that Memmel is hinting at.
Thanks Web. I've been wandering the wilderness so to speak for a while seeing if we could come up with something tangible to convince people we are facing a serious problem.
The result is that mathematics seems to ensure that the crystal ball so to speak is cloudly.
We can do what your doing with confidence but as we step outside of this like you have to some extent with your shock model we suffer parameter explosion but worse a massive increase in uncertainty. As the complexity increases we seems to be forced into having to have better and better measurements. This leads eventually to the quantum limit. This opens up the reverse question which is is quantum mechanics itself the result of some underlying complexity ?
Everything I've seen about quantum gravity hints at a complexity explosion also happening in the small.
However
And I'll use this as and example.
http://www.iop.org/EJ/article/1538-3881/118/3/1177/990128.text.html
Regular orbits are dense in phase space. Indeed semi-classical approaches use the fact that quantum probability densities are highest around normal orbits to derive quantum analogs of complex systems.
Again we can reverse the problem and ask ourselves if this is actually a property of complexity and not just a property of quantum mechanics ? So we make the assertion that complex systems exhibit this property and even though the complexity seems to hide the right answer whats really happening is the system is concentrating around one of its stable regions or orbits.
In fact we have knowledge of complex systems that indicate that they indeed are capable of picking out stability.
http://en.wikipedia.org/wiki/Stochastic_resonance
This leads to a conjecture that complex systems tend to act as some sort of signal filter/generator etc they begin to calculate something.
Suddenly the problem at least for me becomes obvious as systems become more complex they start creating their own equations and laws if you will out of the basic laws of physics. You run into the problem of a turing machine trying to deduce the state of another turing machine.
Small wonder your seeing signal processing concepts start to emerge. Signal processing is simply a symptom of a calculation taking place.
Now its no wonder that Bayesian concepts can work and also that fairly simple dispersive theory works. In the particular case of discovery it seems that the complex system is working to determine a regular equation.
And I'll end this with and observation Wolfram was throughly discredited with his finite automata approach and in my opinion for good reason since he was unable to show how it worked.
But in my opinion he was both right and wrong. He was right in that complex systems exhibit the ability to calculate he was wrong in restricting the model to just finite automata.
The right way is the approach your taking and starting with signal processing concepts which can generate both regular and simple results and also effectively opaque engines or signal processors which work in non obvious ways.
And back to the top we know from both chaos theory and quantum mechanics that simple regular solutions are both dense and preferred.
The invention of classical physics was in itself dependent on this as is your result.
For complex systems the problem is we don't know the virtual coordinates if you will that the system begins to operate under. It works the same way but it synthesis its own coordinate space and the regular orbits are expressed in this unknown coordinate system. This can be seen with empirical methods such as HL we don't actually know what the "real" coordinates or laws are which underly the success of the empirical method. We don't know what its mixing together and what equations are actually in use. Its opaque and impossible to derive backwards if you will from HL to the real underlying dynamics.
This paper does a really good job of exposing the deus ex machina.
On a bigger scale we can be safe in assuming that history is and excellent guide to the evolution of our society as oil runs low. Left undisturbed the equation will almost certainly settle into one of the known modes common when societies collapse. We can given the above assert this with a very high confidence interval. And we also know from history that almost all of these modes are considered undesirable by the majority.
And last but not least we can even explain why we can't predict the future easily. I.e we cannot prove bad things will happen or the exact course the system will take before it stabilizes around one of the possible outcomes.
We can show that the regular solutions are all bad however.
I think that at some point in the future assuming we keep our technical civilization we will develop methods that allow us to detect the fingerprint if you will of complex systems and deduce what they are calculating. In fact signal processing itself ends with image recognition as its limit. Eventually we will have the math skills to see the image thats being generated by complex systems and thus quickly put them into a category.
Whats really funny is this is the reason I left graduate school I wanted to approach chaos theory from the approach of doing image processing and recognition or signal processing. In short I wanted to develop a way to see chaos.
I knew it was a signal processing problem and twenty years later you offer proof.
As and example Nate Hagens posted a funny correlation between music quality and I believe oil supply. I forget since it was just a funny graph. However the point is complex system always form patterns no matter how stupid its intrinsic. The formation of patterns is a signal and a sign of some sort of processing. Most pseudo science is actually based on playing tricks with this property of complex systems so real scientist tend to dismiss it. Its been hiding in plain sight for a long time. The properties are intrinsic. At one extreme we have these nonsense variables that people use to "prove" all kinds of stupid stuff. And at the other we have the classic equations. In between we have a grey area thats not been explored.
These are sensible and convoluted mixing of real variables in a complex manner.
Anyway good luck finding the signal.
And as I finish this it looks like our fate is sealed just as we begin to understand the problems we face it looks like the world has chosen the wrong answer.
I looked at stochastic resonance and don't think that Dispersive Discovery is as much analogous to that as just plain filtering, as in a high-pass frequency filter. The bulk of the finds occur over the fastest searches and the slower searches get attenuated and show up in the tails.
The other point is that dispersive discovery has more elements of entropy than of chaos in its formulation. Dispersion is entropy and because non-linear effects and feedback loops are largely missing, few chaotic effects shows up.
I still think chaos occurs on the back-end of the chain, where all the effects ted to compound. Since DD is still near the front of the food-cycle, this should not be as pronounced.
The one chaos analogy I can come up with is in dispersion caused by turbulence. Picture water running down a rocky stream. The fastest water is on the surface and the slower water is on the bottom, as the laminar flow is broken up by drag and chaotic turbulent vortices. This largely causes the dispersion of water flowing down the stream -- the classic experiment is someone dumping a bucket of ink in the stream and watching how quickly the dispersion spreads. Finding oil is much like this, the fast searches are like laminar flow, and the slow searches are like turbulent flow.
If some random noisy effect could excite the slow search and dissipate the turbulence, then the idea of stochastic resonance might hold some interest. But this is pretty much an abstract analogy and I am grasping for some relationship.
Stochastic would be the extreme case the point was order can arise from disorder.
Considering fluid flow is a lot better analogy. From a fluid flow perspective stochastic resonance can be viewed as the case where wind is randomly changing direction speed and whipping up waves. The point is you still get wave patterns forming even with totally random input. In fact surprisingly regular wave patterns are generated. Turbulent flow also develops structure.
The real search i.e if you actually looked at the historical search record has this turbulence in it if you will. WWII is a notable interruption in the search pattern for example. Along with numerous periods of political instability. Yet we see practically no hint of this in the results. On the other side we have rapid increases in our understanding of where to search and this also does not show up.
Dispersion seems to be strong agianst perturbations in fact your other post where you change the search speed shows that surprisingly we don't get a large change in the curve.
Now one thing you have not done is try changing the area under the curve I suspect that you can have a large change in area with the front sides of the search curve looking surprisingly similar.
Basically on the front side if your just searching harder and harder it looks like your finding more. A exponentially increasing search activity of a smaller total amount to find looks like a slower search of a larger region. I'd suspect you can have up to say a 30% smaller search area look the same as a large area with a different search intensity pattern.
Thats the strength and the curse of what you have discovered because you don't really know until you hit the backside what the real answer is. Only once the search pattern has moved into picking up the last fields do you really know what happened. And as this occurs all kinds of other perturbations that where previously suppressed become important.
Going back to the search pattern itself what probably happened is we actually accelerated our search ability all the way through it went hyper-exponential.
http://en.wikipedia.org/wiki/Hyper-exponential_distribution
The increases in capability look deceivingly like a exponential and thus the expectation of an logistic fit.
Normally I don't pay attention to the functional form but in this particular case understanding dispersive discovery is probably important since the concern is on the backside.
My opinion is you have discovered a incredibly powerful truth of physics on par with the classical laws of physics of the past. As with those laws the ramifications are far from clear but I find them potentially disturbing.
Your right but the problem is you can generate anything from the population crash of deer to a smooth decline depending on the details.
http://www.theoildrum.com/node/4530#comment-416830
And I doubt you can tell on the way up which is right.
1/Also traffic flow and washboarding of roads is included in the category of "order out of chaos".
2/The volume of the search container scales to the URR, so if this changes dynamically, you are modifying the URR over time. I am not sure that this is a valid assumption. You might as well start a new time-shifted discovery function.
3/As far as early predictive power, you can always model on the way up if you see an inflection point. I agree that there is not enough discrimination in the types of curve or the bounding URR without an inflection point.
4/The other approach one can take is to look at individual reserve growth curves which aids in the backdating of discovery data. Khebab and I are trading ideas on this, and I have collected some of the observations here:

http://mobjectivist.blogspot.com/2008/09/observation-of-shocklets-in-act...
I think reserve growth on individual fields has a more or less constant search (or weakly accelerating) since the lifetime is constrained. So if one aggregates the data, you can come up with an average characteristic function.
This is in my opinion valid. A perfect example is Alaska and offshore and now deepwater. We fairly exhaustively searched for oil onshore in the US then in Alaska and GOM and finally offshore. Another example is the North Sea the search and extraction of the North Sea was done fairly late in time. And even the Middle East was searched fairly late. I'd have to think that the fact that the search pattern was done in blocks does not really change the overall solution.
It just means that certain regions are more throughly searched before later regions. Right now for example we obviously have not extensively search Antarctica and a few places in Alaska and the continental shelf because of drilling bans.
I think whats important is that you can inject the concept of EROEI into the dispersive search
over time the energy expended to continue the search increases. Exploration drilling in deepwater is incredibly expensive in terms of time money and energy. Whats missing in a sense is that your seeing a need for a exponentially increasing search velocity and its being done with and exponential increase in cost in terms of time,energy etc.
Now we get to the crux of the problem discovery of new oil given how we searched makes it difficult to believe we could do it at and exponentially increasing rate. The search problem probably should be split into to components. The rate of new discoveries and the rate at which previous discoveries are validated and sized i.e reserve growth.
I'd LOVE to see dispersive discovery split into these two quite different issues mixing them is dubious since they are two entirely different problems.
I suspect we will find that the rate at which we where able to make new discoveries has fallen off rapidly and the dispersive rate if you will is much lower for new discoveries.
This leaves a lot of the oil we have supposedly discovered coming from backdated reserve additions. I'm highly skeptical of these numbers regardless of who reports them. Reserve growth is a political and economic issue not just a geologic one.
In my opinion the dispersive discovery model is capable of deciding if reserve growth thats been reported makes sense. I think that the rate of reserve growth vs new discoveries is a valid variable. And physically as discoveries taper off reserve growth should drop off rapidly. I suspect we will find that reserve growth has steadily increased regardless of the rate of new discoveries.
Dispersive Discoveries definitely follow a two-tier categorization. The first tier is the dispersion in finding pockets on a world-wide basis. This has an accelerating search rate because it is a long drawn out process that has lasted over a 100 years, with the attendant technical advances aiding the search.
The second tier is the dispersive discovery in making reserve additions to an already-established field or region. This search rate is assumed more-or-less constant because the field may taper off before the search really starts to accelerate. That is why most of the creaming curves or reserve growth curves don't show as pronounced an S-shaped cumulative function as the global discovery curves do. The pronounced lower "S" part of the cumulative is mainly due to acceleration in search, which is largely absent in reserve growth discoveries.
I've seen you post on this before. What I've not seen is you bring it together in one place.
I know Kehbab has posted discovery with backdated reserve growth removed.
The only issue or concern I have and actually have had for a long time is about reserve growth.
When I can find original papers about reserve for example.
http://www.ingentaconnect.com/content/geol/pg/2005/00000011/00000002/art...
The reason given is often better technical extraction. However this begs the question are you just extracting faster ?
Some links.
http://www.theoildrum.com/node/4311#comments_top
http://anz.theoildrum.com/node/3301#comments_top
http://dieoff.org/page176.htm
http://www.springerlink.com/content/m2lq38g2757352u5/
http://pubs.usgs.gov/of/2006/1328/pdf/of06-1328abstract_508.pdf
http://pubs.usgs.gov/bul/b2172-a/b2172-a.pdf
http://books.google.com/books?id=FG5kR26zeDEC&pg=PA142&lpg=PA142&dq=Rese...
Naively I assume the most reserve growth should happen shortly after the fields are brought online and should be sensitive to the number of new fields. I.e as new discoveries drop off reserve growth should drop off fairly rapidly.
The industry seems to report a constant and you say you assume a constant.
However given that reserve growth is often justified by technical advances its not clear
that the assumption of a constant is correct. And even if I'm wrong about that issue its not clear at all that reserve growth esp in mature fields is correctly assessed. In fact you have a good chance as fields get older that reserve additions are increasingly overestimated.
The reason this is really important is that we are new fairly well into the region where a significant amount of the oil we are pumping is coming from reserve additions.
Our problem post peak is how well did the oil companies who dismiss peak oil and depend on reserve growth to keep their value do at calculating reserve growth given that a mistake would not show up for 10-20 years down the road.
Everyone questions it. Assuming a constant for reserve growth needs justification and it would be nice to see if you have other dispersive reserve growth models which vary the rate of reserve growth on what ever physical grounds you feel are compelling.
Here is the way I look at it.
1 trillon barrels 100% certian
1.2 trillion 98%
1.4 trillion 95%
1.6 trillion 90%
1.8 trillion 80%
2 trillion 70%
The idea is that as we enter into the region that production is increasingly coming from reserve additions the probability that we actually produce the oil in the future decreases.
On top of this the production rate at each of these levels is suspect.
All the literature I've read suggest that neither the production rate or the absolute size of oil added via reserve additions is well known.
Time shifted original discovery oil is actually running low. I've of course not quantified it.
It would be nice to see how much oil was produced from the volume estimated from original discoveries and how much is coming from reserve additions.
As a field example Purdhoe is now producing oil from reserve additions which is fine but the production rate is quite low. As far as where we are at globally. I don't have the debackdated oil vs reserve addition estimate globally. And finally reserve additions during the first few years of production are probably much better then later additions so its not a clear cut division.
And finally my arguments about reserve growth are exactly the same as in this paper.
http://www.hubbertpeak.com/campbell/guide.htm
I further delineate Reserve growth into two aspects. There is the technical part which is estimating how much oil is below the ground. This starts up from a SWAG (scientific wild-assed guess) w/o any speculation (a SSWAG, safe SWAG) and grows over time to a mature estimate. And there is the business part which determines whether to extract based on the technically maturing SWAG. If the technical estimate is based on a methodical search through the area (i.e. pretty much linear) then the reserve growth estimate ends up looking like the classic reserve growth curve
This shape is readily modeled by Dispersive Discovery with a linear search rate.
see http://www.theoildrum.com/node/4311
The critical step is to make the connection that the business decision to extract is always proportional to how much reserve is estimated to be available. This is a first-order mapping from resource availability to resource production, that is a path to maximizing profits. Everyone understands this by its alternate name: GREED.
Then when you apply a Markov extraction rate to the reserve growth derivative, you get the shape that looks like the graph that I showed a few comments up in this sub-thread (the green curve is for a seam). Here is another one

I do not know how much more useful we can make the model by tweaking the underlying acceleration rate of search for reserve growth. We are probably looking at making the kernel function as representative as possible by comparing to a large sample of reported fields. A constant seems to work well, and the acceleration terms would give second-order effects at best.
Well it still seems we have the problem that its difficult to refine a physical rule for reserve growth. Search for new fields on the other hand has a strong model.
Applying the results of the US with its rules for reserve estimates and half the oil wells ever drilled seems wrong. Correction of the reserve estimate for overestimation happens near the end of a fields life we are actually just now entering the period when a significant number of fields are going into decline esp ones developed with advanced technologies developed since the 1980's. This same caveat applies to the North Sea. These regions don't
necessarily represent world wide extraction profiles or reserve growth potentials.
In fact the one paper I linked about Siberia was convoluted to say the least in its attempts to determine reserve growth for Russian fields. Reserve growth in the middle east is even more opaque.
Thus the validity of a reserve addition say for a field that was put into development in 1990 and extracted for 25 years is just now becoming evident.
I still don't see how you can justify reserve growth in the same manner you can justify original discovery.
As I've said in my reading in most cases reserve growth is often justified for economic or because of technical advances. Economics can change rapidly and technical advances seem to either result in faster extraction and or real increases in recovery but at a much lower production rate. Reserve growth rests on top of a complex set of assumptions that can only be proven false generally well past the date the assumptions where made.
I absolutely hate to bring up black swans but reserve growth suffers a similar problem int that any of the assumptions which underly the decision to declare reserve growth becomes false then the reserve growth assumption is false. The reason is as near as I can tell the assumptions that go into calculating reserve growth are faulty.
Now as far as why reserve growth seems to have a constant dispersion I'd say thats a direct result of the fact the underlying decision to increase the reserves is based on the expectation of BAU. If your production rate continues to remain high or declines less than expected you can safely assume reserve growth. The problem is that the time interval over which reserve estimates are increased is short vs the problem domain. Near term data is felt to be a better estimate for future results. This is not true.
In fact a perfect example where the assumptions about reserves failing spectacularly is the Texas oil bust in the 1980's. This shows that reserve estimates are fragile. In this particular case it was economics but the point is reserve estimates and in particular reserve growth are sensitive to any of the assumptions becoming false. As fields decline assumptions about recovery factors for example become important along with recovery rates.
"Now as far as why reserve growth seems to have a constant dispersion..."
The dispersion is exactly the same relative to the search speed as the global model.
This is a great example of self-similarity at different scales.
I believe the enigma really has been solved for reserve growth, I just don't have all the resources and time in the world to track and map all the data that is available.
It works for the USA clearly, as I took Attanasi & Root's original data and solved the enigma for them. This includes Texas of course. http://www.theoildrum.com/node/3287
It also works for North Sea oil which I describe here
http://mobjectivist.blogspot.com/2008/09/observation-of-shocklets-in-act...
Yes but we have good reason to believe these are the exceptions not the rule globally.
Reserve expansion in the country with half of the worlds oil wells. And in the north see one of the last major provinces developed using fairly advanced technology may not be the correct baseline. In fact they are the probably going to be the best case.
I did not see a clear distinction between reserve growth i.e backdating and initial discovery in this link
http://mobjectivist.blogspot.com/2008/09/observation-of-shocklets-in-act...
Here is the problem original discoveries have a strong physical basis for the model.
It makes sense that reserve growth is probably dispersive so the form is probably right. Reserve growth at its most basic is still a form of discovery just like finding new fields but with a much higher success rate.
This suggests that reserve additions are limited by a different constraint. And good guess is feet of wells drilled each year. This was investigated by Hubbert and others. The reason for it being a constant in both the US and North Sea is probably because of the rig count vs drilling depth is fairly constant. I.e if more rigs are used they are drilling longer or more complex wells.
This could be the basic physical underlying phenomena for reserve growth but the point is reserve growth itself does not have as firm a physical footing as does the dispersive model for original discovery.
The why question if you will still seems unanswered.
Backdating gives the scale to the ultimate reserve growth. The temporal shape is determined by the DD profile after convolution. This wouldn't work unless the DD response is bounded, which it is.
"This suggests that reserve additions are limited by a different constraint. And good guess is feet of wells drilled each year. This was investigated by Hubbert and others."
That is exactly what context I verified it against in an earlier TOD post on DD.
If it matters, I initially derived the DD model to try to figure out reserve growth an only then extended it for original discoveries. I almost put more faith in it for reserve growth because that is where my intuition took me initially.
Okay I get it. I think you have enough ammo if you will to effectively do a complete paper on original discovery and reserve growth. Esp since you manage to derive the logisitic which is known to have good empirical fit.
However given that we both agree that reserve growth is related to wells drilled then I still don't see that we know for sure that its magnitude is correct.
I have two concerns with reserver growth.
1.) Its magnitude is not correct. Estimates of reserve growth are inflated.
2.) Its correct but this oil will not be extracted at a high rate. ( Purdhoe Bay the rate of oil extraction once we reached the reserve addition is low )
Either or both issues makes it unclear that reserve growth is useful for maintaining a high rate of production. In fact in the US a lot of the reserve growth is from low volume stripper wells it adds up of course to about 2mbd but its not something that going to sustain or civilization.
And last but not least this implies that the rest of the world as it matures will have to go on a incredibly expensive drilling campaign with might have little net energy gain or even be profitable once the world peaks. Take the investment made in the US and North Sea and expand it to the rest of the world to get similar reserve growth ....
I'd love to see more data about Russia for example I've only ever seen the one paper and outside of the bogus reserve additions in the ME reserve growth seems very hard to find info on globally.
The arrival of Peak Credit will unleash swarms of unemployed quants, those applied math types whose specialty it is to create ever more devious algorithms for trading, along with ever more complex investment products designed to arouse hot greed while numbing fear.
Since those brainiacs recently established beyond doubt that they are smart enough to bankrupt whole continents, they are sure to fit in nicely with the fossil fuel business. Their special math is arranged to set aside all negative numbers during the profit phase, saving them to rush back in, like Freud's return of the repressed, when the whole scheme goes over the cliff.
Balloons inflating until they pop tell the story of biology too. Life and evolution are impossible without death and defeat waiting in the wings. Even our sun will blow up once its fuel is gone, strewing heavy atoms, ready for yet more thrilling and terrible experiments.
Peak credit does not exist credit can be extended to infinity.
The ability to repay is the question. And peak oil suggest that infinite credit
cannot overcome finite resources.
We saw today credit go to infinity peak oil says thats that simply not good enough.
We in general and I speak of the entire world can no longer repay our debts.
The question now is who runs the guillotine.
I had no idea. The quants appear to be heuristic driven wankers.
From the reference you linked to:
Quants are wankers. According to Darwin, geologists are kind of like quants. Therefore geologists are wankers. No wonder why geologists never made any progress in understanding the dynamics of oil depletion.
Thanks, that is such a great reference you dug up!
New Scientist has a brief look at where the quants went wrong The blunders that led to the banking crisis
This illustrates a feature of out civilisation. We have been extremely successful in applying technology where the math is "well behaved", i.e. linear or amenable to statistical analysis. As memmel notes, when the math gets into chaotic behaviour, we are pretty much lost. e.g. in long range weather forecasting. It seems the quants exploited the juicy linear part and ignored the spiky chaotic crust.
memmel also raises an intersting point, if civilisations are described by complex maths, then we don't have the tools to "solve" the problems civilisations have. We would have to learn by trial and error.
My response to how to "fix" the credit crunch is that it's a chaotic system, and we don't know how to fix them.
The life-cycle of oil is relatively uncomplicated. A barrel sits in the ground, gets discovered, extracted, and used essentially in one shot. On the other hand, finances get recycled endlessly and it has a leveraged component, so all the changing hands will add perturbations that can cause all sorts of swings.
Oil also has a speculative component, but that component lives in the finances universe loop and has no bearing except perhaps on reserve estimates, which tells us how many rigs to build.
I'm starting to question what is a worse problem: is it unbridled capitalism or is it constrained resources?
I don't see an alternative to constrained resources, that's an immutable fact. So the question is what is the appropriate system to optimise use of resources, for whatever criteria of optimisation people wish to apply, e.g. number of people, quality of lifestyle, longevity of civilisation etc.
We have seen how mostly unbridled capitalism behaves in times of plenty. It has not really been tested in times of constraint. In theory, the free market should be an efficient allocator of scarce resources. As we reach the limits of growth, will the free market enable management of a low growth or stagnant economy, without the system collapsing?
Even then, I would worry about redundancy. A system which is operating at maximum efficient usually has no superfluous inputs, making it vulnerable to failure.
Yes I think you nailed it. The so-called "quants" will finally have to adjust their "algorithms" for operating within a constrained, diminishing return style environment. This might just make the system stable against perturbation. It is what every controls engineer needs to make his flight-control algorithms stable -- a little bit of negative feedback ... not all this positive feedback stuff that results in the financial mess we have today.
The end result could drive it to failure, but more likely to a stable low-level running a little bit above the failure level.
"Impossible" is a strong word. You should pick up a copy of Taleb's Black Swan just to make sure you have a rudimentary understanding of the concept.
Here's a simple production model right here:
http://www.aspo-usa.com/index.php?option=com_content&task=view&id=415&It...
Regarding "get a prediction like this" - I don't see any prediction. Maybe you could point that out. (That would require actually reading the article.)
Regarding the rest of your comment - once again I have no idea what you are talking about. If you want to know what I'm talking about, try rereading my original comment and paying attention to the comment I was responding to.
http://www.aspo-usa.com/index.php?option=com_content&task=view&id=415&It...
My concerns is where is the floor not the ceiling. As far as black swans you need not even include those types of events to be pretty concerned about where the floor could be.
Now whats the worst case scenario i.e how bad can a black swan event be even if its unpredictable well thats pretty easy to answer the worst case is oil production goes to zero.
Can we think of and event that could cause this ?
A meteor strike for example. But wait a minute black swans are this mysterious event that people love to talk about. Yet we need not invoke black swans to get the worst possible outcome. We can consider events that have a known probability and achieve the same effect.
So what are these mysterious black swans are they improbable are the simply events we did not think to assign a probability too ? And even if we did not do we have enough probable events to cover all possible outcomes ?
How important is our understanding anyway does it matter ?
Is a black swan worse than something we know about but made a incorrect probability judgment on for example technical advances in extraction ?
Do you even really understand what a black swan event is and why it matters and does not matter ?
At least I've though about it. And black swans and wild goose chases have a lot in common and are and example of incredibly flawed logic.
One of the book reviews I read considered Google a black swan even though almost every single mature industry is controlled by a small number of key companies. Identifying the yahoo's, and googles of the search world has nothing what so ever with recognizing that only a few companies would win in a market that supported concentration.
Can we make mistakes on our weightings ?
Have you even read what I wrote. My whole point is we cannot effectively weight or even a priori discern all the events that will impact oil production as it begins to decline.
By definition blacks swans don't exist because I just said they do. It does not matter because the vast majority of potential events from the most highly probable such as export land to the least probable such as a meteor strike are negative. Even positive improbable events such as finding another Ghawar in Texas don't change the results all that much.
Its a simple exercise in counting in one column put all possible events that reduce oil supply below the geologic maximum. In the other put all events which could alter the outcome in a good way. Finding a Ghawar, cold fusion etc etc. Unknown event 1, Unknown event 2 etc.
Add up the two columns and make them equal by adding unknown events then try and eliminate the unknowns by adding more knowns. Well bad events are pretty dang easy to come up with. It turns out that on the good side you have a lot of unknowns that cannot be replaced.
Now do the same thing for before oil peaked back say starting back in the 1900's and we had plenty of supposed black swans all the way up except its quite different since we have this beautiful huge positive. We have not explored the entire world for most of this time period buckets of oil could be anywhere and as we searched we just kept finding more. The weightings are entirely different on the way up with the bad side full of unknowns to balance out and with plenty of known positives.
WHT work shows that one of the biggest positives on the way up is now negative its moved to the bad stuff column. Others such is technical advances in extraction are approaching fundamental physical limits and the law of diminishing returns. You can go on for ever.
Damn near everything is negative.
So it turns out we can readily look at problems and add as many unknowns as we wish as I said calling them black swans is a logical fallacy.
We can even get all the weights wrong and screw up our probabilities does not matter the final result is the same the highest probability is that we will pump less oil than is predicted by analysing production. Next in the probability level is we probably will pump less oil then predicted by simple models based on discovery or suggested by empirical methods such as HL.
On the other side we probably will pump more then zero. Where we actually end up has to do with how well we weight the events including the unknowns or unknowables. No reason you can't assign a probability to and unknown event.
And finally although the real answer or future is unknown for complex system in collapse by definition it obvious that the most probable outcome will be bad.
You don't need any other solution in order to make a decision since at the end of the day the only reason studying peak oil by various methods is important is it points out that we need to make a decision and the more complex we make the problem the more obvious it becomes that left unattended or taking the no decision route will probably lead to a fairly dire outcome.
Interesting. So an unbiased prediction would guess that the number of black-colored white swans would completely balance the number of white-colored black swans. Basically, we have no idea which way the balance will tip -- equally likely to go negative as positive on us.
All that the dispersive discovery does is predict the estimated mean outcome by using all the a priori knowledge based on the points on the cumulative discovery curve up to the present. Since it is a mean, all the positive and negative effects compensate out. You can see this if you transform the Dispersive Discovery stochastic algorithm into a Monte Carlo simulation, as in here:
http://www.theoildrum.com/node/3287
You see the "Black Swan" at around year 210? That basically makes no difference in the overall shape, as Memmel indicated. You would need instead some astronomically large find, but in that case we could also encounter an astronomically large asteroid.
At least you've thought about it? Huh?
My reference to the Black Swan pertained to your use of the word "impossible." All the white swans in the world don't prove the non-existence of a black swan. But it only takes one black swan to prove wrong the theory that there are no black swans. This is also why I showed you Dave Cohen's piece.
Since you haven't read the book, your questioning my knowledge of the subject, "thinking about it," and your pontificating on these matters make little sense.
But I'm glad I've at least given you another angle from which you can view these models.
I don't have a problem with WHT's model, I was simply responding to what davebygolly said. I don't see that this model does any better or worse job describing peak oil than any other method or model currently employed. But it is much more complicated. And that is a negative. Because ultimately the goal is to get the 99.9999% of people in the world who don't devote their lives to peak oil to understand the concept. And in this regard it fails.
But that is the crux. There is no other model based on first principles out there that we can use. First of all, let us not count bottom-up analysis since this isn't truly a model but more of a "bean-counting" exercise (not to disparage beans and those who count them).
Then what you have left is curve-fitting and whether the curve is fit as a heuristic or as a first-principle (FP) model. Let us go through the list
1. The Logistic and Hubbert Linearization: Heuristics, but not a FP model, used to curve fit to deduce URR.
2. Export Land Model: A zero-sum game model. It doesn't actually derive from anything but it tries to extrapolate based on evidentiary information. At best it uses "second-principles" not "first-principles".
3. Loglets, GBM : Curve fitting extensions of logistic-style assumptions. Since no one ever derived the Logistic then these don't really count as FP models either.
4. Log-normal field size distributions: Heuristics, no way to calculate URR
5. A hand-sketch showing a bell-curve-type shape: Are you kidding me?
So then what you have left is the Dispersive Discovery and the Oil Shock Model for production. Since you can derive these from physical processes and simple data-flow arguments, these are actually the pretty rare intuitive models.
But the Dispersive Discovery model explains the Logistic curve! I don't think you really understand what this means. It's kind of like saying that we have Ohm's law for solving resistive circuits (very simple) but then you dismiss an electron scattering model because it is too complicated. Yet electron scattering generates the basis for the first-principles derivation of Ohm's Law. And you then say that "99.9999% of people in the world who don't devote their lives to peak oil to understand the concept".
Can you imagine what kind of idiots we'd be if we were still walking around using Ohm's law to drive the electronics world, yet we still didn't know what caused it? We'd think that Pink Fairies made it up or, worse, it was the result of Intelligent Design.
OK let's not go that far. Right now, there are 6,600,000,000 people in the world. I imagine some fraction of EE's and Physicists know how Ohm's law is derived. So according to you, 100% - 99.9999% = 0.0001% of the people likely understand how to derive Ohm's law from pencil and paper. Which means that we have 6600 Electrical Engineers walking around who understand the first principles derivation. And then they are able to put this knowledge to use to come up with new materials and processes to optimize circuit designs. That is really all that matters because they are the ones that can produce the million+ gate chips that drive the computer industry, or try to transport electrons from point A to point B w/o wasting energy.
As for the rest of the people who didn't get science degrees or can't lift a finger? For the moment, who the ____ cares. I don't know about you, but I kind of want to figure this sh*t out as we collectively swirl down the drain.
I agree and I would like to figure these things out as well, or at least attempt to. My own view is that the production (and also to a large extent the discovery) curve is hugely effected by above ground/human factors. We've been running out of oil since the day we started using it, we are going to need to make other plans (as some notables in the community like to say). I like to try to make this point, however, independent of constantly bad predictions.
A few years ago with a decent amount of knowledge on the subject I was of the opinion that production could probably in the best case scenario go much higher (95 or 100 mbpd). But various factors would hold that down to maybe 90 mbpd tops (or even the current 86-87). The resulting effect would be a longer plateau and transition (to other fuels and lower consumption). This would further push a sustainable plateau out and/or dampen the effects of the downside of the curve for a few years.
A few years later (now) after a considerable amount of work on the subject and having played with a few models and made one of my own, I find I have the same view.
If we look at actual numbers, we can see that overall productiuon in 2008 will most likely be statistically equivalent to 2005 and that there is little reason to believe that in the next 2-3 years production will fall for geological reasons the way Deffeyes, Simmons, and others are predicting.
The new oil coming on line should offset the declines in countries that have already peaked for the time being. HL and other methods may say otherwise, but when you take a detailed unbiased look at the individual production profiles and what is actually happening out there, you might come away with different thoughts. That's all I'm saying.
Those are other non-conventional forms of oil that are making up the difference. That does not constitute an "unbiased look". We should really watch the conventional and see how it agrees with the model. That is the closest thing we have to a controlled experiment.
Yeah, that was a poor choice of a word. I didn't mean to insinuate that you or anybody else who does this takes a "biased" view.
My use of the higher 85 number rather than the lower 74 number was merely a matter of convention. Many readers even here have difficulty with that since the "conventional" number is 85. I use the two interchangably since I understand the difference.
What I like about your model, is the dispersion thing and the fact that you differentiate types of oil. I need to look at that more carefully. I think it's hard to represent mathetically because the available data is maybe not as good as we would like. What are your feelings?
The conventional thing is also tricky. What do you mean by that? And where do you draw the line? C, C+C? Offshore, deep-water, tar sands, etc.
We have to decide on how to discriminate the types.
I like the rather depressing analogy of driving Passenger Pigeons and Carolina Parakeets to extinction. These are of course separate species but the attitude that "birds are birds" probably obscured the fact that these went under with the blink of an eye. If in fact you overlayed the declining pigeon population with the somewhat later parakeet population, you may have been fooled as to the real extinction rate without the distinction of the species.
It has a nice ring to it, I coin this effect "Extinction without Distinction". I trademark that phrase hear and now.
One important parameter to characterize mosfet transistors which are used as switches in most digital circuits are by on resistans (ohms law) another is the capacitances between gate and the other pins. It is possible to use ohms law with complex numbers to calculate the impendance (complex resistance) of capacitors and inductors this could be used for for example to calculate the maximum switching frequency for the mosfet.
I do not know or understand all details of why ohms law work it's just a good model.
Right.
So the Logistic is like Ohm's law, a good empirical model.
Dispersive Discovery and the Oil Shock model is the Maxwell's equation and scattering and conservation of flow that leads to Kirchoff's law for solving dynamic circuits.
What do you want: Ohm's law or Ohm's law plus Kirchoff ?
Just wanted to say that ohms law is still good at least then designing circuits. Ohms law is a lot better than the logistics what I really want is a better model or something that could explain the model. I have read your post and it's the first time I have seen something that could explain the shape of the logistics.
Theory that there are no black swans ?
I'd say its and observation at best. Given that genetically a bird can take on a almost endless array of colors you would have to show that swans don't have the genetic capability to have a certain coloration.
The whole black swan concept is garbage and it has zero utility.
Why would I read the book when its premise is simply utter stupidity. Horoscopes provide better entertainment at the same trivial logic level.
Statements or conjectures that require a complete enumeration to determine their validity are of little logical interest.
http://en.wikipedia.org/wiki/Falsifiability
The stupidity extends into peak oil. A new oil field is discovered therefore peak oil is false.
What? Huh? What are you talking about? I constantly feel like you are responding to someone or something else.
If you don't want to read a book because you think what it contains is stupid before reading it, then don't read it.
I haven't said anything about peak oil and black swans.AGAIN. My point was that what you say is impossible deserves at least a second look. Please stop conflating things.
You could at least read the essay by Taleb posted towards the bottom of today's Drumbeat. But maybe that is beneath you or too "stupid."
I read the post as well as Taleb's Edge article. Both very provocative reading.
I would suggest that what Taleb has to say applies just as much to the oil cornucopians out there, who live in Taleb's Quadrant 4, as to oil depletion pragmatists who argue over whether the lognormal size distribution can ever produce a gigantic find. Otherwise the pragmatists, me included, work very hard to avoid Quadrant 4.
I think the cornucopians may have hijacked some of the Taleb concepts and used it to frame their own agenda. Furthermore they may be projecting on the pragmatists, the idea that they are the ones that are ignoring the Black Swan event. It's actually the cornuciopians, IMO, that need to worry.
Otherwise, Taleb is good stuff, and I think we have been getting lots of knee-jerk reactions to people that have been putting spin on it, and that we have had to counter it w/o reading the book. I believe some of this also came out of the anti-peak oil screed of Freakonomics. People have gotten touchy based on Levitt's bad analysis.
The problem with Taleb is he focuses on the actual events which precipitate a disaster.
Not the fact that this system as reached to point that its structurally unsound so some event will take it down.
Next his focus is on financial systems which are generally ponzi schemes that always collapse.
I think he understands the problem and the complexity issue but by focusing on the actual events which precipitate a crisis he is missing the big picture the way he writes. However he actually suggest the right cure which is to make a system resilient to shock.
A excellent example outside the realm of finance is Just In Time practices. Although these have a large financial aspect because suppliers are forced to book storage while the retailer shows a low inventory and higher profit. Issues readily throw these systems off track on a routine basis.
The point is this system is obviously not safe agianst problems its sensitive to events black swans or not.
You can look into the past at different societies and events. Take the middle ages and the black plague. If we had a similar event today it would destroy our society but they managed to live through it surprisingly well.
http://en.wikipedia.org/wiki/Black_Death
Its hard to consider what would happen in our modern society with similar mortality.
But this is not a black swan problem its a structural problem. Taleb at least has the right answer despite the sensationalist presentation. One way to show that the focus on events is wrong is that in most cases a simple slow decline i.e peak oil is enough to precipitate the crisis and event is not needed. Another example is the housing bubble or bubbles in general which collapse without any identifiable cause.
"Ponzi schemes"
I am amused by how high Taleb's horse is. He sits on his high-horse and he states the obvious facts that every controls engineer eats for breakfast, and thinks it is somehow revelatory.
1. Controls engineers know that applying negative feedback has the effect of damping perturbations.
2. Our finances work on positive feedback (i.e. leveraging)
3. Trying to control an airplane's rudders with Wall Street's flight control system would send it plummeting to the ground within minutes of take-off.
The only reason that it didn't crash until now is that they had the minions of green-shirted marionette players on the ground pulling the strings on the Ponzi scheme ailerons until the thing spun out of control from all the uncompensated positive feedback.
Take that back, there was compensation in the system! It just all went into the fat-cat's wallets :)
LOL
Even as a software engineer the lack of control in the financial world is amazing.
You can take a engineer from practically any field or domain of study and teach him what they do in the financial world and I'm pretty sure he would run in horror.
I've been looking at it for a while now and its not clear to me how it even works in the best of times much less stressed. No wonder even with cheap oil we had continuous financial blow ups.
That was something that used to bother me but once I learned how the financial world worked or more correctly never worked I realized it was intrinsically unstable regardless of how favorable the economic inputs are.
The underlying problem seems to be that the biggest winner is the guy that figures out how to exploit the system to blow the biggest bubble. This is in turn caused by the availability of infinite credit.
The prediction is right there. The Dispersive Discovery model is a predictive model that will probabilistically estimate finding a discovery starting from Time=0 and continuing to Time=infinity.
Since we haven't reached infinity yet, we can make predictions based on what we read off of the curve, or from the equation.
This part of the model is really pretty simple, and is so obvious that I often forget to reinforce this idea.
That is basically what Memmel is referring to.
I am glad you mentioned this criticism of what is "important" and what is "useless".
As an aside to the derivation, I tried applying it to the problem of network dispersion. To some people, this is a critical area as it can cause random statistical latencies in throughput of data on computer networks.
http://mobjectivist.blogspot.com/2008/09/network-dispersion.html
What is interesting is that I specifically applied it to a tutorial designed to help people understand how to ping hosts and measure LAN/WAN performance. (FWIW, this was from the people at SLAC, who rely on fast networks for data gathering)
http://www.slac.stanford.edu/comp/net/wan-mon/error.html
The SLAC people used heuristics to explain their data:
I used a model:

Do you think they would appreciate that their statistical latency is explained by a case of rate dispersion? I would think so. I assume other people dealing with networks (like half the people that use the internet) would also like to know what causes random delays or at least how to characterize this properly.
I really don't understand how that the network latency model might be considered important, but that the exact same math when applied to oil discovery is not, or is deemed overkill. Sometimes I think that living in the land of empty rhetoric and using a "simple graph" to explain oil depletion would be SO much easier. After all, hand-waving doesn't take a lot of skill, and it exercises your arms at the same time.
BTW, if someone has seen this specific model applied to network dispersion and published somewhere, I would be interested to know about it. I have a feeling that someone has applied this already, but you never know, and this side investigation might be worth a paper on its own. The particle physicists at SLAC certainly don't understand their own data, that's for certain.
MRoMI -- I don't even know what this means. I tried googling it, nothing. Does it mean Memory Returned on Memory Invested? Something to that effect?
I'd prefer to say "latency is well-modeled, and possibly explained, by". Modeling something well, even if the derivation is actually wrong but leads to a good approximation, is at least as important as coming up with an explanation (which are often wrong).
[I haven't had time to look at the maths in the main post in any detail yet.]
Hi Thinkers et al,
One intellectual outperforms ten mathematicians for what is coming down the tubes.
Graham
And I presume that one intellectual is Sarah Palin?
Hi webhubbletelescope,
(I am not an American, so cannot have a valid opinion)However, Poor old McCain is about as smart as a horse. Dear old Sarah is a bit smarter than a horse but no more than a Hockey Mom, not requiring great intellect.
Graham
When you can derive something from first principles, it tends to validate the entire model. For network latency, the first principle is to consider the data as network packets moving down the wire at a threshold rate governed by the speed of light and the computational overhead rate. If you add dispersion to the velocity such that the mean dispersion rate is equal to the standard deviation of the spread in dispersion, you have a maximum entropy estimate of the "noise" in the dispersion. The key is that the dispersion cannot add a negative velocity, and that makes the damped exponential PDF the most conservative estimator from an information theory perspective.
What else is there to consider in its explanation? This derivation is on a par with anything that you will find in a statistical mechanics textbook describing the ensemble behavior of a group of particles.
What I like about the model from the perspective of oil depletion analysis, is that it supports a more encompassing view that includes the Oil Shock model. Until the entire premise starts breaking down, we can continue to ride the model to explain the majority of things that need explaining. I know that people in general hate the idea of being able to explain ensemble behavior, but statistical mechanics and information theoreticians have long since crossed this barrier to knowledge.
Propeller Beanie Hat Time (PBHT):
A minor refinement; light in fibre optic cables does not travel at the speed of light, or c. It travels at approximately 90% c. That's how the propagation works with the difference in index of refraction between the core and cladding. In the relatively short distances of say - a continent - the time differential isn't substantial.
Using ping as a simple model has a few analogues. One has to keep in mind the IP stack and how ICMP (Internet Control Message Protocol) is handled in network traffic. In common network structures, core switches treat ping packets with a lower priority when traffic gets heavy. This is similar to the person and bureaucracies in addressing innocuous bits of annoying data at times as well.
Some hosts are set up not to respond to pings. The similarities in every day life are too numerous to count. And, the path to the host may not be the same as the return (but not often).
Therefore, using the ping statistical model, it could in simplistic terms serve as a model for understanding how information moves through a complex interconnected system. So why hasn't the message of Peak Oil got through to many more people? Simple, they haven't been upgraded to the latest network interface driver! (Boy that is such a corny engineering joke I could pop it and put on butter).
This is a good analysis, as it points out that there probably isn't a "preferred" latency in a random network and the statistical mode is the maximum propagation -- zero collisons. All the other perturbations cause the velocity profile to fall off from this max.
Yup.
I do have something else to contribute to the discussion between yourself and Memmel, but it will seem "way out there". However, Memmel got awfully close when he stated (paraphrase) "... the complexity seems to signal an event."
Sometimes, in this ongoing analysis the points seem to get close to the topic, but not quite. No, it doesn't involve God, or a sermon, but it does open the scientific discussion to a new paradigm. Over the past few years I've seen scientific understanding marching towards this end. There are physics departments that have included it in their department name.
The mere fact of this online discussion is part of the proof.
I'm guessing here.
The "Synchronization of Chaos" department?
Or is it "The Department of the Singularity"?
Or Memmel's reference to Wolfram: "The Physics Department is a Computer"
LOL.
All I can say is it seems like there really is something there in complex systems.
Computations happen. Even in the simple case of oil discovery. A single oil discovery in a region initiates more scrutiny and further discoveries. Thus the exisitance of a single oil well has a sort of force associated with it this is what I'm calling a higher order physics computation or whatever you want to call it. Its very akin to phonons and holes fictitious particles used in physics. In complex systems these higher order physical like variables come into play. And they form a sort of computation. In the case of oil discovery the results if you will seem to be described by a simple equation.
Obviously we are a complex system and we are capable of computations. The question becomes at what level of complexity does computation stop ?
It seems that all that is needed is for a system to be sufficiently complex such that it can generate some internal state variables and a energy like concept and it can then have its own virtual physics.
With plate tectonics we even know that the rocks perform their own private dance over the eons. Past continents influence the future direction etc. In general these computations if you will are not all that interesting but that does not mean they don't exist. The earth is busily computing if you will via plate tectonics when it will form the next super continent.
A star is busy consuming hydrogen and computing when its going to explode etc.
We can successfully simulate a lot of this with fairly simple equations. It turns out that in many cases these highly complex systems are doing something we can readily do in math with a pen and paper. However sometimes generally when the underlying physical variables are changing in such a way that the previous computation is no longer tenable the systems change in complex ways to start a new computation.
Thus these internal computations seem to have concepts like phase changes. Fluid dynamics and signal processing both seem to be areas where we seem to be close if you will to this concept.
Although humans are heavily involved in oil production the decline in discovery has sent out a signal in and of itself throughout the world since the 1970's its a real force and its been in effect for some time. So the higher order forces of peak oil have actually been exerted for some time starting from when it was obvious that discovery had probably peaked and pounded home with peak production in the US.
These higher order or internal forces if you will in my opinion become dominate as global production declines the system literally begins to search for a new problem to solve. The fact that humans are involved is probably irrelevant. For example the US can print all the dollars it wishes like Zimbabwe and its not going to make more oil any more then Zimbabwe's millions makes more food appear in the country. The oil economy will undergo a transformation and this transformation will probably also have the biggest impact on future production greater then the underlying geological depletion and previous peak discovery which initiated the change.
Again you can look to higher level ideologies such as the American Dream which have resulted in a ravaged and polluted planet to see how these virtual forces can have horrific real physical effects.
The evolution of our society down peak is opaque primarily because we tend to ignore the truths of our systems and their blaring weaknesses. As they become more obvious we work ever harder it seems to paper over the gaping cracks via misinformation and outright lies. This makes the real physical situation even harder to discern. And it happens right when we need transparency and hard physical data the most to gauge how our complex system is changing and work to lessen the worst effects. I think this coverup is a actual force in complex systems its intrinsic if you will. Its even present in simpler animals that use ruses and physical displays to project a lie. It exists all the way down to simple viruses. Thus lying if you will seems to be a sort of higher level truth or force in complex systems.
Its a shame that we are just now it seems starting to really look at these right when we have a terminally ill complex system that provides for our own existence. If we had more knowledge on this subject down to the point that it was taught in High Schools I suspect we would have decided to develop a renewable society instead of the travesty we have now.
This entire field of knowledge seems to be practically missing from mainstream western thought with at best a fringe environmental groups barely raising up the concept. They tend to ignore things like driving the SUV to a save the whales rally. These partial attempts to understand complex systems have probably done more harm than good. Its pretty clear that the tough environmental laws in the US have resulted in even more pollution in china for example. Since people where unable or unwilling to address the real problem of consumption.
Sorry for jumping around but complex systems seem to have their own reusable concepts sort of like scaling laws so you can look at all kinds of complex systems and you seem to be able to extract laws rules forces etc. This common theme seen on inspection points to a underlying mathematics thats at work but one we have yet to fully explore or define. For me at least the biggest stumbling block as these rules if you will use some really wacked variables or coordinate systems. I mean what the heck of the units on the force of one oil well "calling" in more exploration ergos ?? How the heck would you measure it ?
Do I go out somewhere in the middle of Canada and claim some huge discovery and measure the rate at which other drill rigs show up ?
In any case the reality of this force can be seen in stampedes in crowds for example. Or the power of rumors. Even though I'm unable to even figure out the units much less measure it.
I have long since used an 80:20 rule when encountering posts like these. (actually more a 95:5 rule in practice).
If I find a long and detailed post which is to me on first reading almost total gibberish I find in practice one of two causes.
1. The poster is a lot more intelligent than me.
2. The poster thinks they are a lot more intelligent than they are.
Needless to say that 80:20 rule is biased to the latter whereas my guess is that this post is among the former.
The only comment I can add is a question or two-
How confident can you be that this sort of modeling is valid in the physical reality that oil field prospecting?
Can you put in terms the merely human can understand, does this modeling result in any real world predictions about the future of the world's oil supply?
Point taken. The reason to do this kind of thing here, is that anybody that wants to can challenge the premise or the math. I will try to defend what I presented against all comers. This is open peer review, and if we can't find any math peers amongst the readership the ideas probably won't advance too far. The fear is that somebody will hesitate to invest any additional time in understanding the premise at the risk of wasting their time if they ultimately find the model rubbish.
As to another point, if anybody thinks that this math is hard, they haven't seen anything yet. As a case in point, Khebab and I have been studying an interesting paper on oil depletion by B. Michel. In his analysis, Michel brings out a formal mathematical framework:
http://www.math.u-psud.fr/%7Emichel/Article_Modele_Hubbert_VersionMGTemp...
Some of the formal math is over my head, yet I gave a crack at analyzing it here:
http://mobjectivist.blogspot.com/2008/09/observation-of-shocklets-in-act...
We indeed need a pecking order to figure this stuff out. There is a huge divide between formal math and pragmatic math, and this post tries to bridge the gap. Not everything is simple bean counting and arithmetic and so everything we can do to make the math more digestible and the premises more solid is welcome.
Well done, WHT, another journeyman effort.
I'm wondering, how does your analysis compare with these by Hubbert?


Can your model produce similar graphs? Or am I mistaken as to its scope? I'm just curious what all three curves, discovery, production, and reserves would look like under your analysis.
Cheers,
Jerry
The Dispersive Discovery model predicts the shape of the discovery curve.
The Oil Shock model takes the DD curve as input and generates the production curve.
The reserve curve is simply the difference between the cumulative discovery and cumulative production.
see http://www.theoildrum.com/node/3287 for a description of how the two models work together. This figure is typical of applying Oil Shock on DD. The reason for the jagged production curve is the application of aperiodic "shocks" to the system.
This data from Laherrere shows the production curve crossing the discovery curve in 1980.

How do you account for the 10 year discrepancy between the observed data and your model?
Cheers,
Jerry
That is very easy to explain. The Laherrere discovery data is an interpolated curve of the actual data. My discovery profile is based on the DD model. The latter's shape does not feature dips and spikes due to statistical fluctuations.
I'm certainly no expert, but I don't find that very convincing. Ten years strikes me as more than a "fluctuation" and any model should at least attempt to fit observed data. How else do you validate it?
Cheers,
Jerry
Jerry, I would guess that there are two features to consider. The Dispersive Discovery fits the real-world data basically on the way up the curve. I think that the decline has a higher bias than the data because it implicitly takes care of reserve growth. Look at the overlay and we can see how DD provides a cushion for backdating of discoveries. Backdating undervaluations are worse for recent years and get better for older dates.

Getting back to fluctuations, if we did have a data dip causing a 10 year gap it wouldn't really influence the outcome too much. The Oil Shock model is a low-pass filter that will remove all the fluctuations in the "real" discovery data. (more of that signal processing that I referred to at the top of the post)
I suppose it is the one chart that I don't have handy, but I can guarantee that fluctuations in discovery on that scale have absolutely no effect on production. I already posted this image upthread:

If you look at the smooth curve and the jagged noisy curve, and then imagine what the production model would look like for each of these, how would they differ once the Oil Shock model is applied? Answer: Not much at all.
Such is the nature of an ensemble of independent processes statistically averaging out a noisy input stimulus.
In any case, thanks for asking this question, as it will probably come up again. I will generate some side-by-side comparisons for the next time.