Ghawar Numerology: Drilling in Uthmaniyah
Posted by JoulesBurn on March 31, 2008 - 10:00am
 NOW SHOWING: a movie on the drilling of Uthmaniyah. Using a set of wells in a productive (but now rather depleted) slice of this part of the Saudi oil field of Ghawar, it is possible to deduce to drilling sequence of these wells using the identifiers assigned to the wells as they are drilled. Given a few known dates for well placement, a timeline for overall development can be constructed and displayed as an animation. Enjoy the movie.
 Uthmaniyah is both by area and by production the largest operational segment of Ghawar. The more productive northern part of Uthmaniyah was also the first part developed, is the most depleted, and has also been extensively studied. In fact, this analysis is only made possible by selected publications of Dr. Shiv Dasgupta, Microseismic Project Manager for Saudi Aramco. But rather than bore you up front with further details of how this short clip was put together, I'll first just present the video. Green dots mark the individual wells as they are drilled. (Click the play button on the player below)
For information on the music for the above video, go here.
(if the above movie doesn't work, try going here)
The Making of the Movie
Until the early 1990s, all wells (oil, water injectors, gas, etc.) in Saudi Arabia were assigned a numerical ID with the same sequence of numbers for a given field or area. The Ghawar areas are all numbered independently, such that the discovery well in Uthmaniyah is UTMN-1 and the tenth well in 'Ain Dar is ANDR-10, etc. Under this assumption, a map showing both the locations and IDs of the various wells also gives the drilling sequence. Furthermore, if the drilling of a given well (by ID) can be independently attributed to a specific date, the drilling sequence can be anchored at that date. For example, the first well was placed in Uthmaniyah in around 1951 -- thus providing the lower anchor for the sequence. Of course, this depends on the wells used being representative of the entire Uthmaniyah area. Fortunately, this appears to be true in this case. I will discuss below the sources of information and the assumptions made when assigning dates for the various wells.
The sequencing of wells to create the animation was done using Google Earth. First, the well layout map was added as an image overlay and adjusted to match the actual well locations. Second, placemarks with corresponding well IDs were labeled as such, and these were ordered numerically. Time information is added for each well by editing an exported KML file and adding TIMESPAN tags. Wells with IDs between those of anchor dates were spread out uniformly in time. After reloading the modified KML file, animation controls appear in Google Earth. A screen grabber program was used to record the animation.
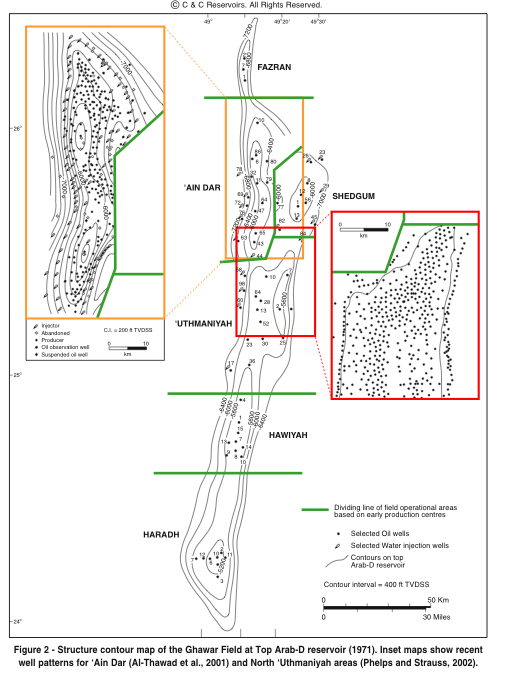
The wells used in this analysis come from Figure 4 in the Dasgupta paper "When 4-D seismic is not applicable: Alternative monitoring scenarios for the Arab-D reservoir in the Ghawar Field" (link: Geophysical Prospecting, 2005,53,215-227). This slice contains the first few oil wells drilled in Uthmaniyah as well as the first few non-associated gas wells placed in Ghawar beginning in 1983. This same study area is also shown in Figure 3 of another Dasgupta paper, "Reservoir Monitoring with Permanent Borehole Sensors" (link: SEG Technical Program Expanded Abstracts -- 2004). This figure is shown below:

The well IDs on this figure are a bit harder to read, but it also shows oil thickness contours for the area. These will be discussed later in the analysis. The exact date corresponding to the well inventory used for these sources is not known, but it is likely before 2004. Note that the latter figure has a few more recent wells. Wells drilled subsequent to this set are identified for the satellite imagery as presented in Drilling Ghawar in the 21st Century.
Drilling In The Years
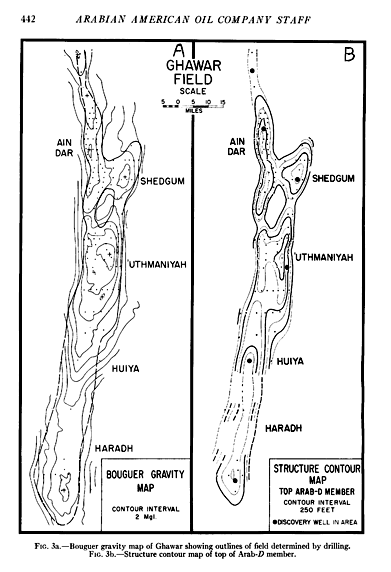
I will cover the various phases of well drilling in Uthmaniyah and discuss the various evidence which relates the well sequence to when the wells were actually put in place. Aside from the date of the discovery well, the first clues are found in a Arabian-American Map dating to 1959. This shows the pattern for the delineation wells covering the field. This set of wells on this map is likely incomplete, but we can use it to identify wells that were present at that time. Shown below are the wells locations identified using Google Earth that are present on the 1959 map and their IDs as determined from the above well maps.
 |  Uthmaniyah wells present in 1959 Arabian-American map (left) and in Dasgupta study area showing Arab-D reservoir contours (above). Note the location of the first well on the far east flank. Wells 10, 21, 26, and 36 were identified from other sources. |
From the above we can conclude that at least 46 wells were drilled by 1959. Next, we have an Industry Map dating to 1971. This map is probably even less conplete, but it does help identify a few more wells from the 1959 set. Furthermore, water injection was initiated in Uthmaniyah in the late 1960s, first with gravity wells and then with pressure injectors in the early 70s. The field pressure profile is shown below.
 Arab-D reservoir pressure in Uthmaniyah. Data from Benkendorfer et. al., "Integrated Reservoir Modelling of a Major Arabian Carbonate Reservoir" (SPE 29869)
It is probably sufficient to assume that the peripheral wells shown below were probably put in around 1970 +/- 3 years or so.

Got Gas?
In 1983, deep wells were first drilled into the Khuff-C formation deep beneath the Arab-D. A paper by Shiv Dasgupta (who else?) and friends, Reservoir characterization of Permian Khuff-C carbonate in the supergiant Ghawar Field of Saudi Arabia (link: The Leading Edge, Volume 20, Issue 7, pp. 706-717, July 2001), has a map showing several wells for this early phase of non-associated gas development as well as a more recent phase. The wells are not identified, but all were found to correspond to existing wells as per Google Earth and several corresponded with those assigned IDs as per the other Dasgupta papers. These are shown in the figure below as yellow placemarks.

Three other wells correlated with their IDs have numerical values of 1807-1809, and I believed that this represents a distinct ID grouping (starting at 1800) for these later wells.
From here on, things get much less clear. Oil production and drilling were both curtailed in the mid 1980s due to low prices, but activity started ramping up in the late 1980s and especially in 1991 following the Gulf War. The study area well IDs values seem to extend through the 600s, but then no wells are found with values from 700-999. The evidence, sparce as it is, suggests that these ID values were skipped and numbering was restarted at 1000 for the big ramp up in 1991.
Getting Squeezed
Let's now revisit the second Dasgupta paper from above and the oil column thickness represented in Figure 3 of that work. Shown below are all of the identified wells superimposed on a recreation of this data as a Google Earth vector overlay. The green area represents the thickest remaining oil layer (over 120 feet), but note that this does not represent a complete oil layer either. The concentration of wells therein is clear.

Using the well IDs and rough time frames for even more recent wells, we can step through the next few development stages. Shown below are wells with IDs in the 1000-1199 range.

These wells are seemingly placed in front of the advancing water flood at an earlier date. As we move into the 1400 series, the wells are placed increasingly to the east.

In the final phase (1500+), wells are almost exclusively located in the thicker oil region but are rather uniformly distributed therein:

Eleven of these wells (with IDs in the range 1500-1539) are part of this latter set, with the remaining having been put in since 2004. This delineation marks the final anchor point for the video.
One remaining question is, what of the other wells? As of yet, I haven't found any mention of wells in the 1300 series, although a large number of wells in the 1200 series, feeding into the bottom two Gas Oil Separation Plants (GOSPs) for Uthmaniyah, apparently exist. And although a number of wells in the 1400 series are in the Dasgupta study area, some wells in this same series also reportedly feed into the bottom GOSPs as well. Thus, well classification is seemingly not location-specific. Any additional information which would help clarify the ID classifications for these later wells would be welcomed.
A Visual Connection: UTMN-1093
One of the wells identified in the study area, UTMN-1093, shows up online in a photograph taken by either a Saudi Aramco employee of one of its contractors. The location in the study area is shown below:

Shown below is a crop from this photo (unknown date, but likely after the digital camera age) and a picture from above using Google Earth. Besides the color difference, one thing of note is that the boundary around the site prepared for the well consists of a large berm of sand. This probably represents a rework of this well, possibly in 2007 (after the satellite photo was taken).

| 
|
Conclusion
Using well IDs to trace the development history of Uthmaniyah in the Ghawar oil field clearly shows the concentration of drilling as depletion sets in, although a precise time correlation in the 1990s is somewhat elusive. In any event, since your computer has already downloaded it once, you might as well watch it again.
Selected Previous TOD Ghawar entries by Stuart Staniford and Euan Mearns:
Previous entries in The Oil Drum, Satellite Edition:
Contact
- Content: editors at theoildrum dot com
- Tech support: support at theoildrum dot com
License

This work is licensed under a Creative Commons Attribution-Share Alike 3.0 United States License.
Thanks for the work. Great stuff.
Hello JoulesBurn,
Outstanding movie! UTMN now has a bad case of acne or measles from all the dots. Or would smallpox pustules be a better description, and Ghawar is now on the terminal downslope?
Bob Shaw in Phx,Az Are Humans Smarter than Yeast?
WOW, outstanding work! It's so staightforward even I 'get' it : ) I'm reminded of a line from a Bob Dylan song:
"You don't need a weatherman to know which way the wind blows".
A hard wind is coming our way.
PLAN, PLANt, PLANet
Errol in Miami
As I watched the video I could visualize the left side of the Hubbert curve developing.
As the dots appear on the map, you can see them defining the deposit by first drilling on the periphery, only later to saturate the center of the deposit with well. It should be clear that there is no where else to drill once the center is heavily populated with wells. Depletion should soon take the upper hand.
Also, if we are depending on a more natural depletion rate, we should first look at that pressure chart. To the extent that pressures were artificially inflated, production was accelerated at the expense of future production, so the depletion rate on the right side of the Hubbert curve likely will be higher than otherwise. Isn't this what the Mexicans are experiencing now?
Does the drilling pattern make you feel that oil production will be symmetric ?
If not then its not Hubberts curve. My opinion is that this shows why production will be asymmetric with production declining much faster post peak then it increased on the upside.
Fantastic! Thanks for posting this. Forget the static pages, flash forever!
JB
Great work! What is also fun is to grab the movie pointer and drag it back and forth quickly, you'll especially notice the 2000+ years as the drilling of the advancing water front! East meets West
Neven
One thing that is apparent when one does that is the asymmetry of the development. There is clearly a progression predominantly from the west, which I believe is due to the tar mat present on the east side that hinders the flow of injected water. Also, note that the west injectors are drilled uniformly along the original oil water contact (OOWC), in contrast to those one the east, and they were put in earlier.
Hey JB,
Just out of curiosity: can all this Ghawar data you persistently pursued be teamed up with SS, Euan, and F_F, so they could now generate a more accurate present-day Ghawar Oil-Sat Graphic? I have no idea how to correlate this info, but it might yield dramatic results.
Bob Shaw in Phx,Az Are Humans Smarter than Yeast?
Simply amazing Joules! Very nice work. It would seem to agree very nicely with the work by SS and others.
I agree with memmel fwiw, a bit quicker slope on the down side would seem inevitable.
Thank you for your comments, Bob. One thing that has emerged from my work that would be most useful in their efforts is a more accurate measure of the original areal extent of the Arab-D reservoir. I believe this was rather underestimated for Uthmaniyah in their work (as was that for Shedgum).
Cool! whatever helps, all your work is much appreciated by me.
This work is truly astonishing. The only thing I can add to it is a big fat zero (nada, zip), I just wanted to make this comment to let you know your efforts are being appreciated on a worldwide scale.
- eastender from Hungary, Europe -
in 1970 I swear I saw a pointillist butterfly. 2006 looked like a pissed off Dick Cheney.
Great work, great song
Thank you very much for your encouragement.
Thanks. This is amazingly informative analysis.
I wonder how SS interprets this data?
Great work! Thanks!
Your discussion about advancing water floods and well placement made me think further about rising water cut in Aramco’s fields.
The chart below is from Hans Jud’s Dec 2006 report, based mainly on Saleri’s CSIS Feb 2004 reports.
http://www.aspo-portugal.net/Articles/SA-Oilprod_field-by-field_V2.pdf
The chart shows rising production from Uthmaniyah North from 1999 to 2003 which corresponds to your increase in well numbers during the same time period.
Ghawar Production to 2003 - click to enlarge
Saleri gave a Feb 2008 presentation that can be found in the SPE Cairo Section of this link
http://www.leadingreservoirs.com/pda.htm
Saleri discloses some information about Abqaiq which might help with water cut estimates. According to Saleri, this chart shows that Abqaiq was still producing oil at a rate of about 400-500 kbd in 2006.
Abqaiq Reserves and Production to 2006 - click to enlarge
The next chart is also from the same Feb 2008 presentation. The four green lines have been added by me. Eternally optimistic Saleri thinks that the recovery factor can reach 80% of oil in place. I don’t.
Assuming that each blue dot in the chart below represents one month there appears to be little production from Abqaiq at the end of 2006 as the blue dots are in a horizontal position at about 55% oil in place. The water/oil ratio at the end of 2006 was about 0.7 which is equivalent to a water cut of 41%.
Abqaiq Water/Oil Ratio vs % Oil in Place Produced to 2006 - click to enlarge
Saleri has fitted a black line to the blue dots indicating a reasonable rise in the water/oil ratio. However, according to this article, a new fitted line should be added after every workover as shown in the chart below.
http://www.ogj.com/articles/save_screen.cfm?ARTICLE_ID=192951
Consequently, I have added the three green lines, representing pre and post workover events, in the chart above in an attempt to forecast the water/oil ratio. These recent workover events correspond roughly to horizontal wells, MRC wells and smart wells. Note that the green lines intersect at a water/oil ratio of about 5 or water cut of 83%. If 83% is assumed as the point when the oil production wells have to abandoned then the recovery factor for Abqaiq is 65% which is about a URR of 13 Gb for Abqaiq.
Assuming that Abqaiq has produced 400 kbd from start of 2007 to end of first quarter 2008, this means that Abqaiq cumulative production is about 11.3 Gb now. So there's only about 1.7 Gb left. I'm estimating that Abqaiq is probably declining about 10%/year now.
Uthmaniyah North, Abqaiq and Ain Dar/Shedgum are close to each other and have been in production for many decades. It would not surprise me that the water cut of these three regions was approaching 45%.
Oil and Gas Journal – Technique forecasts production from waterflooded reservoirs - click to enlarge
What is remarkable is Saudi Arabia’s consistent export volumes of Saudi light and extra light crude to IEA member countries as shown below.
Saudi Exports to IEA member countries (measured at the importing terminal) - click to enlarge
There about 28 IEA member countries which do not include China or India.
http://www.iea.org/about/membercountries.asp
Abqaiq is a significant source of extra light crude and Uthmaniyah North a significant source of light crude. The chart above shows that the export trend for Saudi light & extra light has been about 2.7 mbd since 2004. However, the exports of Saudi medium and heavy crudes have been dropping.
If water cut continues to rise in North Ghawar as well as Abqaiq there could be a faster decline in production and also in exports of Saudi light and extra light. Khursaniyah is coming on stream later this year and is also a source of light crude. Consequently, Saudi light and extra light crude export decreases may be delayed to 2009.
Ace-
Thanks for the new data.
It seems that the projected Ultimate recovery is 13.9 Billion barrels for Abqaiq from the first figure, but much much greater from the WOR extrapolation.
Given the step in projected URR in 2006 from the first figure, it does not appear that there is much difference between your 13 Bbbl forecast and what is shown there... does there???
FF
JB: Thank you very much for your work. In my opinion you need to understand the development history of a field in order to better understand the reservoir and make reserve/production forecast, and this work makes understanding the development easy.
Ace: Thank you also. From what I have seen the data and analysis that you bring has always been tremendously helpful and informative. The first time I ever stumbled across TOD last year, just happened to be a day when you had posted a write up on world total liquids and C&C production rate and forecasts. I guess it was just coincidence (as many days it is just doom and gloom), but that definitely sold me on this site and I have always read it since then.
The data you added here on Ghawar really adds to this discussion and in general I agree completely with you. Especially on the main question as to when decline will start and what will the rate be. Two minor points that I would interpret slightly differently are on the fit of the WOR vs. recovery curve and the WOR at abandonment. Reserve forecasting and curve fitting are obviously subjective, but just looking at the curve I would probably forecast a line somewhere between your green lines and Saleri's black line. His does look ridiculously optimistic, but I think yours look a little pessimistic also. I also think an abandonment water cut of 83% is too low. Ghawar is on land, the infrastructure is already in place, and it is the biggest field in the world. In my opinion they will probably be producing this field well above a water cut of 99%. This does not change the fact that the field has produced the bulk of its reserves and decline is imminent if not already started, but I think it will ultimately make more than the 1.7 GB although it will be over a very long time frame.
Thanks again for all your work. I have learned a great deal from reading your posts.
Ace fantastic followup you comment should be merged with the main article.
A big point is we are seeing a field that close to 85% depleted yet production levels remain high.
This follows what I've seen from looking at a number of fields that we can maintain production rates up to about 90% depletion for individual fields before it drops off a cliff.
This is consistent with my assertion that the world is actually at a much higher depletion level then most people realize somewhere between 70-90% depleted not the 50% that a symmetric production profile would produce.
The only thing I thing your wrong about is the decline rate for the field 10% is too low try 15-30% post peak production decline rates and assume that production will remain flat for longer.
So I think your wrong about it being in decline now I think decline will set in a bit later towards the end of 2008 but will be a lot steeper. Of course the exact date is impossible to determine but by the end of the year the field should be both in decline and declining at a rate higher than your 10% estimate.
Memmel,
Do you have any case studies of this asymmetric peak? this field has been in production some 60+ years and without decline will max out in another 11, so the evidence would point to a faster decline (or oil is abiotic) or they grossly underestimated the reserve.
Ace,
Is there a case reapplying Hubbert peaks after a rework? ie after you alter the methodology for extracting the oil are you starting from scratch with an albeit smaller reservoir?
Also does anyone know how to pronounce Ghawar?
Neven
WebHubbleTelescope has acutually run the math through his shock model. We disagree on the actual amount of backdated reserves and I've not seen his results for actual data.
http://mobjectivist.blogspot.com/2005/11/can-we-delay-peak-by-upping-ext...
Ivanhoe has almost exactly the numbers I've come up with.
http://hubbert.mines.edu/
Paper here
http://hubbert.mines.edu/news/Ivanhoe_96-1.pdf
GailTheActuary posted a key post showing that stated reserves and production where not consistent.
I don't have the link but its recent. I believe the Ivanhoe link was posted on that thread.
http://www.theoildrum.com/node/3664
Here is one of my original posts starting with water cut.
http://www.theoildrum.com/node/3272#comment-267260
Given that most of the world oil discoveries are in the past when Ivanhoe made his prediction 1992.
And given the world water cut from the Ferro paper of 80-90%.
And given Gails work then if your willing to discount the large reserve additions not backed by new discoveries then I'm probably right are actually Ivanhoe is I just came to the same conclusion via a different route.
Other approaches show asymmetric production.
Bakhtiari's WOCAP model is not all that different and has been the most accurate to date.
http://www.sfu.ca/~asamsamb/sb.htm
I'm not finding one of the graphs with a lot of models on it its common you can google for it.
But most have asymmetric production curves. HL is symetric only because if the simplicity of the model.
Both its power and weakness.
This is terrific stuff, JB.