Peak Oil Update - July 2009: Production Forecasts and EIA Oil Production Numbers
Posted by Sam Foucher on July 7, 2009 - 10:05am
An update on the latest production numbers from the EIA along with graphs/charts of different oil production forecasts.
 and various forecasts (2001-2027)")
World oil production (EIA Monthly) for crude oil + NGL. The median forecast is calculated from 15 models that are predicting a peak before 2020 (Bakhtiari, Smith, Staniford, Loglets, Shock model, GBM, ASPO-[70,58,45], Robelius Low/High, HSM,Duncan&Youngquist). 95% of the predictions sees a production peak between 2008 and 2010 at 77.5 - 85.0 mbpd (The 95% forecast variability area in yellow is computed using a bootstrap technique). The magenta area is the 95% confidence interval for the population-based model. Click to Enlarge.
Notations:
- mbpd= Million of barrels per day
- Gb= Billion of barrels (109)
- Tb= Trillion of barrels (1012)
- NGPL= Natural Gas Plant Liquids
- CO= Crude Oil + lease condensate
- NGL= Natural Gas Liquids (lease condensate + NGPL)
- URR= Ultimate Recoverable Resource
EIA Last Update (March)
Data sources for the production numbers:
- Production data from BP Statistical Review of World Energy (Crude oil + NGL).
- EIA data (monthly and annual productions up to March 2009) for crude oil and lease condensate (noted CO) on which I added the NGPL production (noted CO+NGL).
The all liquid peak is now July 2008 at 86.65 mbpd, the year to date average production value in 2009 (3 months) is down from 2008 for all the categories. The peak date for Crude Oil + Cond. is also July 2008 at 74.80 mbpd (see Table I below).
")
Fig 1.- World production (EIA data). Blue lines and pentagrams are indicating monthly maximum. Monthly data for CO from the EIA. Annual data for NGPL and Other Liquids from 1980 to 2001 have been upsampled to get monthly estimates.
| Category | MAR 2009 | MAR 2008 | MAR 2007 | 12 MA1 | 2009 (3 Months) | 2008 (3 Months) | 2007 (3 Months) | Share | Peak Date | Peak Value |
|---|---|---|---|---|---|---|---|---|---|---|
| All Liquids | 83.75 | 85.98 | 84.25 | 84.93 | 83.60 | 85.48 | 84.42 | 100.00% | 2008-07 | 86.65 |
| Crude Oil + NGL | 79.97 | 82.35 | 80.92 | 81.14 | 79.79 | 81.73 | 80.96 | 95.49% | 2008-07 | 82.88 |
| Other Liquids | 3.78 | 3.63 | 3.33 | 3.79 | 3.81 | 3.75 | 3.45 | 4.51% | 2008-11 | 3.89 |
| NGPL | 7.97 | 8.06 | 7.95 | 7.89 | 7.86 | 7.93 | 7.96 | 9.52% | 2008-07 | 8.08 |
| Crude Oil + Condensate | 72.00 | 74.29 | 72.97 | 73.25 | 71.93 | 73.80 | 73.01 | 85.97% | 2008-07 | 74.80 |
| Canadian Tar Sands | 1.26 | 1.19 | 1.26 | 1.22 | 1.24 | 1.20 | 1.19 | 1.50% | 2007-08 | 1.35 |
Table I -
Production
estimate
(in millions of barrels per day (mbpd)) up to March 2009 taken from
the EIA website (International
Petroleum Monthly). 1Average
on the last 12 months. Canadian tar sands production numbers are from
the NEB and includes updagraded and
non-upgraded bitumen.
Business as Usual
- EIA's International Energy Outlook 2006, reference case (Table E4, World Oil Production by Region and Country, Reference Case).
- IEA total liquid demand forecast for 2006 and 2007 (Table1.xls).
- IEA World Energy Outlook 2008, see post here for details.
- IEA World Energy Outlook 2006 : forecasts for All liquids, CO+NGL and Crude Oil (Table 3.2, p. 94).
- IEA World Energy Outlook 2005 : forecast for All liquids (Table 3.5).
- IEA World Energy Outlook 2004 : forecast for All liquids (Table 2.4).
- A simple demographic model based on the observation that the oil produced per capita has been roughly constant for the last 26 years around 4.4496 barrels/capita/year (Crude Oil + NGL). The world population forecast employed is the UN 2004 Revision Population Database (medium variant).
- CERA forecasts for conventional oil (Crude Oil + Condensate?) and all liquids, believed to be productive capacities (i.e. actual production + spare capacity). The numbers have been derived from Figure 1 in Dave's response to CERA.

Fig 4.- Production forecasts assuming no visible peak.
PeakOilers: Bottom-Up Analysis
- Chris Skrebowski's megaprojects database (see discussion here).
- The ASPO forecast from April newsletter (#76): I took the production numbers for 2000, 2005, 2010, 2015 and 2050 and then interpolated the data (spline) for the missing years. I added the previous forecast issued one year and two years ago (newsletter #58 and #46 respectively).
- Rembrandt H. E. M. Koppelaar (Oil Supply Analysis 2006 - 2007): "Between 2006 and 2010 nearly 25 mbpd of new production is expected to come on-stream leading to a production (all liquids) level of 93-94 mbpd (91 mbpd for CO+NGL) in 2010 with the incorporation of a decline rate of 4% over present day production".
- Koppelaar Oil Production Outlook 2005-2040 - Foundation Peak Oil Netherlands (November 2005 Edition).
- The WOCAP model from Samsam Bakhtiari (2003). The forecast is for crude oil plus NGL.
- Forecast by Michael Smith (was at the Energy Institute, now works for EnergyFiles) for CO+NGL, the data have been taken from this chart in this presentation (The Future for Global Oil Supply (1641Kb), November 2006.).
- PhD thesis of Frederik Robelius (2007): Giant Oil Fields - The Highway to Oil: Giant Oil Fields and their Importance for Future Oil Production. The forecasts (low and high) are derived from this chart.
- Forecast by TOD's contributor Ace, details can be found in this post.
- The forecast by Duncan and Youngquist made in 1999, see also this post by Euan Mearns.

Fig 5.- Forecasts by PeakOilers based on bottom-up methodologies.
PeakOilers: Curve Fitting
The following results are based on a linear or non-linear fit of a parametric curve (most often a Logistic curve) directly on the observed production profile:- Professor Kenneth S. Deffeyes forecast (Beyond Oil: The View From Hubbert's Peak): Logistic curve fit applied on crude oil only (plus condensate and probably excluding tar sand production) with URR= 2013 Gb and peak date around November 24th, 2005.
- Jean Lahèrrere (2005): Peak oil and other peaks, presentation to the CERN meeting, 2005.
- Jean Lahèrrere (2006): When will oil production decline significantly? European Geosciences Union, Vienna, 2006.
- Logistic curves derived from the application of Hubbert Linearization technique by Stuart Staniford (see this post for details).
- Results of the Loglet analysis.
- The Generalized Bass Model (GBM) proposed by Prof. Renato Guseo, I used his most recent paper (GUSEO, R. et al. (2006). World Oil Depletion Models: Price Effects Compared with Strategic or Technological Interventions ; Technological Forecasting and Social Change, (in press).). The GBM is a beautiful model that has been applied in finance and marketing science (see here for some background). The estimation in Guseo's article was based on BP data from 2004 (CO+NGL).
- The so-called shock model proposed by TOD's poster WebHubbleTelescope . You can find a description of his approach on his blog here as well as a review on TOD. The current estimate was done in 2005 based on BP's data (CO+NGL).
- The Hybrid Shock Model is a variant of the shock model described here. The forecast is based on EIA data (up to 2006) for crude oil + condensate, the ASPO backdated disovery curve and assumes no reserve growth and declining new discoveries.

Fig 6.- Forecasts by PeakOilers using curve fitting methodologies.
Forecast Performance
It is difficult to compare forecasts because they deal with different liquid category and have different baseline. The forecasts were evaluated using the Mean Asolute Scaled Error (MASE) proposed by Hyndman and Koehler [1]. A good forecast will have a MASE value less than 1 (i.e. better performance than a simple naive forecast). We can notice than some MASE curves are decreasing with time indicating that their predicted values are getting more accurate further in time.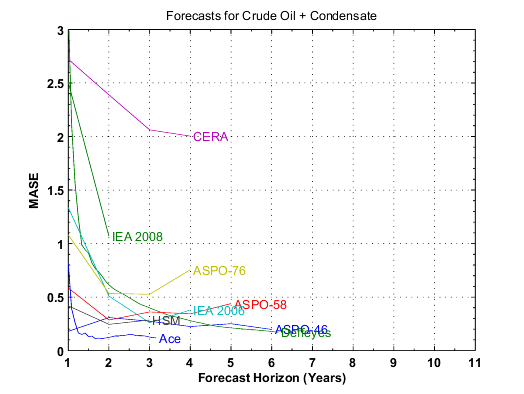
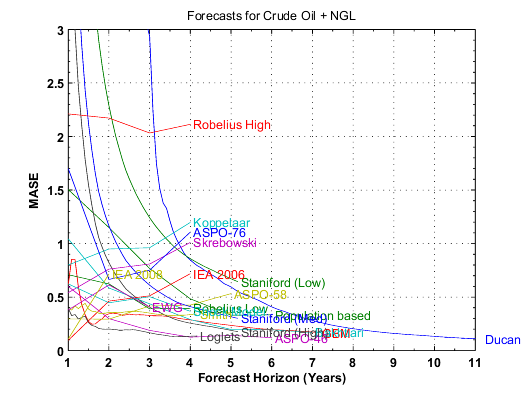
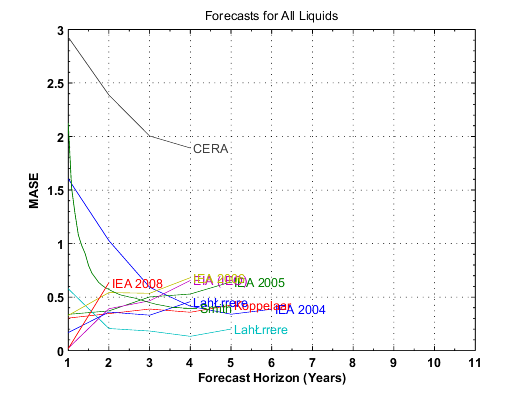
Fig. 7. - MASE values as a function of the forecast horizon.
| Forecast | Date | 2006 | 2008 | 2009 | 2010 | 2015 | MASE2 | Peak Date | Peak Value |
|---|---|---|---|---|---|---|---|---|---|
| All Liquids | |||||||||
| Observed (All Liquids) | 84.54 | 85.48 | 83.60 | NA | NA | 2008-07 | 86.65 | ||
| IEA (WEO) | 2004 | 83.74 | 87.08 | 88.74 | 90.40 | 98.69 | 0.39 | 2030 | 121.30 |
| IEA (WEO) | 2005 | 85.85 | 89.35 | 90.98 | 92.50 | 99.11 | 0.64 | 2030 | 115.40 |
| Koppelaar | 2005 | 85.78 | 87.60 | 88.33 | 89.21 | 87.98 | 0.42 | 2011 | 89.58 |
| Lahèrrere | 2005 | 84.47 | 85.87 | 86.46 | 86.96 | 87.77 | 0.20 | 2014 | 87.84 |
| EIA (IEO) | 2006 | 84.50 | 88.23 | 90.00 | 91.60 | 98.30 | 0.65 | 2030 | 118.00 |
| IEA (WEO) | 2006 | 85.10 | 88.17 | 89.73 | 91.30 | 99.30 | 0.68 | 2030 | 116.30 |
| CERA1 | 2006 | 89.52 | 93.75 | 95.34 | 97.24 | 104.54 | 1.89 | 2035 | 130.00 |
| Lahèrrere | 2006 | 84.82 | 87.02 | 87.99 | 88.93 | 92.27 | 0.46 | 2018 | 92.99 |
| Smith | 2006 | 87.77 | 94.38 | 96.98 | 98.94 | 98.56 | 0.39 | 2012-05 | 99.83 |
| IEA (WEO) | 2008 | 83.15 | 85.51 | 86.80 | 88.15 | 94.40 | 0.63 | 2030 | 106.40 |
| Crude Oil + NGL | |||||||||
| Observed (EIA) | 81.25 | 81.73 | 79.79 | NA | NA | 2008-07 | 82.88 | ||
| Duncan & Youngquist | 1999 | 83.93 | 83.55 | 82.90 | 81.65 | 73.47 | 0.11 | 2007-01 | 83.95 |
| Population based | 2004 | 79.73 | 81.58 | 82.50 | 83.42 | 88.01 | 0.33 | 2050 | 110.64 |
| GBM | 2003 | 76.27 | 76.20 | 75.87 | 75.30 | 67.79 | 0.17 | 2007-05 | 76.34 |
| Bakhtiari | 2003 | 80.89 | 80.24 | 78.94 | 77.64 | 69.51 | 0.17 | 2006 | 80.89 |
| ASPO-46 | 2004 | 80.95 | 80.59 | 80.31 | 80.00 | 73.77 | 0.12 | 2005 | 81.00 |
| ASPO-58 | 2005 | 82.03 | 84.05 | 84.74 | 85.00 | 79.18 | 0.53 | 2010 | 85.00 |
| Staniford (High) | 2005 | 77.92 | 78.63 | 78.86 | 79.01 | 78.51 | 0.18 | 2011-10 | 79.08 |
| Staniford (Med) | 2005 | 75.94 | 75.91 | 75.76 | 75.52 | 73.00 | 0.30 | 2007-05 | 75.98 |
| Staniford (Low) | 2005 | 70.13 | 69.20 | 68.60 | 67.92 | 63.40 | 0.64 | 2002-07 | 70.88 |
| IEA (WEO) | 2006 | 81.38 | 83.96 | 85.24 | 86.50 | 92.50 | 0.72 | 2030 | 104.90 |
| Koppelaar | 2006 | 82.31 | 85.60 | 88.03 | 91.00 | NA | 1.20 | 2010 | 91.00 |
| Skrebowski | 2006 | 81.97 | 85.14 | 86.76 | 87.95 | NA | 1.01 | 2010 | 87.95 |
| Smith | 2006 | 82.81 | 88.27 | 90.58 | 91.95 | 88.60 | 0.34 | 2011-02 | 92.31 |
| Loglets | 2006 | 82.14 | 83.74 | 84.29 | 84.65 | 83.26 | 0.14 | 2012-01 | 84.80 |
| ASPO-76 | 2006 | 79.00 | 85.06 | 88.49 | 90.00 | 85.00 | 1.11 | 2010 | 90.00 |
| Robelius Low | 2006 | 82.19 | 82.35 | 81.92 | 81.84 | 72.26 | 0.39 | 2007 | 82.50 |
| Robelius High | 2006 | 84.19 | 89.27 | 91.65 | 93.40 | 92.40 | 2.11 | 2012 | 94.54 |
| Shock Model | 2006 | 80.43 | 79.51 | 78.93 | 78.27 | 73.74 | 0.37 | 2003 | 81.17 |
| EWG | 2007 | 81.00 | 79.79 | 79.00 | 78.06 | 69.21 | 0.41 | 2005 | 81.39 |
| IEA (WEO) | 2008 | 79.80 | 81.59 | 82.49 | 83.40 | 87.40 | 0.71 | 2030 | 95.00 |
| Crude Oil + Lease Condensate | |||||||||
| Observed (EIA) | 73.46 | 73.80 | 71.93 | NA | NA | 2008-07 | 74.80 | ||
| ASPO-46 | 2004 | 72.56 | 71.89 | 71.47 | 71.00 | 63.55 | 0.20 | 2005 | 72.80 |
| Deffeyes | 2004 | 69.92 | 69.64 | 69.37 | 69.01 | 65.98 | 0.17 | 2005-12 | 69.94 |
| ASPO-58 | 2005 | 73.80 | 75.39 | 75.89 | 76.00 | 69.50 | 0.44 | 2010 | 76.00 |
| IEA (WEO) | 2006 | 71.78 | 73.76 | 74.74 | 75.70 | 80.30 | 0.38 | 2030 | 89.10 |
| CERA1 | 2006 | 76.89 | 80.35 | 81.58 | 82.29 | 83.83 | 2.00 | 2038 | 97.58 |
| ASPO-76 | 2006 | 72.10 | 75.74 | 77.47 | 78.00 | 72.00 | 0.75 | 2010 | 78.00 |
| HSM | 2007 | 73.56 | 73.40 | 73.16 | 72.82 | 69.53 | 0.28 | 2006 | 73.56 |
| Ace | 2007 | 73.48 | 72.18 | 69.77 | 66.96 | 58.47 | 0.12 | 2006-01 | 73.55 |
| IEA (WEO) | 2008 | 69.73 | 70.64 | 71.06 | 71.46 | 73.00 | 1.07 | 2030 | 75.20 |
Are We There Yet?
We can consider two competitive models for the crude oil + NGL production:
- M0: The oil production will continue to grow with the world population at a constant rate of 4.3 barrels per capita.
- M1: The production will fall according to the average peak oil forecast.
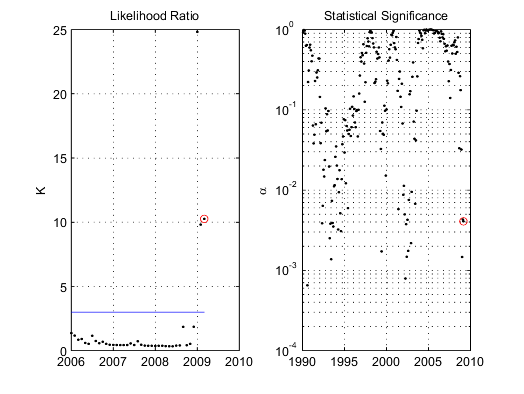
Fig. 8 - Likelihood ratio (M1/M0) at the left and Statistical significance of observed production levels according to M0 (the red circle is March 2009).
Previous Update:
August 2008[1] Rob J. Hyndman, Anne B. Koehler, Another look at measures of forecast accuracy, International Journal of Forecasting, Volume 22, Issue 4, October-December 2006, Pages 679-688. pdf available here.
Peak Oil Update - July 2009: Production Forecasts and EIA Oil Production Numbers
PDF version
45 comments
Peak Oil Update - July 2009: Production Forecasts and EIA Oil Production Numbers
PDF version
45 comments
“Government is too big and too important to be left to the politicians.”
—Claire Huchet Bishop
Contact
- Content: editors at theoildrum dot com
- Tech support: support at theoildrum dot com
License

This work is licensed under a Creative Commons Attribution-Share Alike 3.0 United States License.
Excellent work - a couple of quick questions if I may:
1. Are the median and mean projections of pre-2020 peaks shown in the first chart drawn from curves of the same thing? I.e. are they all CO + NGL, or similar? I think this is addressed in the forecast performance section, but it isn't clear (to me at least - apologies if I have missed an obvious comment)
2. How does the statistical significance tests from the 'Are we there yet' section look if one uses developed world GDP growth rather than population growth? Without wishing to defend the CERA models, the obvious rebuttal of the two statistical outliers in the M0 example is that world growth has been falling recently.
Obviously, this last point gets into a deeper topic of whether GDP growth drives oil demand, or whether oil supply drives GDP growth - but it would be interesting to see the analysis nonetheless.
Great stuff though.
1. Yes, it is only including forecasts for CO+NGL.
2. Looking stricly at the significance levels, there are nothing unusual in the current production drop. Lower significance levels were observed during past recessions. Having said that, I'm just looking at volume supplied in isolation, other market indicators, such as oil prices, have been significantly high.
There is clearly a positive feedback between economic activity and oil demand and a negative feedback between oil prices and economic activity.
Thanks for your update! Always interesting!
Would it make sense sometime to put together an exhibit of just very recent forecasts? So much has happened in the last year, that I wonder if some of the forecasters would want to change their forecasts.
By the same token, do you have info on older forecasts? Freddy Hutter tracks these, Lahèrrere won the blue prize for 2008, predicting 85 mb/d with 85.5 mb/d actual, prediction from 1997. FWIW, as they say.
Would be interesting as well to see the MASE applied to each class of forecasting, or price calls.
Here's the forecasts ranked by MASE score; also threw in peak dates - had to leave out date ranges owing to lack of ability/time:
Thanks!
It's a nice way to show the results, I'm going to keep the idea.
can someone test if there is a statistically significant correlation between assumed/predicted peak date and accuracy -- it seems that the 10 best performing models all peak in the next 5 years, while 10 out of the worst 15 predict a peak 20 or more years from now.
Here's the reddit & digg links for this post (we appreciate your helping us spread our work around, both in this post and any of our other work...):
http://www.reddit.com/r/environment/comments/8yzey/peak_oil_update_july_...
http://www.reddit.com/r/energy/comments/8yz8c/peak_oil_update_july_2009_...
http://www.reddit.com/r/reddit.com/comments/8yzem/peak_oil_update_july_2...
http://www.reddit.com/r/collapse/comments/8yzew/peak_oil_update_july_200...
http://digg.com/business_finance/Peak_Oil_Update_July_2009_Production_Fo...
Find us on twitter:
http://twitter.com/theoildrum
http://friendfeed.com/theoildrum
Find us on facebook and linkedin as well:
http://www.facebook.com/group.php?gid=14778313964
http://www.linkedin.com/groups?gid=138274&trk=hb_side_g
The main problem I see with the first graph is that we are -within the limits of statistical deviation- following a BAU trend (pink band) whereas the Yellow band (The PO camp) predicts a civilisation changing once-in-a-lifetime event. To use a contradiction in terms an obvious Black Swan...
Mmmm, $63 -the price signal is telling me "no worries mate..."
Nick.
It's always interesting to look at these production numbers, particularly given the admirable detail, but I'm really not sure how much this historical data can tell us right now. What we really need to know is total productive capacity rather than actual production, but of course that is an impossible number to know. Just how much excess capacity does OPEC have?
We should at least factor in an additional 4 million b/d of spare capacity just to account for OPEC cuts since the fourth quarter of 2008. In relaity the number is likely to be slightly higher given the ramp-up of the AFK fields. If we added that to current production we'd have a new peak - what sort of impact would that have on the projections above?
Bingo! This is the problem we see so often: Using oil production volumes as a yardstick for determining if we're at a supply-induced peak. Right now, it's pretty clear we're in a lull in production simply because demand is down. That's a radically different situation compared to a supply-induced peak.
The number I've seen quoted a few times recently is that there's currently 6.5 mb/d of excess capacity in the world (just OPEC?). Assuming that number is correct, that says we can muddle along with a slow economy for some time before capacity drops to meet demand. I won't presume to guess whether "some time" is one year or ten.
This is not a comment about the original story or anyone or anything in particular on this site, but those of us who understand what peak oil is and how serious it could be have to be careful not to read too much into every scrap of data. That quickly leads to wildly incorrect conclusions. I doubt I have to remind anyone here of the spectacle leading up to Y2k. That was a real and very serious problem, but the TEOTWAWKI crowd grossly underestimated our ability to address it. Yes, peak oil and Y2k are very different, but the more those of "us" act like the Y2k nutjobs, the harder it will be to convince mainstream voters and consumers that we all have to take action as soon as possible, and not wait for "someone else" to fix it.
The CERA 2006 forecast seemed to incorporate spare capacity - note that for the year of publication it was in excess of observed production. It's odd that 3 years later no one knows what the precise methodology used was.
You can smooth out bumps like our current shut-in production. As Deffeyes wrote, his HL curve for the world incorporates all manner of disasters impacting production - two World Wars, the Great Depression, Jimmy Carter...
The ideal HL curve cannot account for disasters. You have to know the shape of perturbations due to these events to extract the linear portion. The general form of linearization for doing a regression looks like the following:
Normally df/DX is a constant for exponential growth but anything that disrupts that trend will put HL out of whack.
So I would say that Deffeyes merely asserted that HL incorporates disasters. Reading his books, he treats the HL as a heuristic, in that it does not explain anything but may describe some behavior; he did not even point out the general form. But therein lies the problem -- with a heuristic, you can assert anything you like.
Hello TODers,
"She comes down from Yellow Mountain.."
http://www.flickr.com/photos/gord99/280466011/
http://farm1.static.flickr.com/100/309830112_23d066a567.jpg
-----------------------------
"Joy, beautiful spark of the gods,
Daughter of Elysium,
Touched with fire, to the portal,
Of thy radiant shrine, we come.
Your sweet magic frees all others,
Held in Custom's rigid rings.
All men on earth become brothers,
In the haven of your wings."--Schiller
---------------------
First, my huge THXS to Sam for this gigantic body of work--mucho gracias! And I thought WT worked hard here on TOD--WT is a mere slacker compared to Sam the Man! :)
Second, I found this crude-capacity minithread of Sam's Keypost very thought-provoking.
For comparision sakes: Recall that POT's topdog, Bill Doyle, has large reserves and excess capacity, too, but he has approximately stated that he sees no Strategic nor Financial Reason to sell potash[K] for less than what he perceives as its long term value and to help keep the pull-system supply chain viable for as long as possible. He has no problem shutting in capacity to keep the price as high as possible to maximize its value [Recall my earlier postings on Canpotex, Belaruskali, and Webb/Pomerene]. In short: He realizes that it is CRAZY & DUMB & DELUSIONAL to sell at a loss/unit then hoping to make it up in volume flowrates.
Let's hope the FF-producers have come to the same realization. Recall the Saudi King hinting at flowrate restrictions so future generations might have a chance...I hope this is REAL for Optimal Overshoot Decline, not just political propaganda while pumping full out.
If volume demanded suddenly ramps, but the Saudis refuse to increase supply by bringing their stated excess capacity into a sustained multi-month production flowrate: IMO, this finally joins together the combo of the Saudi long-term Goal and the Saudi-Peak C&C flowrate, then its downhill from there [Saudi sloping-plateau or Saudi-cliff: I am unsure, but I lean more towards a Saudi Shark-fin].
But Ron P might be right: "I firmly believe that they were producing flat out for first three quarters last year. Those very high prices were prompting them to squeeze every possible barrel out of the ground. And, with the possible exception of Saudi Arabia, production capacity has very likely gone down since then."
If Ron's assessment is correct, and he is not the only one positing this possibility, then fast C&C depletion rates and WT's ELM may really start hammering the global economy going forward.
Fortunately [Unfortunately?], as we are geologically forced to increasingly move to also-depleting heavy, sour crude & sour natgas extraction: the volumes of recovered-[S]ulfur can be expected to increase. If S is long-time hoarded into many giant S-blocks with legal acts like Webb/Pomerene, so that the price can dramatically rise per ton: this might be a Leading Indicator of C&C Peaking.
Recall that most S is devoted to beneficiating [P]hosphorus, and other types of finished product I-NPKS, and Nothing is more inelastic at minimal demand than food demand as global pop is still up-trending.
Conversely, 100 lbs of I-NPKS generally packs the same photosynthesis punch as one ton of O-NPK manure==>But we don't seem to be rapidly ramping O-NPK recycling either as FFs are becoming unaffordable Unobtainium. So this seems to be another keystone fact that S-demand is very inelastic as the global economy seems to continue to implode.
S is also the Primary Input in most industrial processes in everything from matches, to water & sewage treatment, to pickling steel, to mining many other minerals, to high-grade food additives and high purity vitamins and pharmaceuticals. Most people I know will gladly pay heavily for matches, potable water, vitamins & drugs, etc, if dire-required-->IMO, further proof of S-inelasticity.
On the other hand, top-level S-demand can be incredibly strong when the global economy is strong: recall the TWENTYFOLD S-price increase in less than a year, continuing even after the crude price had already started down strongly from its July '08 $148 peak-Price:
http://minerals.usgs.gov/minerals/pubs/commodity/sulfur/mis-200808-sulfu...
--------------
..Indications are that global sulfur prices have begun to decline,
although the average customs value of elemental sulfur imported into the United States was still trending higher. The average unit value of imported sulfur was $378 per ton in August 2008. This was 17% higher than that of July 2008 and nearly 20 times what it was in August 2007.
--------------
If what Gail, Nate, and others posit: that debt funding will be hard to get going forward, IMO, I increasingly expect the FF-producers seeking to raise immediate cash by getting more per S-ton versus selling it for basically the shipping cost [recent ADNOC price $35/ton, much less than $35 when Japan was dumping S into China at $3-10/ton]:
http://www.tradingmarkets.com/.site/news/Stock%20News/2361968/
If the above weblink has gone dead, there is a brief excerpt [reproduced below for your convenience] in this TODlink: http://www.theoildrum.com/node/5463/508250
------------------
China's metal firms to file for anti-dumping investigation into sulphuric acid
Fri. June 05, 2009; Posted: 05:17 AM
China's nine major nonferrous metal companies are planning to submit an application to the Ministry of Commerce (MOC) for anti-dumping investigation into sulphuric acid imported from Japan and the Republic of Korea (ROK).
..The cost price of sulphuric acid usually stands at 100 yuan/ton, or about 14.7 U.S. dollars/ton. However, the CIF price of the product from Japan or South Korea to China only stays at 3-10 U.S. dollars/ton, even lower than the freight cost of 15-18 U.S dollars/ton.
Currently, selling prices of sulphuric acid in the above two countries reach 30-50 U.S. dollars/ton.
----------------------
Recovered-S is the 'lifeblood' of our modern civilization and energy inputs into our infrastructure 'heart' helps pump it around the planet:
http://en.wikipedia.org/wiki/File:Burning-sulfur.png
--------------
blood & butterflies
--------------
Bob Shaw in Phx,Az Are Humans Smarter than Yeast?
Hi LouGrinzo,
Although there were Y2K "nutjobs" that predicted a hopeless situation, I think it is instructive to look at what actually did happen in that case.
The fact is that all the publicity put the vast majority of companies (those with any significant amount of IT) on a war footing. Hordes of old COBAL programmers were brought back into the workforce to scoure old code and fix potential problems. I was an IT manager at that time and I can say that the only reason a huge problem was avoided is because serious action was taken to fix vunerable code. The threat was very real. No IT manager wanted to explain why the payroll failed after Jan 1, 2000. It is ironic that the Y2K threat is viewed in hindsight as being an example of unfounded hysteria. The fact is that problems were avoided because action was taken to fix the problems before the clock ran out.
What should we learn that can be applied to PO? Duh...
May 2009 OPEC production was only 2,021,000 barrels per day, (C+C), above those of the fourth quarter of 2008. OPEC's highest quarter was the third quarter of 2008. May 2009 production was 3,220,000 barrels per day above their third quarter numbers.
That being said, we actually have no idea what OPEC's production capacity really is. I firmly believe that they were producing flat out for first three quarters last year. Those very high prices were prompting them to squeeze every possible barrel out of the ground. And, with the possible exception of Saudi Arabia, production capacity has very likely gone down since then.
Ron P.
And depletion marches on. Based on Sam's modeling of the top five net oil exporters, they will probably have shipped on the order of one-third of their post-2005 cumulative net oil exports by the end of 2010, 18 month from now.
Did you mean below? EIA says first ten months 2008 opec averaged 31,459kb/d, then transitioned down to 28,686k/d avg jan-apr 09, a reduction of 2,773k/d... so, if SA capacity really increased say 750k/d, then opec spare capacity = 3,500k/d. In awarding a ribbon to the closest guesser, a guess of around 83.5Mb/d looks about right for the amount that would be produced these days if prices had stayed around 100/b... Robelius low looks pretty good, might as well go with his curve.
On this basis, and thinking a little further out, he guesses capacity will decline to current production in 2012... - but maybe he didn't include an increase in SA capacity, meaning we might still have a little surplus then - so considering that prices have been held up by the squirrels, and that they are running out of storage, and that the recession will get worse, IMO much worse, before it gets better, then prices will fall at least until 2012. OPEC probably needs to cut another 1Mb/d as oil comes out of storage to avoid a hard fall, maybe 2 or more as recession bites... 2015 does look another story...
High oil prices last year hurt, but high oil didn't cause the ballooning debt or the debt implosion that has just started. I used to think that USG would be more aggressive now than in the thirties, but on reflection USG is financially far weaker now given current debt, deficit and future liabilities... we can no longer spend our way out of this without either debasing the currency, sucking every dollar of savings out of our economy, or both. Deflationary now, maybe inflationary by and by...
Most people think we can simply keep on borrowing from the friendly foreigners, but foreigners' source of dollars is drying up along with our trade deficit just when our need for dollars is exploding. Print it or borrow it from ourselves.
I'm not quibbling with the notion of peak oil, or indeed suggesting OPEC has an unlimited ability to produce more oil, but I do wonder whether the forecasting of peak can retain any real value in a world which now clearly does have very real, and substantial, levels of spare capacity. There is also the question of oil demand - and it is really the intersection of these two elements which raises everyone's concerns. In simplistic terms, projecting a production peak of 10 b/d in x year is interesting but unimportant if there is only demand for 1 b/d. I want to know when demand and supply intersect, and we then have to deal with shortage. Focussing just on the supply side may leave us open to premature forecasts of energy shortages, and the casino nature of the current oil market is not helping as financial institutions are in a very real way responsible for the excessive price rises of the past 18 months (and the last 6 months in particular).
I want to raise a few salient facts which need to be assessed in more detail.
1. Oil demand is not exponential or static. Look at OECD oil demand from Q4 2005 on an annualised basis by quarter. It falls in every successive quarter. This includes years of strong economic growth in 2006 and 2007. What happened in Q4? Hurricane Katrina. Prices suddenly surged and consumers became aware, and began to later their behaviour. Non-OECD consumers did not - but in most cases consumer prices were subsidised. They won't be next time, so what kind of demand response came we really expect from prices?
2. OPEC produced 32.8 million b/d of C+C in June 2008. By February 2009 this was reduced to 28.1 million b/d. It's a touch higher now - that's 4.7 million b/d in the bank. I don't think we have depleted that much in 8 months. It's difficult to say for certain, but I do suspect the Saudis had a little left in the tank last year (but not much). Since we began this year Angola has added several new fields along with Nigeria (offset by problems onshore) and the Qataris are ramping up very large volumes of NGLs. I'm betting we've got at least 5 million b/d of shut-in production that could be brought on stream.
3. Inventories are near capacity. I don't know if anyone has noticed, but as of today the world is enjoying a massive surplus of oil - there's a risk we will run out of storage capacity (China already has - they cut exports this month because they have nowhere left to put any oil). We've got 5 million b/d of capacity in the bank, and 2.8 billion barrels clogging up inventories to the extent that traders are chartering tankers to store oil in rather than move it. It's going to take many months (24-36 at a guess) to reverse this situation - and that assumes we have demand growth next year and no supply additions.
4. Prices have been run up for a variety of reasons - inflations worries, weak dollar, reduced perception of financial risk, concept of commodity scarcity, manipulation(?). But we have seen the rally (on low volumes) topping out because there has been no demand rebound. None. Might still be a bit early, but as inventory costs are rising,. if I'm a refiner dealing with excess reserves of crude, weak margins across the board and no demand I'm not paying a high price for crude. The paper market can add in the hypothetical demand, but eventually the physical market takes over. That's what we're seeing now. We're going to plummet past $60 and test lows in $40s. You need to look at prices over a longer period because the market is skewing the message.
5. My final and main point is this. In the current environment, modelling possible peak dates using published supply data is not possible (due to spare capacity) and not useful (due to falling demand). There's a risk that the message gets lost if this is not taken on board, because I believe we will be looking at low prices for at least 12-18 months and everyone will blame the price run-up on speculators. To continue to project imminent catastrophe may not be helpful and yes, it might mean a lot of people saying "I told you so". I do think that we will however face problems if more is not done to address our dependence on liquid fossil fuels, so I hope that the community can adapt to the current situation in the industry. This is in many ways a good thing - there is much more time to adapt than there was 12 months ago.
Just a few thoughts to spark discussion.
As long as the majority of corporations and corporate-nations continue to obscure and obfuscate the numbers, we will need any independent forecasts that we can lay our hands on. Moreover, we also need a deeper understanding of depletion dynamics as we will no doubt go through this process again with some future resource.
I realize that many people do have this intuitive feel about the lack of spare capacity, but whence did this intuition come from? Could it be due to the effort of people working on these models? I work on visual simulations elsewhere, and I routinely find that customers disparage a simulation several weeks after seeing it for the simple fact that what it showed was pretty obvious -- and this is of course not long after they had a quite profound "aha" moment that we had witnessed first-hand. Gaining an understanding of a tricky situation always gets marginalized, as that is human nature.
As to your points regarding supply & demand, one can easily apply perturbations to the reserves via something like the oil shock model and see how the profile changes. Without the model available, intuition often fails. People just aren't used to dealing with real resource constraints.
Another way to look at it is the pink represents demand, since the non PO people seem to be betting supply can meet demand. Yellow means projected supply.
The real problems will hit when the paths diverge, somewhere between 2010 and 2015. Even then, there is this tendency for market momentum to not notice the problem for two or three years, longer if we continue into a depression and demand destruction follows supply destruction.
It is likely to be "no worries mate" until 2012-2018.
I guess that brings me on to another major issue I have with 'Peak Oil' (or rather the impact) and that is what will define the moment -if any- when we realize that the divergence is upon us?
-For example so far the current decline has been entirely explained away as the impact of the recession gripping the globe and OPEC cutbacks. A big increase will be OPEC coming back online as prices go over $100... etc. Various factors above ground -not least our use of a fiat currency proxy supposedly indicating 'value'- could mask the real problem until it is far far too late...
Nick.
For that to happen the recession would have to be over. Demand for oil would increase then oil prices would go up and OPEC, to keep prices from going higher, would increase production. Fat chance of that happening any time soon.
A more likely scenario would be that the economy gets worse and oil demand drops further. OPEC makes further cuts in a vain attempt to keep prices above $60 a barrel.
Soon, within the next few years, total economic collapse. The world will never realize we have reached peak oil... Pity.
Ron P.
It is beautifully ironic that total economic collapse is what peak oilers have been forecasting for years.
Without energy constraints, the banks would likely have continued to raise the multiples of their capital that they leant - and the party would have continued forever on an infinite planet.
Just as a reminder, I don't remember ever predicting collapse, and I don't recall many of the dedicated peak oil data analysts, Sam included, predicting collapse. Most of the analyses have been pretty objective and they simple look at the trends in production.
What someone else wants to infer from the forecasts or projections is free to do that.
I suppose you could say that Richard Duncan has tried to model the entire arc, collapse included, but I wouldn't go near that mess with a 10-foot pole. To forecast a collapse you need a measure or metric to gauge your results against, and I don't that that something like Standard of Living (SL) will cut it, as it seems very subjective.
Fair comments. I've been drawn too far to the dark side.
It's always darkest before the dawn...
Did you watch Prince Charles speech? Should be on iPlayer if you missed it or the transcripts online
The Richard Dimbleby Lecture, titled “Facing the Future” as delivered by HRH The Prince of Wales, St James’s Palace State Apartments, London
Yes, it's important to distinguish who is saying what. There is no agreement across the board on either side of the debate.
Sorry, I just don't don't buy the 'total economic collapse in a few years' argument -maybe a decade or two but not a few years.
And I think you have to look globally for the demand picture not just the US (although admittedly the US bats well above it's size in that respect.)
There are huge stimulus packages going into action, the money printing presses are being run overtime, ccountries are looking to diversify out of Dollars and into hard assets in some cases... This is all very bullish for oil.
I think the most likely outcome for the next decade is some forrm of Stagflation: non discretionals up, discretionals falling, economy barely moving in real terms.
The "Age Of Scarcity" is upon us.
Nick.
Note that the previous times that we dipped below the pink band were all in recessions, either in the US/Euro Zone or Asia. From that perspective, it is hard to see whether the production drop is due to reductions in demand based on the economics conditions, or reductions in supply due to geologic conditions.
Of course, if the answer to the question of which band we are in is "yellow", then we will not be able to know until it is far too late to do much good about it.
Actually the technical floor price for the current market is 60.
We would have to bust through this to be in the no worries zone. I'd say 55 is what I would consider a smash. Now I had the fundmental bottom at 65 for a variety of reasons at the moment the market seems to be splitting the difference which is interesting but we should be able to hit 60 in the next few days.
Now from the bigger picture I believe we are at a critical point either we are on a fast collapse path are we are not. Obiviously I disagree with most of the current post thinking we are not going to be impacted by very high oil prices. What's important is to recognize that the market is at a critical cusp over the next several weeks which ever way it goes I think it will determine the price action for the next 12 months at least.
Now as far as the current price decline what's interesting is it's a few weeks early we should have seen this volatile action a few weeks later and we should have hit 75 before seeing a bit of dumping of stored oil. I don't quite know why this price decision started early but it's certainly going to make life interesting since fundamental price pressure upwards is still a few weeks away if it's going to happen.
I have no problem if Im wrong on the direction of the price move however Im quite happy that I've done a good job of predicting when the market would have to choose expensive or cheap oil.
Let's see what the real decision is this is a historic event and will take several weeks to play to completion.
Hi memmel,
Quite a puzzle. When we were consuming 85 mbd it seems that there was a 3 to 5 mbd of spare capacity (or something near that). Now we are consuming around 83 mbd because industrial activity has slumped (for whatever reason). So, the assumption is that spare capacity has increased to 5+ mbd and that is enough to dampen prices into the mid to low $60 range.
Given unrelenting population growth and almost unstoppable increase in Asian comsumption; and given that depletion rates globally will probably decrease this spare capacity number - when does supply fail to match demand even in a slow economy?
Dropping demand from 85 to 83 mbd does not seem to be a huge factor if production rates are dropping 5 to 7 % a year. It seems hard for me to understand how we can muddle along for "decades" as some posters suggest - just because industrial activity is soft. Our BAU model of "happy motoring and all you can eat" seems to keep demand in the range of the low 80s for mbd of consumption - regardless of the economy.
From a novice POV, it would seem that we will see $100+ oil prices in less than 5 years regardless of the economy and industrial activity. Assuming of course BAU and no real leadership to increase significant conservation and efficiency factors (like really using a bicycle or having cars that get 100 mpg or trains that actually move lots of people and material).
Actually its worse than that all my research into the Rust Belt states which have faced the collapsing economy have resulted in the conclusion that bulk of oil usage is driven by the intrinsic infrastructure. This of course can be readily seen by the large differences between US and European oil usage despite the effectively equal standard of living. Decades of infrastructure investment decisions seems to be the guiding factor in the absolute level of oil usage in a given region.
Another fairly easy to find piece of supporting evidence is that oil usage seem to be effectively the same per capita across the US despite large variances in the median income levels. Podunkville Mississippi uses the same amount of oil/gasoline per capita as Los Angeles for the most part.
This suggests that fairly dramatic changes in median income and or increases in oil prices redirecting cash flow to purchasing gasoline can probably be fairly readily absorbed and that the intrinsic infrastructure constraints make it difficult to do much else.
As you recognize the demand changes and even the calculated capacity changes have so far fallen within the same band as depletion. In other words things seem to have probably worked out such that supply and demand are balanced. The price has moved both up and down quite violently to achieve this but surprisingly or probably not supply = demand.
The question of course looms what happens next my above assertion of a fairly constant baseline demand is not inconsistent with a fair amount of discretionary usage. If fact one would expect the potential demand curve to be highly non-linear. In fact the worst guide to the future supply/demand/price curve would be the initial changes. I.e recent events are going to be the least likely to mirror future events.
In fact the discretionary demand itself is tightly coupled to the availability of credit this demand taking to form of house construction luxury goods and big boy toys.
Thus one would actually expect demand to be initially linear with the credit cycle contracting and expanding with credit then being in a sense reinforced as sticky demographic changes like suburban expansion make it difficult for demand to drop below certain levels.
However :)
The future seems to be quite different with structural demand capable of decoupling if you will from the changes in credit availability and becoming closely linked to the cash flow economy. I.e people begin to default en masse on credit yet oil demand remains stubbornly high.
So far this year for the most part oil prices have pretty much tracked the stock market and expectations of recovery i.e the assumption was that oil demand would remain linearly linked to economic expectations most easily expressed in the stock market and currency exchanges. The reason I feel that we are at a historic point is that this coupling is in my opinion going to be broken.
Either the market is well supplied with oil and oil prices will track lower reflection the currently lower demand and the spare capacity in the market.
Remember we have seen oil average in the 40-50 range in the recent past while unemployment was much lower and overall economic level higher. Prices have increased as the economy have by all metrics continued to weaken substantially.
Or as I contend we have probably hit the structural demand level and this is the las t time oil will move in tandem with the stock market/debt economy instead it will move for the most part steadily higher taking a larger and large precentage of the cash flow economy with rising defaults and weakening equity stakes no longer having a significant impact on oil prices.
Now having cautioned against using recent history I will point out after the last bottom in oil prices they doubled within three months. There is a pretty good chance that this might actually be the pattern we see. A strong retraction in prices based on economic fears followed by real world steady oil demand resulting in a strong price increase. Sort of a one step back two step forward pattern.
Once we are past the initial blow off of debt driven demand its not clear at all exactly how oil prices will change except that they should over any reasonable time span say a six month running average track steadily upwards.
Using this metric and a quick check on the futures market six months out shows Jan 10 at 66.87. The recent high was a little over 73 so this relentless increase argument suggests that oil is currently significantly undervalued at the moment.
Farther out of course the futures market is in good agreement with the thesis that oil prices will indeed head relentlessly higher. So the big picture oil market and the thesis that the expectation that demand will remain robust are in good agreement.
Of course this does not fully explain why I think the big one is now i.e when the credit economy and oil decouple and oil becomes coupled to the cash flow economy but
this post is getting a bit long. The basic answer is credit is no longer driving the economy and indeed credit default is actually boosting free cash flow. Thus people that stop paying the credit cards and the mortgage payment and exiting the credit economy are actually now boosting the saving/cash flow economy. This economic transition which actually boosts our ability to buy oil is what I think is happening right now. In fact it explains why the distressed regions of the country continued to exhibit robust demand for oil products even as the credit/lending economy crashed in these regions.
Certainly at some point high oil price would eventually constrain this cash economy but thats not something we face in the very near future.
Supply has continued to equal demand in the first, and most of the second world. There were large areas of the third world last year that were simply priced out of the oil market. These areas have only low consumption levels, but that consumption is critical to their well being. Large populations in parts of Africa went without, and suffered hugely as a result. Oil products, for example, were unobtainable in Zimbabwe, making a dire situation worse.
Sam
I am surprised you did not include the IEA "forcast" deconstruction you created from their global report on the top 800 fields last fall.
i still refer to that chart regularly
It is the most comprehensive bottom up analysis there is, I think, except for the confidential data Matt Simmons has access to
I should, I just need some time to digest it, I have 2 or 3 other forecasts on the back burner also.
Sam - thanks very much for this valuable summary. The chart up top is particularly useful in discriminating between the demand based bau fantasy and the peak oil, what the economy can bare reality.
To my eye Figure 5 has more going for it than Figure 6. The bottom up analyses are nicely alined and I note that the Duncan and Youngquist forecast goes right through the production plateau.
Of the curve fitters, your Loglets are still looking good.
I will send this link to Matt and ask him to try and ensure that Fatih Birol sees this.
€
Hey Sam,
FYI: On your third chart "Crude Oil + Lease Condensate" you have Deffeyes the best at 0.17, but Ace is more accurate at 0.12.
Cheers
Also, the EWG is listed in the tables but doesn't seem to be on the charts.
I chose the oldest forecast with the lowest MASE value.
As always, excellent work, Sam!
Here are some updated forecasts for the EIA's April 2009 IPM actual data release and the STEO.
http://www.eia.doe.gov/ipm/supply.html
http://www.eia.doe.gov/emeu/steo/pub/contents.html
World crude, condensate and oil sands production increased slightly from March to April, from 71.98 mbd to 72.04 mbd. This was due mainly to an increase of 0.12 mbd from OPEC and a smaller than expected decrease from non OPEC of only 0.06 mbd. Significant OPEC increases came from Iran at 0.06 mbd and Nigeria at 0.06 mbd.
Non OPEC production decreased by only 0.06 mbd from March to April due mainly to a bigger than expected increase of 0.23 mbd from Russia, Kazakhstan and Azerbaijan. In contrast, the IEA June 2009 OMR showed a smaller increase of 0.15 mbd, for all liquids from the former Soviet Union.
http://omrpublic.iea.org/omrarchive/11jun09tab.pdf
Other big non OPEC increases from March to April include China at 0.07 mbd and Canada at 0.04 mbd. Conversely, the North Sea showed a large decrease of 0.31 mbd including the decreases of 0.17 mbd from Norway and 0.14 mbd from the UK. US production also fell by 0.04 mbd.
World natural gas liquids production is staying at about 8 mbd even though new projects from Saudi Arabia and Qatar are supposed to increase production above 8 mbd.
For more information about potential sources of future oil production please refer to http://www.theoildrum.com/node/5395
It's also worth noting that the IEA MTOMR June 2009 has significantly downgraded Iraq's forecast of crude oil production as in slides 13 and 14 in this link
http://www.businessinsider.com/iea-oil-report-2009-6#iraq-production-for...
Consequently, my first chart above has also had Iraq's forecast revised downwards.
Thxs for your posting, Ace [Tony],
When combined with Sam's keypost: it seems to strongly indicate that the IEA WEO 2008 forecast, in your first chart, needs to bend down more to more closely match the Peakers' forecasting. The 'gap' between their forecast and real production is getting increasingly embarrassing for them. Or else some wildcatter better get real lucky, real fast, and find four more KSAs pronto, Tonto.
Thanks Ace, do you have a forecast for CC+NGL?
Sam,
It's worth noting that the increase rate in CC+NGL from Jan 2002 to Jun 2004 is greater than the forecast decline rate from Dec 2010 to Dec 2012.
Below is an updated world liquids production forecast, on an annualized basis, to 2012.