| Peak Oil Conference - Barbastro, Spain, May 5, 6, and 7, 2011 | The Oil Drum | Invite to TheOilDrum Community for Guest Posts |
Crude Oil and Liquids Capacity Additions: 2011-2015
Posted by Sam Foucher on April 13, 2011 - 9:39pm
This is a guest post by J. Michael Bodell and myself. Michael is currently an energy consultant operating as Aperio Energy Research. Mr. Bodell is the in-house expert on oil and natural gas market fundamentals for Strategic Energy Research & Capital, LLC, a specialized brokerage and investment firm. He worked for CERA from 2005 to 2007 and was the architect and lead project manager for a two-phase multi-client report, "Diminishing Returns: The Cost of North American Gas Supply in an Unconventional Era," a body of work that evaluated the all-in, full-cycle cost structure of about 275 supply basins. In 2008 as a consultant, he was the lead author on a CERA decision brief research paper, "Natural Gas Yield Curve: A Powerful Tool for Natural Gas Market Analysis." Prior to CERA and SERC, Mr. Bodell was the strategic planning manager for Unocal Midstream & Trade, where he lead a team to perform oil, gas and power market fundamentals and strategy evaluation in underground natural gas storage development.
This analysis is designed to demonstrate why we believe that productive capacity relative to consumption will be sufficiently tight over the next several years to elevate crude prices to the investment cost of the marginal unit, about $100 per barrel. In fact, if annual non-OECD demand continues to grow at 3.5 percent or 1.4 Mb/d per annum, we expect another episode of deficit comparative inventory that will elevate spot prices above this mid-cycle price.
We model expected net global crude oil and liquids capacity
additions from 2011 to 2015 by examining announced and underway
projects and by estimating underlying decline in the extant resource
base. Our modeled volumes do not include natural gas liquid (NGL)
production unless stated otherwise. Also, we provide several scenarios
to account for uncertainty in eventual volumes, on-line schedule and
decline rate.
As
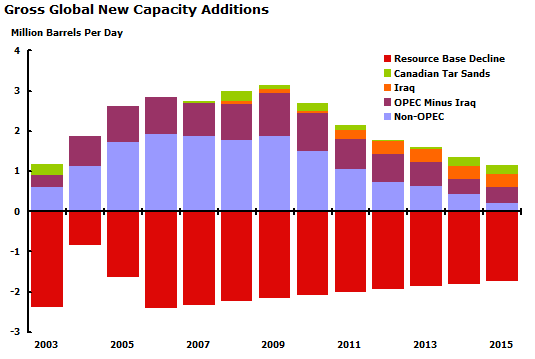
seen in Exhibit 1, average gross new supply additions of 1.0 and 3.0
Mb/d per year have occurred since 2003. But our forecast here has
annual additions moving from 2.2 Mb/d in 2011 to 1.2 Mb/d in 2015. Net
of the annual decline of the underlying world resource base, about 3.6
percent, our forecast shows at loss of productive capacity of 1.8 to
2.2 Mb/d to 2015.
Our 2011-2015 forecast is
based on the open Wikipedia database of more than 380 conventional oil
megaprojects augmented with punctual project information available in
the latest IEA outlook. These new projects have peak flow rates in
excess of 50,000 b/d. The megaproject contribution decreases to below
1.0 Mb/d after 2015, however, this trend has more to do with a paucity
of public information beyond a five-year, line-of-sight horizon.
Based
on available data, it is impossible to make a precise bottom-up
forecast beyond 2015. A naive forecast is possible assuming that
observed past rate of new project additions will be maintained in the
future. Further, we make no assumption about the yet-to-be-found (YTF)
field contribution, which will impact the forecast past 2015. In
summary, our forecasts aim at validating short-term production capacity
additions and are based only on publicly available information
pertaining to oil megaprojects.
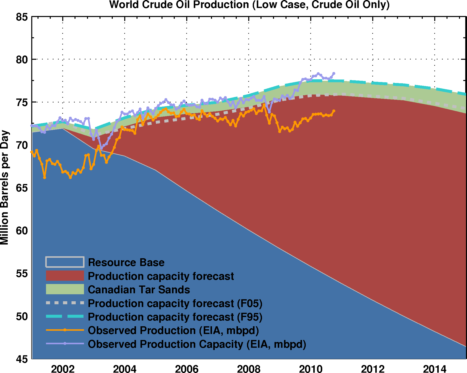
In our low case scenario
(Exhibit 2), world crude oil and liquids production capacity
for conventional crude oil (no NGLs) is likely to be flat for the next
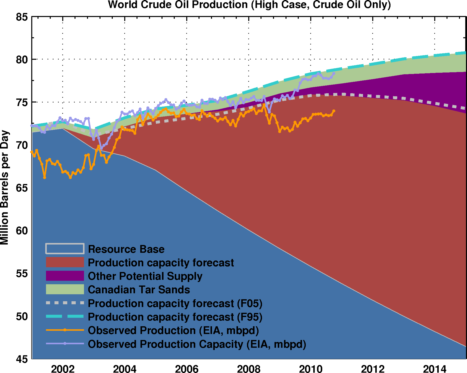
3 years at around 75 ± 1 Mb/d. In our high case scenario (Exhibit 3),
production capacity increases to 77.4 ± 1.0 Mb/d in 2015. This high
case scenario factors in organic production growth from exiting fields
and fields that are not covered by megaprojects. The two main
uncertainties are 1) the pace of production capacity build up for Iraq
and 2) the magnitude of small field contribution in this high price
environment for non-OPEC supply.
| Exhibit 1: Gross new capacity additions per annum from conventional oil megaprojects. The underlying resource base decline is derived from the implied decline rate at 3.6 percent after 2006 that translates into a loss of productive capacity of 1.8 to 2.2 Mb/d per year after 2010. |
 |
| Exhibit 2: Low Case scenario for the world production capacity (conventional oil and Canadian tar sands) is based on the Wikipedia megaproject database. The implied resource base decline rate is 3.6 percent. The F05 forecast represents a low case estimate with a 5 percent probability Monte Carlo simulation of a lower decline rate value. The F95 is the high case estimate with a 95 percent probability of a lower value. |
 |
| Exhibit 3: High Case scenario for the world production capacity (conventional oil and Canadian tar sands). |
 |
Underlying Resource Base Decline Rate
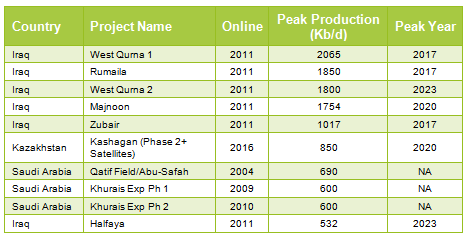
In any bottom-up forecast, probably the most important parameter is proxy for the implied decline rate for what we call the resource base (which includes contribution from fields in production prior to 2003 and small field contributions not qualifying as megaprojects). Considerable uncertainty surrounds this number since it represents a weighted average of tens of thousands of small fields and a few hundred post-peak and ramping-up giant fields.| Table 1: The world’s top 10 conventional megaprojects (volumes in thousand barrels per day, Kb/d). |
 |
In their 2010 outlook, the IEA estimates the asymptotic value of the resource base decline rate to reach 8.35 percent in 2035. In addition, the IEA assumed a linearly increasing decline rate from 3 percent in 2010-2015 to 8.35 percent in 2035. No explanations were given for this choice, but an increasing decline rate value is well supported by empirical evidence derived from field-by-field datasets (Norway and the U.K.).
A field-by-field analysis is possible only for the giant field contribution. A consensus, however, has emerged from recent studies regarding decline for giant fields. For example, CERA (2007), the IEA (2008) and the Uppsala University (2009) forward a production-weighted average decline value for post-peak giant fields of between 5 and 7 percent. Values will be higher for non-OPEC and for offshore fields. Our approach is based on estimating the implied decline rate of the resource base by netting off (i.e., removing) new contributions from oil megaprojects.
In matching our production capacity forecast with available production capacity history for conventional oil, the implied world decline rate for the resource base is between 3.4 and 3.6 percent. This decline range is at the low end of values used in the literature but it is consistent with the short-term decline rate used by the IEA (World Energy Outlook, 2010).
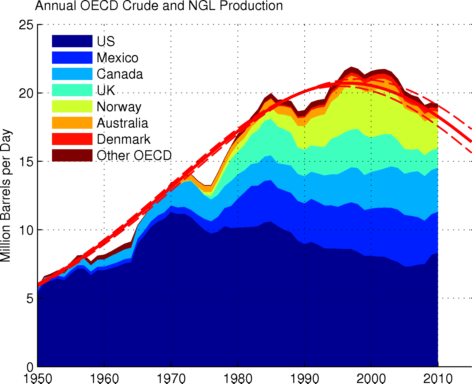
| Exhibit 4: Observed production decline for OECD countries, including NGLs. The red curve is a logistic function fit with an URR at 580 Gb. A near-term high and low modeled valued is provided. |
 |
The IEA estimates that the implied decline rates are about 5.1 percent and 3.9 percent for non-OPEC and OPEC, respectively. Therefore with IEA’s more complete data, a production-weighted average of these two values gives an implied global decline rate of 4.4 percent. As indicated earlier, this aggregate decline rate for the resource base will likely increase in the future as more giant fields enter advanced stages of decline and as offshore resources become a larger proportion of megaprojects.
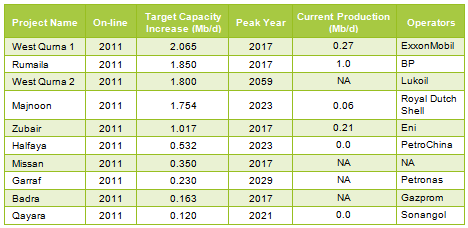
The top 10 largest megaprojects (in terms of flow rate) are shown in Table 1. Most of these projects are located in the Middle East or in the Former Soviet Union. Dominating this list are the new capacity increases on the super-giant Iraqi fields Rumaila and West Qurna. Work on those oilfields began this year and an expected ramp-up to almost 2 Mb/d in production capacity expected by 2016. Considerable uncertainty surrounds the status of Iraq oil infrastructure, and the country’s political stability and security. A detailed Iraq forecast is provided later in this report.
OECD Supply
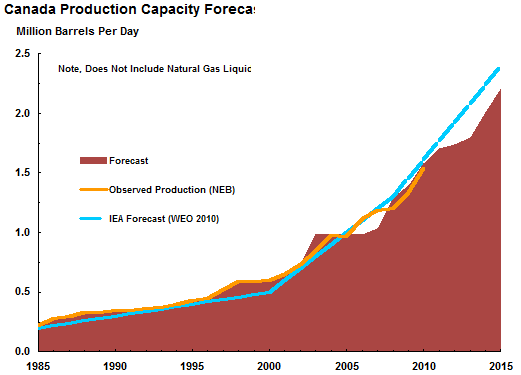
Declining OECD supply is expected to slip below 85 percent of its observed peak production by 2015, as seen in Exhibit 4. OECD output peaked in 1998 following the production decline in the North Sea and then in Mexico. The resources in OECD countries are mature and no conventional oil megaprojects are planned. Most OECD planned projects are offshore at less than 100 million barrels in size and with a peak production below 50 Kb/d. The only large projects expected in the next few years are the Chicontepec expansion (+200 Kb/d) in Mexico and the Jack project (+170 Kb/d) in the U.S.| Exhibit 5: Forecast for the Canadian tar sands production based on the Wikipedia megaproject database. Our forecast is similar to the IEA. |
 |
Since OECD production is quite mature and unconstrained, future output can be estimated with a logistic function curve fitting approach, as seen in Exhibit 4. That analysis gives an ultimate recoverable resource (URR), including NGLs, of approximately 580 Giga-barrels (Gb). Since cumulative production is 370 Gb, remaining reserves appear to be approximately 210 Gb. This estimate is consistent with proven reserves (1P) at 183 Gb at the end of 2009 and 30 Gb (2P) of the Yet-to-be-Developed (YTD) according to the IEA.
Consisting of about 300 fields–two-thirds of which are in North America with an average field size of 50 Mb (mostly offshore fields with double digit decline rates)–the YTD contribution within the OECD is expected to provide only marginal new supplies in the foreseeable future. At best, these new increments will serve to moderate the underlying decline. That established, U.S. supply has actually increased lately, in part stemming from the 20 percent of production coming from marginal or stripper wells that produce less than 100 barrels per day. Further, since 2007, the OECD annual production decline rates have slowed from 4 percent to about 1 to 2 percent in 2009. This trend will likely persist in a high price environment as old fields are reworked.
Yet as a consequence of peak OECD production, the world share of non-OECD supply (crude oil and NGL) increased from 40 percent in 2000 to a near record of about 75 percent for the 2007-2010 period. This contribution is the highest since the 1970s. A decrease in OECD supply and increasing reliance on imports in particular tips the balance of control of global spare capacity to OPEC. In turn, this provides OPEC with considerable influence over global prices through use of their spare capacity.
The only significant non-OPEC new contribution is in unconventional sources, mainly from Canadian tar sands, as seen in Exhibit 5. Visibility on tar sands megaprojects is good (2020) due to the capital-intensive nature of the projects. Observed production has closely followed forecasts. Bakken development will contribute also, but not enough to prevent a decline.
OPEC Outlook
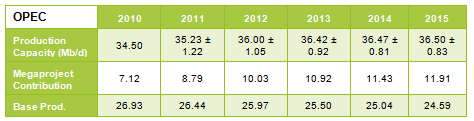
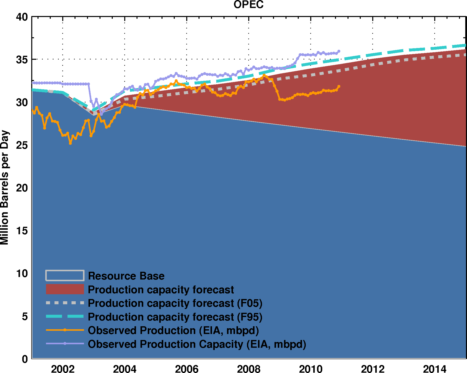
OPEC production capacity (crude oil, condensates) is expected to increase from 34.5 Mb/d in 2010 to above 36 Mb/d in 2012-2015, as shown in Table 2 and Exhibit 6. Nearly half of the 2010-2015 increase of 2 Mb/d in production capacity will originate in Iraq. Considerable uncertainty therefore needs to be attached to that potential volume. Also from the total OPEC volumes, the inferred decline rate for the resource base is between 1.5 and 2.1 percent. That level of decline is consistent with the vast majority of production coming from giant and super-giant fields in plateau production mode, as are OPEC’s large fields. The IEA estimates a higher decline rate of 3.9 percent. In other words, our model is a conservative case.
| Table 2: Forecast for OPEC production capacity (crude oil only) in Mb/d. |
 |
| Exhibit 6: Forecast of OPEC production capacity (conventional oil) based on the Wikipedia megaproject database. The implied resource base decline is 1.6 percent. The F05 forecast is the low case estimate with a 5 percent probability of lower values. The F95 is the high case estimate with a 95 percent probability of lower values. |
 |
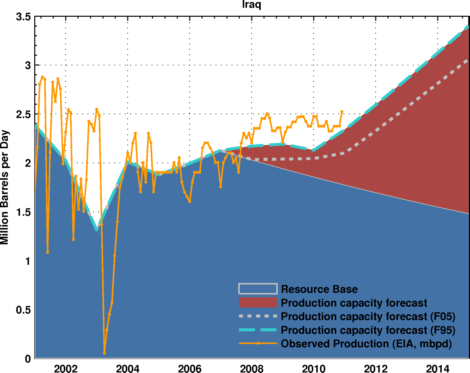
Iraq
Exhibit 7 shows our production outlook from Iraq. In 2010, new contracts equivalent to 10 Mb/d of new capacity were signed with international oil companies (IOCs), as noted in Table 3. While growth is reflected in our projection, a bottleneck, however, on production capacity development is now defined by logistics and other factors (e.g., export infrastructure, rig availability, political and security uncertainty, and potentially corruption).
In their last assessment, the IEA warned that significant investments would be necessary to improve the severely impaired production and service infrastructure. Their forecasts have output reaching only 3.5 Mb/d in 2015 and 6.0 Mb/d in 2025. The EIA is even more pessimistic in their reference scenario with only 2.8 Mb/d in 2017 and 6.1 Mb/d in 2035.
Historically, the largest production build up observed in an OPEC country was a 2.0 Mb/d increase over 5 years. Russia increased capacity by 3.8 Mb/d over ten years. In our modeling, this assessment is equivalent to quadrupling the production ramp-up time. Our low forecast in Table 4 amounts to a steady increase in capacity of between 0.2 and 0.3 Mb/d per year, which is still clearly optimistic.
| Table 3: Results of Iraq Bidding Rounds and IOC winners. |
 |
| Table 4: Forecast for Iraq production capacity (crude oil only) in Mb/d. |
 |
| Exhibit 7: Forecast for Iraq production capacity (conventional) based on the Wikipedia megaproject database. The implied resource decline rate is 4.0 percent. The F05 and F95 forecasts are as in the OPEC case. The IEA forecast is from their Medium Term O&G Markets 2010. |
 |
Saudi Arabia
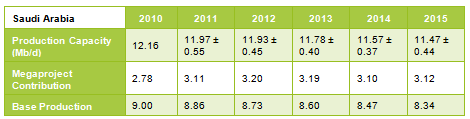
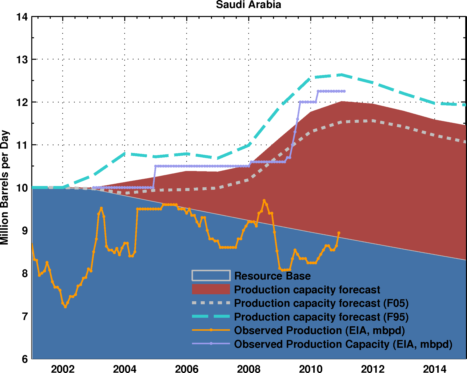
The IEA forecasts a net crude oil capacity addition of 0.43 Mb/d in 2015 with total production capacity reaching 11.7 Mb/d, as seen in Exhibit 8. Saudi Arabia increased its crude oil production capacity by 1.5 Mb/d in 2009 with the completion of the Khurais (1.2 Mb/d) and the Shaybah (0.3 Mb/d) projects. Other projects include Nuayyim (0.1 b/d).The Manifa oilfield redevelopment is expected to contribute 0.95 Mb/d in Arabian Heavy Crude (28 API) and condensates. Discovered in 1957, the field was developed but later mothballed due to the grade of its crude. To get this heavy oil to the market, significant downstream development is necessary. Saudi Aramco plans to build two new refineries, Yanbu and Jubail, of 400,000 b/d capacity each. The Yanbu project, however, was delayed since Conoco-Phillips withdrew from the deal in April. The commissioning of Manifa’s first phase is scheduled for 2013 and project completion is expected in 2015-2016.
Even if oilfield production capacity increases, Saudi Arabia needs to build significant attendant infrastructure (e.g., gas-oil separation plants, crude stabilization and water injection facilities). Yet domestic consumption in Saudi Arabia is currently growing at more 0.2 Mb/d per year. From 2008 to 2009, for example, domestic consumption grew by 9.8 percent (BP Statistical Review). The increase in Saudi use, for example, results in lower net exports.
Our forecast shows a decline in total Saudi production capacity of between 0.2 and 0.6 Mb/d from 2010 to 2015. The details are shown in Table 5. This decline, if it occurs, puts crude oil only production capacity for Saudi Arabia between 11 and 12 Mb/d in 2015, which is consistent with the IEA forecast.| Table 5: Forecast for Saudi Arabia production capacity (crude oil only) in Mb/d. |
 |
| Exhibit 8: Forecast for Saudi Arabia’s production capacity (conventional oil) based on the Wikipedia megaproject database. The implied decline rate for the resource base is 1.8 percent. The F05 forecast is the low case estimate with a 5 percent probability of lower values. The F95 is the high case estimate with a 95 percent probability of lower values. |
 |
Non-OPEC Outlook
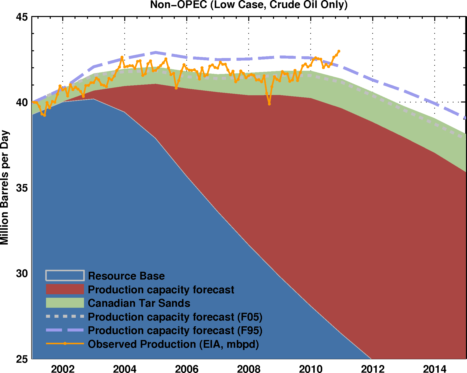
From the megaproject database only, our low case scenario in Exhibit 10 shows that conventional non-OPEC production continues to erode by 0.5 Mb/d per year increasing to 1.0 Mb/d in 2015. The implied decline rate is estimated to be between 5.7 and 6.0 percent. This value is consistent with the IEA estimate of 6.4 percent.
The top ten non-OPEC megaprojects are in Former Soviet Union (Kazakhstan and Azerbaijan) with the Tengiz and Kashagan projects. In Russia, the Vankor field will reach its production plateau in 2011 (0.3 Mb/d). A pure megaproject approach, however, will have shortcomings here mainly because additions will come from smaller fields as we already noted for OECD countries. All non-OPEC supply additions are therefore difficult to track with a bottom-up approach, meaning that despite our best efforts, we may miss a significant new or incremental source volume.
The recent 2009-2010 increase in non-OPEC production can be clearly explained by an increase in upstream investments as a consequence of sustained high oil prices. The IEA raised their outlook by about 1.0 Mb/d for non-OPEC from December 2009. A greater contribution from marginal supply in the U.S. (wells producing less than 100 barrels per day) can be observed. Further, the production decline has slowed notably in Norway and Mexico fields.
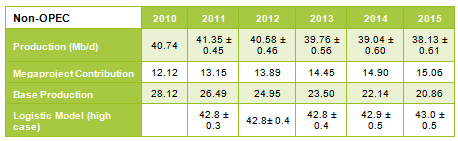
Consequently, we believe that a bottom-up approach for conventional non-OPEC production based on published oil megaproject information may underestimate reserve growth and small field contribution leading to an overly pessimistic outlook. Our high case scenario in Exhibit 11 shows a production plateau for non-OPEC at near 43 Mb/d. This scenario, however, is conditional on a persistent high oil price environment, which is likely given the dynamics in play for the next several years.
The original non-OPEC endowment estimate at yearend 2008 was 1.4 trillion barrels with about 270 Gb of proven reserves (including NGLs). The USGS estimates reserve growth of 160 Gb and 370 Gb of future discoveries (to be realized over the 2009-2025 period). According to the IEA, a significant amount of yet-to-be-discovered reserves (2P) exist, estimated at about 125 Gb of which 38 percent are onshore.
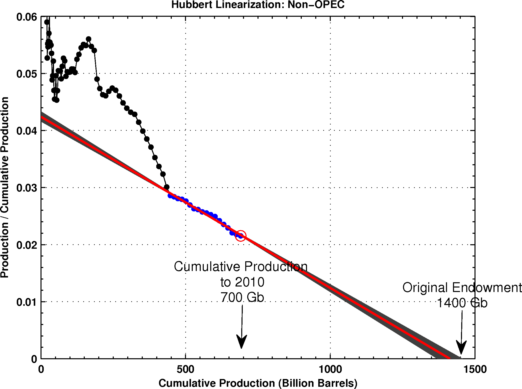
The non-OPEC YTD is in some 1,250 oilfields with an average field size of 100 Mb, many of which are likely associated with marginal flow rates (below 50 Kb/d). The cumulative production for non-OPEC is about 690 billion barrels at the end of 2010, which means that resource depletion is close to 50 percent. A logistic curve fitting approach gives about the same estimate for total recoverable volume as shown on Exhibit 9. The resulting logistic curve gives a significantly less abrupt decline as provided in Table 6 and as illustrated in Exhibit 11. Again, this is from the high case.
Therefore, the total volume unaccounted for by megaprojects is around 76 Gb. We believe the resulting difference in the flow rate projection can be attributed to reserve growth and increase in marginal supply from YTD resources. This then is the basis for the high scenario (Exhibit 11).
| Exhibit 9: Representation of conventional non-OPEC production in a cumulative versus production-cumulative space. The resultant linear fit (pink trend) suggests an URR of approximately 1,400 Gb. The original endowment taking into account proven reserves, reserve growth and future discovery estimates (USGS) points toward the same value. |
 |
| Table 6: Forecast for non-OPEC production capacity (crude oil only). |
 |
| Exhibit 10: Low case scenario for non-OPEC production capacity (conventional oil) based on the Wikipedia megaproject database only. The implied decline rate for the resource base is 5.7 percent. The F05 forecast is the low case with a 5 percent probability of lower values. The F95 is the high case with a 95 percent probability of lower values. |
 |
| Exhibit 11: High case forecast for non-OPEC production capacity (conventional oil) based on the Wikipedia megaproject database only and a logistic-based modeling for unaccounted for small field contributions. The implied base resource decline rate is 5.7 percent. |
 |
Russia
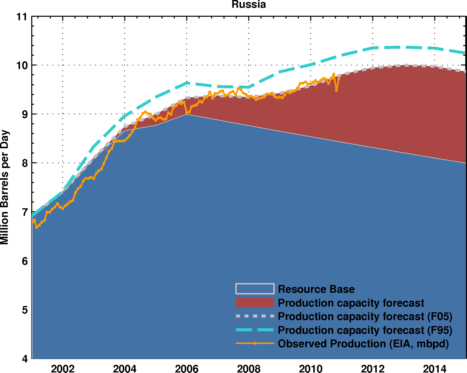
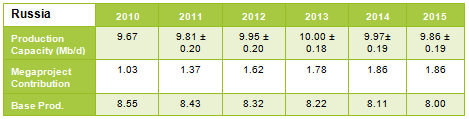
Russia was the top net exporter in 2010 after a slowdown in production in 2008. Given the recent production growth from resources noted earlier, the implied decline rate for the resource base is estimated to be between 1.8 and 2.2 percent. This relatively low decline rate can be in part explained by the high reserve growth observed in Russian oil fields (refer to USGS study from Verma et al.). As seen in Exhibit 12 and Table 7, production capacity could grow by 200 Kb/d per year until 2012 and then a decline is likely after 2013-2014 if no further significant megaprojects come on-line.
| Exhibit 12: Forecast for Russia’s production capacity (conventional oil) based on the Wikipedia megaproject database. The implied decline rate for the resource base is 1.8 percent. |
 |
| Table 7: Estimated production capacity for Russia (crude oil plus condensates only). |
 |
New Production Outlook: 2011-2015
The modeling in this section on global crude supply relies on the open Wikipedia megaprojects database. The work draws on IEA, EIA and USGS databases and reports. Furthermore, the Monte Carlo simulations on decline take advantage of publicly available data and academic research. The intent is to frame reasonable probabilities for near-term production change.
As noted, the data to 2015 is the most robust, while development beyond 2015 holds too much uncertainty save for an educated guess. To be fair, this work is a line-of-sight estimate that may not benefit fully from on-going work in extant fields to increase recovery rates, delays or to produce marginal fields in this high crude price environment. For that reason, we model a low and high case. The high case incorporates incremental supply from the extant resource base.
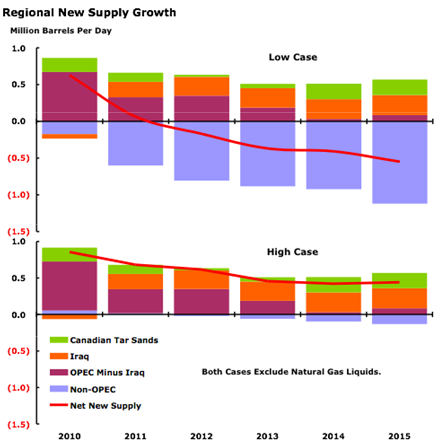
Caveats aside, this work demonstrates that even under the most favorable conditions, a decrease in new resource additions is anticipated through 2014, at least. The overall decrease is shown in Exhibit 13 for both low and high cases. The decrease is a consequence of decline of 3.6 percent to the underlying extant global resource base in the face of modest capacity growth.
According to our modeling, the expected change (mostly decline) in global crude and condensate productive capacity is provided in Table 8. The modeling does not include the considerable NGL contribution expected stemming from massive investments in the last decade in liquefied natural gas. Just within OPEC, NGLs have increased from 4.6 to 5.1 Mb/d from 2009 to 2010 and are expected to move to 5.8 Mb/d in 2011.Nonetheless, in the low case, net global productive capacity additions, after factoring in the decline of the resource base, is expected to drop though 2015 at an increasing pace. In the high case, an insignificant growth is modeled for 2015. Given the annual demand growth rate in the non-OECD of about 1.5 Mb/d, the modeled production growth rate in either case suggests that OPEC spare capacity will be trimmed over this time horizon.
| Table 8: Estimated change in global production capacity (crude oil plus condensates only, no NGLs). |
 |
| Exhibit 13: Estimated change in global production capacity (crude oil plus condensates only). |
 |
Note: this report was produced in December 2010 so the baseline is September 2010 (there is a 3 months lag in the data provided by the EIA Monthly Energy Review). However, I've updated the charts using the last available EIA MER (data up to December 2010).
Contact
- Content: editors at theoildrum dot com
- Tech support: support at theoildrum dot com
License

This work is licensed under a Creative Commons Attribution-Share Alike 3.0 United States License.
What about Brazil and its huge finds?
P – You ask a broad question so I can only offer a broad answer. First, the obvious: those huge deep water oil fields can’t be produced until they are drilled up and put on production. Only a small percentage of the proven reserves are on production and thus there’s little impact on current oil prices.
And that leads to the real issue: how long will it take to get all those new fields producing? In a word: decades. By the time the last half of the fields are producing the first half will be far down their depletion curves. Due to the huge capex, offshore developments are designed to max the production rate…not ultimate recovery. Additional the high cost of operating in DW will result in all the fields being abandoned long before they would be if they were onshore.
A third critical factor regarding how much those huge reserves will aid all us consumers may be more questionable than most think. It’s a bit premature but Brazil seems to be expanding their energy IMPORT capabilities: first ever floating LNG degasification plant, possible ethanol import expansion, etc. Brazil has a large population with many living near the poverty line. So the question develops: if you’re the Bz govt would you export your oil or use it to grow your own economy? Consider that the US is the 3rd largest oil producer in the world yet we don’t export oil because we need it to fuel our economy. How would that be different then the position Bz might take? They aren’t the KSA: they have an economy based upon a lot more than oil exports. In a sense Bz is in the same place the US was after WWII. We used our oil/NG resources to build a very strong economy that that lasted for many decades. Why would we expect Bz to do otherwise? Let’s not forget the obvious: it’s Bz’s oil and they are under no obligation to sell one bbl to anyone. Nothing personal…it’s just business.
Brazil forecast is 4 mb/d by 2020, according to Petrobras CEO.
Brazil doubled its oil production in each of the last two ecades and now the hope to get from a production of around 2 mb/d to around 4 mb/d in the next 10 years.
Can Brazil's rate of consumption also double over the next decade? It hasn't risen as steeply as production in the recent past but that may change.
I share ROCKMAN's perspective. While Brazil might export a little at some point over the next 10 years I expect it won't last long and will be pretty small potatoes. Or perhaps cassavas. ;-)
Jon
Brazil is just going to eat all of its own oil anyway.
Note that Brazil megaprojects are included, I just didn't focus on them.
Sam,
I've recently been looking at Net Export Math both on the upslope and downslope of production/net export peaks, and the math is pretty interesting. The rate of increase in net exports tends to exceed the rate of increase in production on the production upslope, but on the production downslope, of course the rate of decline in net exports tends to exceed the rate of decline in production.
Here are total Global Net Exports (countries with 100,000 bpd or more in net exports in 2005) for 2002, 2005 and 2008:
2002: 39.3 mbpd
2005: 45.8 (+5.1%/year)
2008: 45.1 (-0.5%/year)
The Available Net Export (ANE) trend is also very interesting. Here are 2002, 2005 and 2008 numbers for ANE (Global Net Exports not consumed by Chindia):
2002: 34.8 mbpd
2005: 40.8 (+5.3%/year)
2008: 38.6 (-1.8%/year)
(BP + Minor EIA input)
As noted above, ANE increased at 5.3%/year from 2002 to 2005, but then fell at 1.8%/year from 2005 to 2008. Of course, we saw six straight years of year over year increases in annual oil prices from 2002 to 2008.
If ANE had kept increasing at the 2002 to 2005 rate, then in 2008, ANE would have been 47.8 mbpd, versus the actual volume of 38.6 mbpd, a gap of over 9 mbpd, between what the non-Chindia import market was expecting to see at the 2002 to 2005 rate of increase, versus what was actually delivered.
IMO, this provides pretty strong evidence that the Available Net Export shock to the system was a key trigger for the financial meltdown in the US. I suspect that Available Net Exports will be down to 27 to 30 mbpd range in 2015, unless we see a collapse in demand from the Chindia region.
"...pretty strong evidence that the Available Net Export shock to the system was a key trigger for the financial meltdown in the US. I suspect that Available Net Exports will be down to 27 to 30 mbpd range in 2015, unless we see a collapse in demand from the Chindia region."
Last week we whined and opined about the largely BAU Obama Energy Initiative, and all of the previous such going back to Nixon (Except Carter). To summarize those 150+ posts:
(1) There will be no institutional or political solution to our increasing transportation fuel costs. We are all going to ride along the bumpy peak plateau and are probably now starting down the backside of peak with the consequent rising gasoline/diesel costs. None of the magic pill “solutions” will happen. It is now the time of “too little, too late.” “They” are not going to do anything.
(2) Cheap transportation is the engine of the present U.S. economy. So we will continue BAU for as long as we can make it sputter along.
Therefore the only sensible question is, “What am I going to do in my personal life as conditions continue to deteriorate?”
My hunch is that even “us enlightened folks” here at TOD will continue our personal BAU, adjusting only as conditions force it. And since we will largely understand “why,” without knowing what will happen in which order, we will experience the roller-coaster in slow motion. Wheeeeee!
CapnDaddy
BAU in my nieghborhood:
European-style urban living is available today in some US cities if you can handle a smaller house, on-street parking and having to get along with your neighbors.
Chances are it'll be coming to a city near you in the very near future.
Best Hopes for rediscovering the joys of urban living!
Jon
Well, bless you and yours, Jon. You are way ahead and in better condition to endure the beginning of the downturn than most. My kids are grown and auto-indentured in suburbia, but I'm a writer so I've been working out of home for years. My nearest grocery is a mile's bike ride away. In a good week I burn a gallon of gasoline taking care of all of my chores in one run. I live in an old historic district next to an old downtown. There's a great brew pub three blocks up the street and if I didn't get run over by a train, I could probably crawl home.
But many, and perhaps most, are not well positioned for a downturn, and the present economy and real estate market makes change harder. I feel for them, but I don't think serious change is going to get easier as our society gets poorer.
CapnDaddy
The whole system and infrastructure are delicately balanced on cheap oil, so while you and I for that matter like to bicycle around -- the economy as a whole is deadly focused on oil. None of us are in a good position except for the Amish ;-)
You got that, chief. A society that is getting poorer is less pleasant for all. And as it progresses the Amish will feel it too.
Wow! Do you really still have cheques? That is just so incredibly quaint! Do you still send letters with carrier pigeons as well? (I'm 39 and I've never had a cheque-book!). I believe they were phased out here in the early 90's or something like that... I knew the US banking system was old fashioned... But cheques!!!!!Wow!
The US banking system is not the only thing old fashioned - the banking regulatory system is also old fashioned.
I will get rid of my checks when my personal information in cyberspace is protected as much as my physical security is in real life.
Not only that (privacy), but the merchants take a big hit with those debit and credit cards.
Checks are still "free" to the merchants -- that's one reason why the banks want to get rid of them.
I carry cash for most small purchases -- some ATM machines are still "free".
I will get rid of my checks when my personal information in cyberspace is protected as much as my physical security is in real life.
Right--just pop those bank routing and account numbers in the mail or hand them to a business with marginal security. Nothing makes me feel more secure than having those numbers floating around in real space--right.
We have had issues with nefarious use of electronic check machines in the past. I caught it quickly--the 'writer' was doing $299 withdrawals--I'm guessing the amount was just under some limit that got more bank scrutiny. Telling the bank we'd be closing the account as soon as the theft was dealt with got the person on the phone to immediately turn things around. Our money was then put back in the account pending investigation instead of waiting for the investigation to conclude before it was returned. We never heard another thing about it. It was a weird event-the electronic checks had the name of a local bank that had been bought out by a major over two years earlier--our account and routing numbers had moved between the banks intact. If I hadn't used the web to pull up the visible check I'd never have known that.
All those numbers are floating around cyberspace-using physical checks just adds an extra layer of insecurity as they float around real space. Credit card gives your cash and purchase a layer of separation (unlike debit cards). So far no issues making the transfers between my bank and credit card companies on line. You only give the credit card companies your bank info once on line--you give it to everyone you give a check to every time you use a check. I use money orders for the odd contributions I make--a bit of a hassle but the outfits get none of my personal financial info.
All this has run very far afield--sorry
Thanks Sam and Michael for the most excellent key post!!
Yair...if my "incredibly quaint" system of writting cheques against funds held in reputable banking facility was adhered to by all the delusional #@%heads who don't understand the costs involved with plastic "funny munny" they (and society in general) would not be in so much financial strife...or [shock horror] what's wrong with that old fashioned stuff called cash?
In Sweden we've had a wave of heavyly armed robberies agains money transports. Costs the society loads of money. Last year or so we had the spectacular "Helicopter robbery" onto a high security vault. They just forgot to secure the roof. Learnt that lesson now.
Paper money costs more to deal with, all sums conciered, than digital money. So the development will go towards an allout digital economy. June 1 busses and trains in my province wont accept physical money onboard any more. I don't say I like this, but thats the way things are headed.
Call me cynical--but wouldn't banks have some of the best inside info on how to grab the cash transport. Nice trick get a cut of the robberies and get paper currency discontinued so they can get a cut of every future transaction. Don't imagine that possible angle has garnered much press coverage.
You don't mind if I ask, but where is "here"?
Do not be so enamored by technology. If anything this mindset originated in America and has now spread to the rest of the world, who is emulating and overtaking us.
Think about it - money is not even physical anymore. It's just digits on a screen. It's meaningless. Which means it's susceptible to the whims of bankers.
Is this progress?
Checks are the lowest-overhead form of payment these days. I do on-line checks to pay bills -- for free. When I do an on-line auto-debit, the vendor always wants a few bucks. Mail them a check, and it's free.
I still use checks to pay people -- like repairmen -- who don't have a portable credit machine. It's easier than asking them to bill me. I tend to use cash for this too, if it's not a huge amount. I figure I'll give them the option to keep it out of sight of the taxman if I can.
Banks are looking hard at ramping up debit card fees to match credit cards, or worse. Once you get rid of cash, you have no leverage against usury for spending your own money. Fees have gotten higher even though electronic costs are dropping.
I find it amazing that I still see new bank branches being built on prime corners. All I can figure is they are striving to turn usury banking into savvy real-estate investment. The banks are convenient but there are way too many -- sure it offers choice, but no difference, to the consumer. Each has a branch VP or two and a few clerks, but few customers. The only branches with decent hours are in grocery stores, and those are always busy.
WT
i think you are saying that ANE peaked at the same time as Global Production - 2005
coincidence?
There is also the Bakken, three forks and similar oil shale fields.
http://nextbigfuture.com/2011/01/prediction-of-12-million-barrels-per.html
QuickFrac enables 60+ stages downhole.
http://nextbigfuture.com/2011/04/quickfrac-will-enable-faster-and-more.html
A lot of other Bakken like oilfields in other countries are adopting the methods fracing and multi-stage horizontal oil
http://nextbigfuture.com/2011/01/estimates-of-north-dakotas-oil.html
Canada's oilsands could boom to 5 million barrels per day by 2020. caused by high oil prices in combination with low natural gas prices
http://nextbigfuture.com/2011/04/canadas-oilsands-could-boom-to-5.html
Natural gas reserves up 40% from global shale
http://nextbigfuture.com/2011/04/global-shale-gas-boosts-total.html
Reserves are not production. Estimates are not production. Potential is not production.
Of course, high prices will cause all sorts of exploration and development of previously uneconomic deposits. But the realities of infrastructure, finance, weather, politics, war, natural disasters and all the other "above ground" factors will keep us from reaching what is "possible".
Jon
Your own link lists three potential resources which are being examined, not produced, and the one "in China" isn't described in any detail beyond its listing. Whether any exploratory wells have tapped into the shale formations in the Paris basin isn't explained, either; presumably the 2k wells mentioned are from historic conventional production.
Bakken is contributing nothing beyond compensating for declines in the rest of the US, and fattening up bank accounts of the descendants of sodbusters. Also note the mopping up being done in the Permian basin, which has led to flat production for TX. As the article mentions, reserve growth of this kind in Russia will likely curb their decline, beyond what a megaprojects model would suggest.
All of the megaprojects and analysis listed in the original article was talking mainly about offsetting declines with only some left over for increases in the early years.
North Dakota is likely to increase oil production by 300,000 to 700,000 barrels per day that will make a difference if all else was the same.
The same production methods are being used in Canada's Bakken, Cardium in Alberta, Eagle Ford in Texas etc...
Eagle Ford in Texas is producing about 80,000 barrels per day and could double over the coming year.
http://af.reuters.com/article/energyOilNews/idAFL3E7FB3GY20110411
http://www.rigzone.com/news/article.asp?a_id=105197
Toreador is is drilling in Paris basin.
http://www.toreador.net/images/press/TRGL_PressRelease_01Feb11en.pdf
Georgina oil drilling
http://www.researchviews.com/energy/oilandgas/oil/NewsReport.aspx?Articl...
Plenty of old fields getting revived and new fields being made economic. California, other places in Texas, other countries.
the Oil Drum has been way too low on its predictions for the Bakken and for horizontal multistage drilling
Back in 2008, the analysis was that the Bakken would not get to 250,000 bpd and if it did it would be short lived.
http://www.theoildrum.com/node/3868
It is already about double those projections. (Montana, Sask and North Dakota).
So production is production.
https://www.dmr.nd.gov/ndgs/newsletter/nlsummer2010/The%20Oil%20Potentia...
Bakken in North Dakota produced 85 million barrels in 2010
https://www.dmr.nd.gov/oilgas/stats/2010Formation.pdf
YOY averages for 2005-2010 in PADD 5 + LA wholly cancel out gains from PADD 2. Of course we could tip the scales all day. What's the verb form of "fungible"? I'd like to see these mature regions bounce back from the dead before I get excited much. Also would like a few more years of data from shale oil before being convinced they're any kind of long term solution. MT+ND is about 410 kb/d already so doesn't look like Canada is contributing much to the Bakken either. Those states began with a collective baseline of about 130 kb/d too. Also notice that MT production has declined since hitting a local peak in 2006.
"What's the verb form of "fungible"?"
Fungigate,I think. As in, we are fungigated by our dependence on hydrocarbons, however easy they are to swap around and substitute for each other.
If you take into account the decline rate of new wells, (90% in the first year), and the wells/rig/yr that are being achieved, there is no way to drill enough holes to meet the suggested Bakken outputin the suggested time frame. Also data available so far suggest optimum fracs as about 15-18/well. More fracs might give higher initial rates, but will also result in faster declines. As for water flooding, if it goes beyond a few wells, where does the water come from. Nextbigfuture seems good at inventing numbers, but where is the quantitative analysis? Don't get your hopes up.
A lot of other Bakken like oilfields in other countries are adopting the methods fracing and multi-stage horizontal oil
The Canadian portion of the Bakken, as well as the Bakken-like Pembina Cardium (the biggest non-oil-sands field in Canada) are being treated to fracing and multi-stage horizontals, too, but this does not compensate for the decline in Canadian conventional oil production. I think this would be true of other countries as well.
Canada's oilsands could boom to 5 million barrels per day by 2020. caused by high oil prices in combination with low natural gas prices
The Canadian Association of Petroleum Producers (CAPP) estimates that total Canadian oil production, including oil sands, will rise from 2.72 million bpd in 2009 to 3.88 million bpd in 2020. This is about as good as it could get. The key constraint is labor shortages. There just aren't enough construction workers in Northern Alberta to build the facilities to produce 5 million bpd by 2020.
They could get to 5 million bpd by 2030, assuming prices hold up.
All this speculation about how much fossil fuel we can find in the future ignores the strong possibility that CO2-driven climate change could become the #1 international priority in the next decade. From the science I am reading, things are dire, and action is desperately required. This brouhaha over coal, oil and gas is going to fade into insignificance. It'll be roadkill when the big issue gains traction. Remember I said it.
Mamba - Unfortunately I see matter completely the opposite from you. As we go further down the PO path the world in general (at least the greedy hydrocarbon consumers) will care less about AGW and more about trying to maintain BAU. That expectation is reinforced by the fact that as I type I’m sitting on a drilling rig in S Texas. Just made a nice little NG well (from which I’ll be selling the NG rather cheap). I can also look across the corn field and watch them beginning the construction of the White Stallion coal-fired power plant that will be burning Australian coal. And all this happening just 6 miles from the S Texas nuclear plant. The plant that had a $48 billion expansion suspended after the mishap in Japan (a 20% partner in the project is one of the Japanese utilities). Also cost this county 8,000 jobs.
I just turned 60 yo this morning so no matter how bad the situation gets it won't be a problem for me very long. OTOH I have a 12 yo daughter that will have to deal with it the rest of her life. Would be nice if I was wrong and you were right.But I don’t think so.
Happy Birthday!
Thank you Fuser. About to give my self another present: a second nap so I can drive home this afternoon.
Happy Bday Rockman!
Thanks a lot for all your contributions here.
Rgds
WeekendPeak
I don't think so Rman... We'll probably have another grain killing drought before we hit significant oil scarcity.
As Lester Brown points out: if the Moscow heat wave had of been in Chicago... we've had lost 4x more tonnage than the Russians did. That impact would have vaulted climate change to the forefront.
You could argue that the Russian grain shortfall precipitated the Egyptian revolution. Imagine what would happen if the US did not export grain.
Will - we've been running pretty dry in Texas so far. The cool fronts normally drop a lot of rain but this year they pass thru rather dry.
Congrats Rocky! Hope you enjoy the day.
Unfortunately I think you are right though, although I wish not. Only those who own theur day will worry about the future. When you can hardly get food foryour children, the concern for your great grand children will diminish.
We will get the worst from both climate change and peak oil. What a great future...
We've partied on like it was 1999 enjoying the 'Age of Oil' from landing men on the Moon to splicing DNA. But like all party's, this one will come to a close, and when it does it will be like musical chairs, except instead of chairs it will be the remaining caches of food, and trying to escape increasingly dramatic weather via climate change.
The trouble with humankind is we live for today, pursuing what makes sense in the moment, without considering the implications of our actions on tomorrow. Well, unfortunately tomorrow, which seemed so far away, is now fast approaching. None the less, it was an exciting ride to have lived in 'The Age of Oil'.
Happy Birthday. I too am in my 60's and probably won't have to face too extreme a set of consequences. But I have a grandchild, (right now only one, but I have 3 kids, so who knows), and I certainly worry how he and his family will deal with the future.
Doesn't matter who is right or wrong, peak oil and climate change are related issues and both will happen and both will have very significant consequences. Which one takes precedence in whatever region a person happens to be is a matter (more or less) of geography, society, and politics.
Don
True. Here is an example:
Angola's Xicomba crude exports dry up
According to Wikipedia megaproject database, Xicomba peaked in 2006 at 90,000 b/d.
A 30 000 barrels/day offshore field goes offline since it produces to little to make ends meet. Meanwhile, 20% of US production comes from onshore fields of below 100 b/d.
Am I the only one who gets worried about this?
You don't need a crystal ball or even big numbers to see that the price of finite, non-renewable resources will go up.
True. Then again, TOD has always been famous for its laser-like myopia. It is a rare analysis on this site that bothers to consider anything that happened before the year 2002, and projections out to 2015 can hardly be called a "forecast". It'll be 2015 when I wake up from my afternoon nap.
Thankfully, as you say, the big picture is not all that complicated. For oil production, just keep in mind that the area under the production curve must equal the area under the discovery curve and it's easy to see what shape we're in:
Cheers,
Jerry
How many times have I read the comparison between US and world peak oil production? When did that happen again? Sometime near that year predicted by that hubbard guy.
Honestly, I have little expertise to offer to this discussion, but do wish to say that the biggest elephant in the oil production room is the fraction of GDP already devoted to oil purchases. It can't double.
Why does everybody always leave out the discoveries in 2009 and 2010? For dramatic effect? I believe that in 2010 discoveries were about 50 Gb which is almost a record! If the same happens in 2011 and 2012 that production curve will start to look completely different...
The question is, do you feel lucky? Cornucopians have this innate disregard for the machinations of randomness.
A Monte Carlo draw from a Dispersive Discovery simulation convolved against a simple Oil Shock Model

More where these come from: http://mobjectivist.blogspot.com/2009/12/monte-carlo-of-dispersive-disco...
And doomers have an innate disregard for the possibility of there being future discoveries that they don't know about :-) (Yes, you're by no means the most extreme doomer - ACE still wins that prize hands down).
You got that right, not a doomer but a scientific modeler and by implication a realist.
If somebody suddenly discovered another Ghawar and its contents were able to be added to the world supply, how long, given assumed projected consumption growth and the collapse of marginal production due to uncompetitiveness, would this vast reservoir last the world?
I know this is an impossible question given all the variables, but it would be interesting to hear the speculations.
It does seem that the price of oil is once more having a minute by minute effect on the world's day-to-day economy and the casinos - sorry, markets - are spinning the wheels like things possessed. Interestingly increased unemployment at the bottom seems to be detached in pundit-speak from the growth at the top end of the consumption curve. As long as the rich are prospering everything else is treated like a bit of bad luck and not worth bothering too much about. I suppose it will not be until the diseconomised finally impact by their obliterated buying power on the multinational corporations that anyone will take any notice of the economic polarisations proceeding apace.
U - In a way we may already have another Ghawar developing. But it may also explain why a new "Ghawar" won't have the impact of the original. Perhaps if we add up all the new Deep Water Brazil oil fields, including the ones yet discovered, they'll match Ghawar's URR. But that would be just a numerical match...not the same effect on the global situation. The obvious difference is the development costs since you're producing in thousands of feet of ocean. There is also the timing aspect. It will likely take a couple of decades or longer to bring all that production on line. An onshore would take only a few years. Additionally there is a developing thought that Brazil might not be exporting as much of that new oil as many are expecting. It might make more sense for Bz to use its oil to grow its economy and not that of, lets say, the USA.
Or put another way: an aggregate of smaller fields might, over time, develop Ghawar-sized reserves but it would take a much longer time and a great deal more capex to achieve. And at the moment we are painfully short of both of those commodities.
The commoners are the underlaying fundation for the rich peoples wealth. If I print one billion euros/dollars/yens/whatevers and dump you and the cash on the Moon, it will still be of no use to you. You need underlings to use and even grow your wealth. As the world gets poorer when all the more people are gonna live on all the less resources, the rich are gonna get less rich.
Thanks both of you.
Intersting indeed if the Brazil field is potentially as large as Ghawar, but given the timescale, and the fact that other older fileds continue to deplete it may not in fact add to the aggregate volume of available oil, merely make the 'peak' last longer. But pundits seem to believe all new finds add to total volume and this mantra is mostly the one still popularised.
As for the rich and poor; it's a bit like musical chairs, I seem to think I see the actual economy having a larger and larger number of people simply falling away from the table of goodies as every time the economic cycle pauses for breath the consumers' chairs are one-by-one taken away by the banksters, who it seems dictate politics these days. A bit like depopulation only with the zombie people still there in the background, now only showing up in health and unemployment statistics but otherwise being unimportant and practically invisible to the 'quoted' economy. With only two, right wing, parties in the USA to vote for they are effectively disenfranchised, and it isn't that much better in Europe I sometimes feel.
50 billion barrels in 2010?? You're not including ficticious Iranian and Iraqi reserve additions in this number are you?
The decline rate for existing non-OPEC fields is too high IMO.
If you project out to 2050 you only extract something like
400Gb non-OPEC whereas HL says that the non-OPEC URR is 1400 Gb.
I simply do not believe that significant amounts of oil will be left in the ground.
The megaprojects for OPEC lag non-OPEC and that is a huge problem, especially if these are reduced because of political instability.
I think it says 700Gb is already extracted and that 700Gb remains to be extracted. So if 400Gb is extracted by 2050 that leaves 300Gb to be extracted on a slow tail. Sounds about right.
In HL there is no slow tail, just continuously declining production.
According to the chart at 1100 Gb, the extraction rate is .01 so 11 Gb Non-OPEC per year would be produced or 30 mbpd.
10 years later 9.6 Gb/yr, and 10 years after that 7.8 Gb/yr and 10 years after that 6.4 Gb/yr and 10 years after that 4.0 Gb/yr
and zero after that.
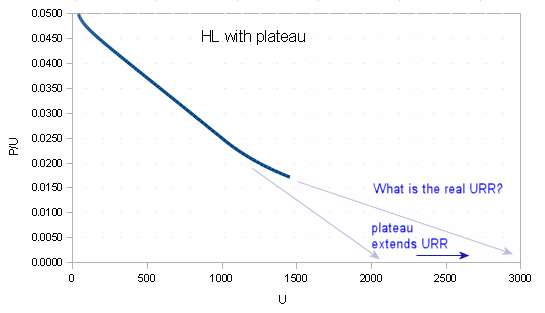
The elephant in the room that hasn't been mentioned is that Hubbert Linearization (HL) may have ceased to work once production has reached a plateau.
When it reaches a plateau, the HL curve starts to flatten out giving the impression that the URR is getting bigger.
Note that the post doesn't flatly state what the URR is for this model of crude oil production.
Is the global URR bigger than 2000 billion barrels? The post doesn't say outright.
Does the post plot a HL on a global scale? No, but it does show one for OECD countries. Why that one and not global?
The longer the plateau extends while the URR is kept at around 2000, the steeper the decline will be once it falls off the plateau.
Now you understand why an updated URR isn't shown and estimates only go up to 2015. Beyond 2015, and with a URR of only 2000 billion barrels, the decline will have to steepen to conserve integrated quantity.
I don't understand the rationale for these kinds of models because they only tell a fraction of the story. I suppose they are useful for getting people to buy into BAU for a bit longer but haven't we been doing that for years already?
You seem mildly skeptical to say the least, I for one would be interested in an article from you where you go through this report and give intelligent critique.
Of course, if the mods let you and if you're willing.
Robert Rapier has a top-level post on HL and discussion of these kinds of problems.
Use something like the Oil Shock Model and you can account for this behavior. Instead of an article I suggest one go to The Oil ConunDrum and check the index.
This is what it starts looking like for an extended plateau:
Rapier's articles on HL:
http://www.theoildrum.com/node/2357
http://www.theoildrum.com/node/2389
And yet, as we previously discussed, Deffeyes, based on HL, appears to have nailed--with his prediction for a peak between 2004 and 2008, most likely in 2005--the recent inflection point in global crude oil production. Deffeyes was really just modeling conventional crude oil production, but he didn't think that slowly rising unconventional production would be sufficient to keep total global crude oil production on an upward slope. As noted below, if global crude oil production had kept increasing at the 3.1%/year rate that we saw from 2002 to 2005, the 2010 production rate would have been 86 mbpd.
The unconventional component is the primary difference, IMO, between global crude oil production in 2005 versus the Lower 48 in 1970 and the North Sea in 1999. Based on the HL models, the conventional URR in each of these regions were about 50% depleted in the referenced years.
But even in the Lower 48 and North Sea case histories, the initial decline rates were fairly low. The initial three year respective decline rates for these two regions were 1.4%/year and 0.9%/year versus 10 year respective decline rates of 3.0%/year and 4.8%/year.
And based on Sam Foucher's HL modeling, in early 2006 we posted this graph of Texas crude production in 1972 lined up with Saudi crude production in 2005 (Texas in black):
http://farm1.static.flickr.com/55/145186318_27a012448e_o.png
Here is the same graph with 2006 to 2010 data added:
http://i1095.photobucket.com/albums/i475/westexas/Slide10.jpg
For what it's worth, IMO it's more likely than not that 2005 will prove to be the final annual Saudi crude oil production peak, but I think that it is extremely unlikely that Saudi Arabia will ever exceed their annual (total liquids) net export rate of 9.1 mbpd.
Interesting item posted by Pollux on Drumbeat:
http://www.theoildrum.com/node/7792#comment-791985
I used the history of IEA spare capacities for Saudi Arabia and compared that with Sadad-al-Husseini's 2007 projection:
2/3/2011
WikiLeaks cable from Riyadh implied Saudis could pump only 9.8 mb/d in 2011
http://www.crudeoilpeak.com/?p=2669
I's worth noting that the various forms of synth crude, be it from working on oil shales or straight Fischer-Tropsch with raw materials and a power source, have a cost. We may have a decree of receding horizons, but eventually the price of making oil becomes cheaper than the price of exploiting smaller and ever harder to reach reserves (the dregs in the bottom of the bottle).
At that point, new oil extraction stops and the production curve trends quickly to zero as old stripper wells give up.
So a HL that develops a hump shouldn't be much of a surprise around the global peak. Its not that the URR increases, just that the snake eats its tail; bringing the day when its not economically viable to drill for the stuff closer and closer the longer the plateau is sustained.
That last paragraph is well said.
HL is what is known as a cheap heuristic. It is quick and dirty and has no guarantee of matching reality. If a hump shows up in the curve, no one knows how to deal with it in terms of the original heuristic because the linearization has stopped working (i.e. the second derivative disappeared on the extended plateau). The rule of thumb for when a heuristic stops working is to shop for another one, or better yet do a more comprehensive analysis.
It would be really nice to see "available for export" added to this analysis.
I've always had doubts about the nameplate figures given for Khurais; has anything similar ever been done on a giant/supergiant field? East Texas had no end of injectors drilled into its flanks too but that didn't yield an additional 1 mb/d overnight. Plus by this stage the historic KSA would have responded to a comparable price surge (as we've seen in the last year) by flooding the market; if Khurais was bona fide fire up North Ghawar too and fill up storage, damp Brent down to something reasonable like $100/bbl. That would pay for whatever projects are in the pipe just fine. Instead we get this bucking bronc for prices on a steady climb up, and $4/gal gasoline in the US. What about all that horse hockey about not wanting to curb demand? It can't all be chalked up to Libya and unrest in the MENA. Can it?
This is one of the most comprehensive posts I have ever seen on the oil drum.
Probably the best ever!!
Yes, it's a great artucle and it's interesting because it's a bit more moderate than some of the stuff we've seen from Jeff Brown in his collab with Foucher from 2007 and that timeframe.
Of course, neither report is very optimistic, but the picture that is emerging here is that of stagnation, rather than an aggressive shortfall(think about Westexas' comment about the Titanic analogy in comparison).
Still, the authors left out NGL's, and we have the prospect of NGV's too, coupled with the recent gas revolution. I'm not going off saying we can forget PO, but this measured report should measure the tone of the conversation too.
Leiten
I agree, but I think NGLs should be dealt with separately and the possibility of vehicles powered by gas.
This post shows the complex global situation where some countries have clearly past peak and will continue to decline in production. Others however are limited by a range of above ground factors such as wars in Libya, Iraq, and Nigeria etc.
Rogue governments expelling oil companies such as Venezuela and Russia are all factors which will limit global production and make firm prediction impossible.
I believe this post shows the best possible range of outcomes given all the variables.
NGLs are important component of liquid fuels.
Natural gas liquids are sent to the refinery to make gasoline, they have no other purpose. I don't think they can readily be used to make diesel.
In the US half of refinery product is gasoline and one quarter is diesel.
In Europe 2/3 of refinery products are diesel and 1/4 is gasoline.
In OECD Asia 1/3 of refinery products is gasoline and 40% is diesel.
I am not sure if I agree with your view on the end use of NGL's. Not that much ends up in the gasoline pool, even in the USA. An interesting presentation is here which discusses US NGL's.
http://www.tudorpickering.com/pdfs/TPH_Midstream_Update_and_Primer_11-14...
Blending of ethanol at 10% vol,will eliminate anything lighter than C5 from the gasoline pool due to vapour pressure reasons. Isobutane is used extensively as alkylation feedstock and as a petrochemical feed to a lesser extent. n-butane is valuable cracker feedstock. C5+ needs upgrading before gasoline blending, and also makes good cracker feedstock. You are quite correct there are real viable options for diesel conversion, although I am sure you will find some obscure process in some research paper if you try hard enough.
Much depends on where the NGL's are produced.
A good presentation.
Silly me.
I think of natural gas liquids such as butane and isopentane as different from liquid (petroleum) gases like ethane and propane but I guess they're all 'liquids'!
Thank you EIA!
About 30% of NGL is butane and pentane and it all goes to the oil refinery. The 70% NGL gases go to make plastics or propane fuel.
Isopentane requires little processing, thus it's called
natural gasoline. Isobutane can be processed into octane thru alkylation and butane is isomerized into isobutane.
There are other valuable products that are made from NGLs like ether but are they more important than transportation fuel?
The point is that NGL which are a growing worldwide as a source
of liquid fuels(though declining in the US) significantly help
gasoline production whereas diesel can only be made from crude oil at the refinery.
If you can make car fuel from something other than only depleting crude you're certainly better off.
Maybe you know of an obscure process to make diesel from NGLs?
I think of natural gas liquids such as butane and isopentane as different from liquid (petroleum) gases like ethane and propane but I guess they're all 'liquids'!
No, except for pentanes plus, they're all gases. They have to be compressed or chilled to get them to liquefy. That's why (except for pentanes plus and limited amounts of butane) they aren't used in gasoline. As Carnot noted, if you use ethanol in gasoline, you can't put in butane because you have to keep the vapor pressure of the gasoline below a certain level, or the fuel systems will vapor-lock.
The cracking unit at a refinery may also produce a lot of butane, more than the refinery can use. If a refinery has an isomerization unit it can convert n-butane into isobutane, and if it has an alkylation unit it can convert isobutane into high-octane hydrocarbons, but this is expensive and more in the interest of improving the anti-knock properties of the gasoline than making use of the butane. Butane has other high-value uses, like lighter fluid, camp stove fuel, and petrochemicals, so the refinery may sell butane rather than buying it.
Ethanol is a pretty good octane enhancer, rendering the alkylation unit somewhat redundant (that's the real, hidden reason why oil companies are promoting it). However, putting ethanol in the fuel requires backing all the butanes and some of the pentanes out of the gasoline mix to keep the vapor pressure down.
I think the EIA's use of NGLs in their definition of "oil" is highly misleading - I suspect deliberately so. I think they are trying to inflate US production statistics so they don't look as bad as they really are, and so it appears US crude oil production decline isn't as steep as it really is.
Butane for raising RVP to 9 in winter is a bit of a red herring.
I was talking about turning butane into octane at the refinery.
You are correct that butane is a gas at 70 degF STP but at 31 degF it is a liquid.
IMO it is nothing like propane which is a gas down to -44 deg F.
At 100 psi at 70 degrees it is a liquid.
It's main use is as a propellant in spray cans where it is a liquid.
Butane is often mixed with propane and sold as LPG fuel (frequently a 60:40 or 70:30 mix). This gives a vaporization temperature intermediate between the boiling points of propane and butane, so it can be used as camping fuel under moderately cold conditions. (Most people don't want to be out camping at temperatures anywhere near the -42C vaporization point of propane.) Also, the canisters don't need to be as rugged and heavy as pure propane bottles.
On an energy basis propane is about as expensive as gasoline;
$2.67 per gallon propane x 34.2/25.3 = $3.62 per gallon as gasoline or 31,573 btu/$.
People should switchover to pellet stoves, pellet furnaces, pellet water heaters. Pellets produce 100,000 btu/$. Pellet stoves do require some electricity(wood stoves do not). You usually only need to feed them once every two days.
The US government still gives a 10% tax credit for the stoves.
"People should switchover to pellet stoves,"
Pellets here are over $200/ton. I hope they are cheaper where you live.
But at 16.4 million BTU per ton, and 3412 BTU/ kw-hr, that's 4806 kw-hr equivalent per ton. So that's 4.2 cents per kw-hr at perfect efficiency. At 70% efficiency for your wood stove, you are now up to 6 cents per kw-hr, which is more than my electric rate. For you they may still make sense.
My heat pump has COP of 2.5, so using that I can pay up to 15 cents per kw-hr to break even. And I still don't have to schlep pellets and ashes.
As emergency backup heat they are a fine idea. I have a trolling motor battery and a 100 watt inverter to run the fans on my fireplace insert in case of an outage. Something similar should be able to keep a pellet stove going overnight too.
In Sweden we have an extensive timber industry that produces large amount of waste saw dust. Pacaking them as pellets alows producers to sell the material for another batch of profit. Thus reducing prices.
As allways we learn from this that replacemnt for fossil fuels are local, and if you don't have that particualar stuff in your area, you don't. There are no global replacement for crude oil.
Of course if your electric has a heavy diesel generating component, costs about 18.5 cents a kwh, heat pumps freeze the ground after a few years or have to deal with long spells of -20F if air sourced you pretty much have to compare pellets to fuel oil. A hundred gallons of #1 diesel (closing in on $5/gal these days), which the most efficient (95%) space heaters require, produces about 13.5 million btus. A good pellet unit runs at about 90% efficiency. So yep we get to pay $295 a ton and have to drive away smiling after all we only have 14000 heating degree days or so a year.
I am contemplating a large (maybe 3000-5000 gallons) hot water reservoir with several solar thermal panels heating the load all the year they can but its not quite up to the drawing board stage just yet.
It is all about definitions and NGL's are generally accepted in the oil industry as C2+, especially in the US. I say generally accepted because there is no rigid defintion, but that is what most in the industry use.
LPG is generally accepted as propane and butane, either as separated gases or mixtures of - not ethane. Ethane is either left in the natural gas or extracted and used as cracker feed.
Again I cannot agree that the C4+ streams all go to the refinery. One of the biggest uses is outside of the refinery as cracker feed for olefines production, even in the US of A.
The C5's in natural gasoline consist of n and iso pentane, and is only part of the composition. I would not recommend operating a vehicle on natural gasoline as it would have a very poor octane. Pentanes are normal isomerised to convert n-pentanes, when used a gasoline component. The RON of n-pentane is only 71.5, whilst the MON is 72.5. Quite a strange result.
Isomerising pentane stream to isopentane boosts the octane to a more respectable 93.2 RON and 90.8 MON.
Again, it is all about definitions and natural gasoline is generally accepted to be a mixture of hydrocarbons from C5-C8 or C9, boiling in the gasoline range. There is no exact definition on the boiling range or cut points. It closely matches light straight run naphtha, which, not surprisingly has a similar composition, and similarly low octane number of around 66 RON and 62 MON.
Here is the Marathon definition:
MARATHON NATURAL GASOLINE C5-C8 (CAS # 68425-31-0) IS A/AN
COMPLEX COMBINATION OF HYDROCARBONS (PREDOMINANTLY C5 THROUGH C8)
SEPARATED AS A LIQUID FROM NATURAL GAS LIQUIDS AND/OR NATURAL GAS
CONDENSATES FROM WHICH ETHANE, PROPANE, BUTANE, AND POSSIBLY PENTANE HAVE BEEN EXTRACTED. IT IS A LIQUID AT ATMOSPHERIC TEMPERATURE AND PRESSURE.
Try this link http://www.mapl.com/msds/msds/201mar001.html
Quite often, if no facilities exist for marketing natural gasoline, it will be spiked back into the crude and sold at crude value.
You forgot GTL, BTL, CTL - all are Fischer Tropsch processes that synthesie very respectable finished products in the middle distillate range - at a cost. Whether this is better than depleting crude oil is debatable. Producing NGL's depletes either a gas or oil reservoir anyway.
I read a while back that in the old days (1940s before a lot of modern refining technology was developed) people ran their cars on natural gasoline(isopentane).
My point was that NGLs are adding to the liquid fuel supply thru the alkylation and isomerization units at the oil refinery which is a fact.
I didn't forget GTL F+T diesel at all but this is a brand new technology which the oil companies don't seem to be pursuing.
In 2003 BP ran a GTL-diesel demostration plant in Nikiski, Alaska which ran until 2009.
http://www.adn.com/2009/09/02/920182/bp-to-wrap-up-nikiski-gas-to-liquid...
It is very interesting that GTL hasn't taken off what with the greater
availability of natural gas. The problem is that the cost of natural gas is still too high and the process is only ~50% efficient.
If world oil supplies decline where will the new diesel come from?
FT has been around for decades. It was invented by the Nazis to solve their fuel problems.
Look at engine technology in the 1920's and it was primitive. Compression rarios were low so that the engines could stand the poor quality fuels. This led to the development of TEL which was doped into the fuel to boost the octane. The rest is history. Alkyation came along in the 1930's but uptake was slow to say the least. It coincided with the first FCC units which were developed about the same time.
FT has never got very far because it is simply to expensive. Add all the costs together and it is just not a viable option. Whether it ever will be is open to debate but I cannot see any way that BTL would work - the logistics would kill it. Time will tell with GTL but my bet is that there will not be another Pearl Project any time soon.
Actually it had to be sold to the Nazis.
Hitler had no interest(German fighting spirit was invincible), but the chemists got Hermann Goring who headed up the Four Year Plan on board.
Hitler was no techno-enthusiast. He thought the V-2 was a waste of money, ' very expensive, long range artillery' like the WWI Paris gun.
It's not really the expensive IMO, but the deeply negative net energy of F+T.
Oil sands, oil shale and ethanol are all slightly positive net energy and natural gas and petroleum refineries are only slightly negative net energy. Methanol from coal is not a F+T and has higher efficiency than F+T.
Drawbacks include the cost of GTL plants and the amount of gas that must be used up in converting gas to a liquid fuel.
from The Anchorage Daily News article linked. Interesting BP used the Nikiski plant as a demo. I'm guessing there was a substantial state grant involved in which the legislature was sold a phony bill of goods. You see Nikiski gets its gas from the very beat up Cook Inlet fields. The fields are so depleted that LNG will have to be imported into the region in the next few years.
Like I said very interesting that Nikiski was used for the demonstration. The oil companies love to tease the state with prospects for using the 35 to 100+ trillion cubic feet of North Slope natural gas they are sitting on, and the companies get any and every tax break and grant Alaska will give them by dangling those little teases out for the legislature to see (usually after the governor's office has already been bought and payed for..er I mean has signed on to the proposals).
Natural gas liquids include ethane, propane, butane, and pentanes plus. Only pentanes plus are useful to the refineries in producing gasoline (but not diesel). The refineries put some butane into gasoline in winter to aid in vaporization, but in summer they reduce the amount as it can cause the fuel systems to vapor-lock. The refineries usually fractionate off the other NGLs and burn them for fuel, or sell them as separate products.
Ethane is usually sold as a component of natural gas. Propane and butane are sold as LPG fuel for heating, and for LPG gas stoves and barbeques. All of them have important uses in the petrochemical industry in making plastics and other products.
"No, except for pentanes plus, they're all gases..."
"Natural gas liquids include ethane..." ...which indeed boils at -89C at 1 bar and would be supercritical at the temperatures down in a well.
LOL, ain't terminology wonderful? (And then there's the British/European "gasoil". No wonder J6P is bewildered by these things.) This reminds me of astrophysicists calling everything beyond helium "metals"...
The definition of oil is getting oily and unctuous.
Actually, I thought it was kind of a gas. But yeah...
OPEC spare capacity is a canard
It does not exist. I am amazed that TOD refers to it after debunking OPEC over and over:
- the reserves
- the shipments
- the projects
TOD I thought you were a voice of informed reason
I would like to see a modified version of this excellent post to include the very probable financial recession/depression that is likely as a result of the shenanigans of the banksters combined with the comatose legislators all across the globe that believe they can spend 2 times or more than they are taking in as revenue from their overtaxed citizens for years without end.
The collapse of lending capacity from the financial decline will almost certainly have a very significant effect on the ability to bring the new crude oil to market (and on time) and also to try to stem the decrease of existing crude oil production.
While these things will result in less crude oil coming to market, they will also result in a drop in demand for crude oil.
Having an analysis which includes the above would give most of us TOD readers a much better view of how the crude oil markets will affect our lives and those of our fellow citizens.
It is a heck of a lot to ask when we are getting for free the benefit of all the time and effort that was expended on producing this information, but we all really do appreciate having all the information made available to us. Thank You!
My 2 cents worth?
WT
your Available Net Exports is the key metric. it is ELM: the next generation
ANE is the bottom line in this whole discussion
what is the global ANE delta? today and five years hence
another way of looking at ANE is global available supply (thats becuase most countries are importers)
that is, supply of the supply/demand equation
Thank you for a very well written and researched post. I very much agree with your comment:
"Consequently, we believe that a bottom-up approach for conventional non-OPEC production based on published oil megaproject information may underestimate reserve growth and small field contribution leading to an overly pessimistic outlook. Our high case scenario in Exhibit 11 shows a production plateau for non-OPEC at near 43 Mb/d. This scenario, however, is conditional on a persistent high oil price environment, which is likely given the dynamics in play for the next several years."
I believe that we can be almost certain that all bottom up predictions have greatly underestimated the reserve growth. I work in the oil field and there are literally thousands of small projects currently being developed around the world. I am willing to bet that even your most optimistic scenario will (once again) prove to be pessimistic.
As your overview of the megaproject contributions shows the contribution from Megaprojects will be growing over the next 5 years and (as you state) beyond that there will be new projects that will provide the growth in production.
Based on the above I am fairly confident that we will see considerable increases in world oil production over the next 5 years following the trend in production from early 2009. Will this increased production be enough to balance demand? That is another question and probably greatly dependent on whether natural gas can be introduced into the transport sector sufficiently quickly.
Sam:
I would be really interested in a post discussing where earlier predictions went wrong (I also think it would be highly informative and educational): "Why did we predict a collapse in oil production?" Something along those lines. Your own post from August 2008 would perhaps be a good starting point?
http://www.theoildrum.com/node/3720
According to the mean and median predictions we should be falling off a cliff! Your ability to explain these earlier "mishaps" might convince me (and other doubters) that the current predictions being presented are any better. Remember: ACE more or less predicted that all oil production in the world would have ceased by now :-) And it just doesn't seem to have done so.... (OK.... OK... he only predicted a drop of some 10 million odd barrels - see Fig. 5 in the previously referenced post).
Thanks,
I think non-OPEC may continue to increase or at least stay at the current level, however we need to watch Russia which has provided the bulk of growth since 2009, I see a flattening again in 2012. If Russia goes south past 2012, well, this is pretty much game over for non-OPEC.
I'm working on an updated version of the post you mentioned, should be finished for May. Conventional crude oil production is still very flat and relatively unresponsive to prices since 2004, that fact in itself remains a source of concerns. I think the current mismatch between demand and supply is here to stay unfortunately, even a flat supply is enough to put our economies in trouble.
Thanks Sam. I very much look forward to the updated post! Will be very interesting to see what has changed over the last couple of years.
I agree with you that it will be important to see how Russsian production develops. However, I'm a bit of an optimist, not only with regard to Russian production, but also with regard to Iraqi and Brazilian production.
Another interesting element will be the demand and the price picture. Just when it looks as if oil prices are going one way they have a tendency to do the opposite. Wouldn't suprise me in the least if we see another drop to 40-60 USD/bbls some time this year. A slight slowdown in demand growth in Asia (particularly China) and perhaps a few bits of optimistic news with regard to Middle East production and the speculators will be driving the price down rather than up. Another issue will obviously be the withdrawal of QE2 in June. Will this lead to a sharp fall in all commodities? Clearly the current volatility in oil prices/commodities is far greater in dollars than in other (more solid!) currencies. So for those of us not living the US prices have not varied by anywhere near as much... Time will show. It will definitely be an interesting year.
Quote: "Wouldn't suprise me in the least if we see another drop to 40-60 USD/bbls some time this year."
This is exactly what Yergin said in the interview: http://online.wsj.com/article/SB1000142405274870371250457623258299008900...
You (and he) forget that many new production sites would shut down and deep sea explorations would come to a standstill. Demand would be greater than production and the crude rice would increase. Thus, if the crude price collapses then there will be an equilibrium but may be higher than what you suggest.
In TOD there was an article last year where a graph showed successive future recessions. At each one, the oil price fell but the minimum was always higher than the previous one because the production cost increases year after year for new discoveries.
I think the current mismatch between demand and supply is here to stay unfortunately, even a flat supply is enough to put our economies in trouble.
http://uk.reuters.com/article/2011/04/12/china-auto-idUKL3E7FC19W20110412
China will sell over 15 million cars this year and over 20 million vehicles.
http://www.bloomberg.com/news/2011-04-08/india-s-march-domestic-motor-ve...
Total sales in India are doing well also.
It is very difficult to see global production meeting this sort of demand increase for very long.
High oil prices will ensure maximum drilling in safe countries, but gives people even more cause to go to war in countries like the Sudan, Nigeria, Libya and Iraq.
If peace prevails in these places than your higher estimates will probably be reached if not the lower estimates will be the reality.
Hi Sam, I will be brief. I think Nordic gave some excellent questions which were not really answered. Your 2008 article was way off, so considering that fact, do you think it is fair to question your forecasting abilities now that you have a new forecast out?
Which forecasts are you talking about?
I have only two:
http://www.theoildrum.com/story/2006/9/3/113719/7594
http://www.theoildrum.com/node/2430
They are not doing that bad compared to others. Note that most agencies make projections up to 2030 but they are revised every year. This is clearly very difficult to make an accurate and static forecast with an old baseline.
Well, we all know the IEA have had a terrible track record, especially if you look at their older forecasts. But to be fair, the forecast linked by Nordic Mist is quite substantially far off and it's only 3 years ago, so it's not a huge amount of time behind. By comparison, ASPO's 2002 forecast is very close to the actual data.
Another issue I have is the mismatch between yours' and Westexas' forecast and this forecast and how much they differ.
There's simply too much of an incongruency for people not to notice.
I don't think anybody is expecting pitchperfect forecasts but do you not think it is fair to notice the vast differences and your track record and be skeptical of your latest round of forecasting?
Again be more specific, are you talking about this chart:
This is not my forecast but an attempt to average a sample of 13 forecasts about CO+NGL, among those 13 only 2 of those forecasts are mine (see the 2 links above). There is a huge disparity in performance among this sample, some are completely off, others seem on track.
Re: Another issue I have is the mismatch between yours' and Westexas' forecast and this forecast and how much they differ.
I guess you are talking about Saudi Arabia? here is a quick comparison below of a few forecasts including the new one (bottom chart). What we did for ASPO was based on observed production including NGL and used a curve fitting approach. Note that some forecasts deal with production capacity, others with observed production (including NGL or not)
The red circle is not Nov 2008 but December 2010.
I told Sam that he was going to face some questions regarding this topic, but to clarify somewhat, Sam did all of the quantitative modeling work on the earlier more conservative projections. He and I discussed various ways to model future net oil exports, and I pushed hard for the logistic method (HL) for the production projections because it was so simple, and relied on the data that we had the most confidence in (annual production and cumulative production to date). Sam elected to use a Monte Carlo analysis for the consumption projections.
So, I suspect what Sam is saying is that if you use different assumptions and different methods, you get different projections, e.g., look at the radically different outlook that Kenneth Deffeyes has (based on HL) versus CERA's projections.
In any case, we coauthored two key papers regarding Saudi Arabia (again with Sam doing the mathematical heavy lifting). The first one used Texas and the Lower 48 as models for Saudi Arabia and the world (based on HL modeling). In that paper, we lined up Texas (in black) in 1972 with Saudi Arabia in 2005. Following is a link to the paper and to the chart, with updated data through 2010. This chart is for crude + condensate. In early 2006, we only had annual production through 2005, and at the time that we did the paper Saudi Arabia had recently shown a very steep increase in production, from 2002 to 2005.
http://www.energybulletin.net/node/16459
Texas and US Lower 48 oil production as a model for Saudi Arabia and the world (May, 2006)
The second paper summarizes the data and projections that I presented at the 2007 ASPO-USA conference in Houston. Sam individually modeled the (2005) top five net oil exporters, and then combined them for an overall top five projection. At the time, we just had annual production data through 2006. The charts below show the actual data through 2006, along with Sam's projections and then the actual data points (circled) for 2007, 2008, and 2009. It appears that 2010 Saudi net oil exports were right around the 2009 level, or just slightly higher.
http://www.energybulletin.net/node/38948
A quantitative assessment of future net oil exports by the top five net oil exporters (January, 2008)
In summary, in my humble opinion, Sam's modeling, using the logistic method, has been quite accurate, but of course it's impossible to prove--absent some kind of confession from a Saudi insider--that the bulk of the post-2005 decline in Saudi production and net exports was involuntary.
And regarding the other (2005) top five net exporters, Russia's production and net exports have been on the very outer edge of his projections, but the overall top five data points fall well within his projections:
Sam, WT, and WHT have all offered valuable analysis at various levels for the future of oil production. The picture is clear, even if the timing of details varies a bit.
Oil production is a function of price. Does it really matter if a prediction is a bit low on production but also low on price? The higher prices of the past few years mean that more marginal and alt production comes on line (which should make economists happy), but all that means is that now we've grown into a higher expectation at higher prices, and whenever the next crash happens it will simply hurt worse.
To me, the interesting aspect is the price at which behavior changes, and so far we've seen an almost-optimal production plateau with rising prices to generate this, and yet changes have been very slight. BAU continues unabated.
Clearly, most of the world expects that production can increase at something close to current price points, and yet all analysis indicates that any increases will be modest and expensive. Behind this is the never-sleeping exhaustion curve as existing fields decline -- we're obviously running faster just to keep up.
I guess what I'm saying is that I think Sam's (and the others') work verifies very nicely based on my expectations, and that the slow-motion train wreck is still happening. I'm a little surprised that the world economies have been as resilient as they have been, but that's not Sam's fault. :) Every model can be improved with experience, and we're seeing that, too. The world is a complicated place, but the reality is pretty straightforward.
I am a bit confused regarding the West Quarna 2 field. In table 1 and 4 respectively they are expekted to peak out at 1.8 million b/d, but in the years 2023 and 2059. Whats about these dates?
Here is the explanation: "In our modeling, this assessment is equivalent to quadrupling the production ramp-up time...", so instead of an expected peak production in 2023, it moves to 2059, the bottleneck being the midstream infrastructure.
Thanks for clearing it out. But then I guess the consequence will be a production curve smoothed out over time, with a lower peak. Burn less, burn longer.
Saudi Arabia produces 9mb/d+-1mb/d if it ever gets above 10mb/d for 12 month or under 8mb/d for 12 months then we have something to talk about. Until then production is a plateau. Speculation on possible production is of little value given the lack of honest input data.
I think that describing Saudi crude production (and especially Saudi total liquids net oil exports) as "plateau" is a bit of a stretch. Texas crude production in 1972 (black) lined up with Saudi crude production in 2005:
Of course, the "why" is a different matter.
Come on. The why part is simple. KSA likes your graph of Texas production, and they are trying to make theirs match up but 33 years in the future. The peak oil thing is a hoax. ;-)
Funny though that they keep talking a very big game. I guess they hope no one is actually checking the books.
The OPEC just released its April report : http://www.opec.org/opec_web/static_files_project/media/downloads/public...
I was quite surprised to see that KSA has only very marginally increased its production in march (+ 57.2 tb/d). Consequently OPEC failed to compensate Lybia's decrease : OPEC production decreased by 626.7 kb/d (and world total production decreased by a similar amount). What game is KSA playing :
- just can't do more ?
- need some time to provide spare production ?
- take the opportunity of Lybia crisis to increase the oil price ? (dangerous game in my views)
I would say option 2, but not sure.
Or maybe their spare capacity is mostly heavy, sour oil that isn’t readily substitutable for lost Libyan production
Most Saudi oil is not nearly the same quality as most Libyan oil. The not-terribly-sophisticated Italian and other European refineries that normally run Libyan oil would probably get half as much diesel fuel out of an equivalent volume of Saudi oil.
Diesel fuel is the primary market product in Europe, so that probably explains their lack of enthusiasm for buying replacement oil from Saudi Arabia.
Kiou,
I have been having the same thoughts and am waiting for the Aramco 2010 reports.
The additions in the past 10 years include
2001 Ghawar Haradh II (300)
2004 Abu Safah (150 more)
2004 Qatif (500)
2006 Ghawar Haradh III (300)
2007 Nuayyim (100)
2008 Abu Hadriyah, Fadhili and Khursaniyah (500)
2009 Khurais (1200)
2013 Manifa (900)
2008 Shaybah (300) total 550
2010 Shaybah (200) total 250
2014 Shaybah (250) total 1000 Reuters 14/12/2010
http://www.reuters.com/article/2010/12/14/us-saudi-ge-shaybah-idUSTRE6BD...
Something has also happened at Harmaliyah. Reports suggest that it has had a GOSP revamp and is producing at 175 kbd,. This is close to Haradh and Hawiyah and is likely to be tied into one of these facilties. JoulesBurn reported activities in 2008, but news has been scant. There was information on installing a gas lift compressor, for oil recovery. This is a light oil similar to Ghawar other fields.
If you total up the capacity that heas been brought on line and that planned then why is SA putting in even more capacity when it supposedly has 12 million b/d and is only producing 9 million b/d. It costs lot to keep these plants idle and in working order. The new gas projects are also in the mega scale size. If these plants come on line then SA will be able to back off crude oil burning, for a time. But this would add to the capacity.
If you toal up the gas projects
Khurais 420 mcf
AFK 560 mcf
Karan 1800 mcf 2011 non associated
Manifa 120 mcf 2013
Wasit 1750 mcf 2014 non associated
You get 5.2 bcf - a lot of gas. This would take the gas capacity up to about 15 bcf/d and releae the best part of 1 million bbls per day of crude. Ad to the gas about 400 kbd of NGL's.
On the demand side...
There was an interesting article in yesterday's WSJ(April 11, 2011) titled, China's Auto's Selling Slowly. What they meant was that March sales were up only 5.4% from last year. However, as there were 18.06 million vehicle sales in 2010, that's a lot of motoring. It's up from 5 million in 2005 and just a million or so in 2000.
If that's 15 million net new vehicles (out of around 19 million) and each vehicle burns one gallon per day on average that's 15 million gallons of net gasoline demand per day. With 42 gallons per barrel that's 357,000 barrels per day. As, however, refiners can only get about half a barrel of gasoline out of a barrel of oil that's net new demand of around 700,000 barrels per day of oil. And then there's next year and the year after...
It's useful to look at some recent trends in oil consumption. The following chart shows normalized oil consumption by the US and four developing countries from 1998 to 2009, with 1998 consumption = 100 (EIA):
Note that while US consumption in 2009 was below our 1998 consumption level, all four developing countries, especially China & India ("Chindia") showed large increases in consumption. Note that annual oil prices rose at an average rate of 20%/year from 1998 to 2008, and at 14%/year from 1998 to 2009.
Here is a chart that shows the ratios of US consumption to production (C/P) for oil, natural gas and coal (EIA):
A 100% line on a C/P chart is the dividing line between net exporter and net importer status. The US is of course the world's largest net oil importer, and we are a large net natural gas importer. Somewhat surprisingly, we are just barely self-sufficient in coal, on a tonnage basis.
If we extrapolate the 2005 to 2009 decline in the US C/P oil ratio, the US would approach zero net oil imports around 2024.
Note that if we extrapolate the the rate of increase in Chindia's combined net oil imports, as a percentage of global net oil exports, they would approach 100% around 2025, when they would consume all global net oil exports (they went from 11% in 2005 to 17% in 2009).
So, these two extrapolations, while troubling for the US and other developed countries, are not inconsistent, but as they say, Somethings gotta give.
We explore some scenarios in this article:
http://www.energybulletin.net/stories/2011-02-21/egypt-classic-case-rapi...
In summary, our work suggests that the US is well on its way to "freedom" from our dependence on foreign sources of oil, just not in the way that most people anticipated. It would appear that the US is being outbid by the developing countries for access to declining volumes of global net oil exports.
Shouldn't Russia's production be dropping to zero after 2012? That is when it will reach 100% of its URR of 172Gb
http://www.theoildrum.com/files/Russia_HL_result.png
As noted up the thread, Russia's production is falling on the outer edge of Sam's updated (HL) projection, but the combined top five are well within his projections. Here are the actual and production, consumption and net exports through 2006 for Russia, Norway, Iran and the UAE along with the projections, with actual data points for 2007, 2008 and 2009 added (circled):
On the production side, when Sam did his updated HL projection in 2007, Russia had shown a 6%/year rate of increase in production (C+C+NGL's), from 2002 to 2006. If their production had continued increasing at this rate, in 2009 they would have produced 11.7 mbpd. Instead, their production has basically stagnated, increasing at less that one percent per year from 2006 to 2009, when they produced 10.0 mbpd (with a slight decline in 2008).
In any case, the wild card in Russia was and is the frontier basins, but the older fields are at an advanced stage of depletion, and when the overall decline does set in, the decline rate could be pretty severe.
Regarding Norway they did talk a year or so ago about some new field developments that would cause a temporary plateau ranging about 2015-2020. If those plans materialise, they may leave the export status some 5 years later. Anyone who knows more about this?
http://www.newsinenglish.no/2011/04/01/statoil-in-significant-new-oil-find/
but also "Norway's Statoil disappointed at Dagny North Sea discovery"
http://www.platts.com/RSSFeedDetailedNews/RSSFeed/Oil/8635098
Alan
No country goes from peak to zero in a couple of years.
This is a detailed analysis by Uppsala University on Russia.
http://www.tsl.uu.se/uhdsg/Publications/Aram_Thesis.pdf
It gives possible decline rates dependent on URR and decline rates of old fields.
The URR range from this thesis is 210 to 310 Gb, with the 210 Gb being the very low end estimate. If the 172 Gb URR estimate had any bearing on reality then Russian oil production would be a third of what it is today in 2020. This is pure nonsense. Russia is not some analogue of the Yibal field in Yemen. If anything its production curve would vary as slowly as that of the US. US production has gone from a peak of about 9.5 Mb/day (C & C) in 1970 to about 5.6 Mb/day in 2010. Yet Russian oil production would supposedly drop *six* times faster.
That URR of 172 Gb is a joke.
A Nine mbpd Shortfall, Between "Expectations" & Reality
One of the interesting aspects of "Net Export Math" that I had been overlooking is that while production is increasing in oil exporting countries, the rate of increase in net exports, in most cases, tends to exceed the rate of increase in production. We just went back and looked at the 2002 to 2005 global data. Here are the 2002 to 2005 global net export data (2005 net exporters with 100,000 bpd or more of net exports, Total Petroleum Liquids):
2002: 39 mbpd
2003: 42
2004: 45
2005: 46
From 2002 to 2005, production by these countries increased at 4.6%/year, but net exports increased at 5.1%/year. At 5.1%/year, global net exports would have increased to about 54 mbpd in 2008, but let's look at what actually happened:
2006: 46 mbpd
2007: 45
2008: 45
2009: 43
Given that the market was "expecting" about a 5%/year rate of increase in net oil exports, I think that the shock of going to a zero rate of increase, and then actual net export declines was quite severe, probably more so than we initially thought. And then we have the so far relentless increase in Chindia's combined net oil imports, increasing from 11% of global net oil exports in 2005 to 17% in 2009.
I think somewhere in the distance Daniel Yergin of CERA is laughing.
He said years ago we would have a bumpy plateau for several years.
He was shouted down by the experts on TOD, and there were many graphs
(web hubble telescope) predicting the apocalypse
I think we now have to say he was right
Of course, as you know, Yergin & CERA thought that the plateau would be a "little" later, some time around 2035 or so, but what's a few decades among friends?
Incidentally, I missed the following interview in 2009, when Yergin was talking about $40 oil. It turns out that the Yergin Indicator* worked again, to-wit, oil prices tend to trade at about twice Yergin's predicted price level, within one to to years of his prediction:
http://paul.kedrosky.com/archives/2009/04/daniel_yergin_o.html
*The most notable example was Yergin's assertion, in 11/04, that oil prices would be back to a long term price level of $38 by 11/05. I therefore defined $38 as one "Yergin."
poly - A one of the premier "experts" on TOD I must disagree. Indeed I'm truly a legend (in my own mind, anyway) around these parts. Since the dawn of time I've advocated the plateau model. In fact, I think I coined PP as a replacement for PO. So unless you want to me to track you down and whoop your butt don't throw me in with the Web's and Darwin's. Dems fightin' words.
OTOH I'm not supporting anything Mr. Yergin has ever proposed. Not that I disagree with such statements but I've no idea what he has ever said...never read any of the man's work. Never needed to since I already knew everything there was to know. A waste of time to try to improve on perfection, ya know.
Actually, I think that a hedge fund primarily devoted to taking contrary positions to what Yergin recommends would have been quite profitable.
Thanks for the props as I am the only analyst that actually created a mathematical model to generate a plateau behavior of oil production. One of these graphs that you refer to describes this plateau and is documented in The Oil ConunDrum. The issue is that you cannot predict how long it will last because we don't know the limits of the extractive potential.
More to the point, Pollytropus, did you actually read this article and note that the author worked for CERA, which is Yergin's firm? Could it be possible that Bodell is friendly with Yergin and didn't want to make him look bad? I don't think anyone here had wanted to say that and thus give him the benefit of the doubt. But since you were the one one who raised the stink ("He was shouted down by the experts on TOD") it gives us an excuse to counter your thinly veiled sarcasm.
Give it another go buddy.
polytropos
Yergin and CERA report said in 2009
The report, called “The Future of Global Oil Supplies: Understanding the Building Blocks,” shows how oil supplies will reach 115 million barrels a day around 2030, up from 92 million barrels today. They will remain at that level through 2050.
http://green.blogs.nytimes.com/2009/11/17/no-peak-in-oil-before-2030-stu...
Yergin is good at telling about the History of Oil but pretty lousy at telling the future.
If you think he is right, why don't you provide a list of the top 10 producing countries in 2030 and their production.
This will be interesting.
Methinks he was being, as Web noted, a wee bit sarcastic.
Hum.. except that his undulating plateau is past 2030 at 120+ mbpd.
Is anyone else having problems in saving this post as a pdf. My computer produces balck blocks for text. Probably my crappy Windows computer. Should have bought an Apple.
I confirm that saving as a PDF doesn't work (same black blocks mentioned above). I'm using PDF XChange Viewer.
Jason
I have had trouble for a long time with the PDF not producing the current version--instead producing some prior version, wirh typos etc. I am not aware that that has been fixed.
Just tried a print to file of this article and all looks ok. Fedora 14, Firefox 3.6.16, Okular.
NAOM
I'm trying to work out if we have a degree of double counting in here.
On the one hand we have OPEC (between 1.5 and 2.1%) and non-OPEC (5.7 and 6.0%) decline rates which are less than others have suggested - leading to typically 2-3Mbpd annual decline rates (vs 4-6Mbpd from elsewhere). That implies a lot of the rework, infill drilling, EOR, and smaller satellite field exploitation is included in that 'base resource' segment to keep the totalised decline rate slow.
On the other hand, we have "logistic-based modeling for unaccounted for small field contributions" which seems to making significant additions to short term supply - doing the wedge trick we are so used to in IEA statements. Non-OPEC seems to be getting 3+Mbpd from these sources by 2015, 5+Mbpd for the global context.
Now while we should expect progressively more and more from smaller and smaller (at higher and higher costs) - are we sure there is no double counting between these areas?
Oh, and while infill, etc. can stave off the decline rates on the old giants for a while, eventually you run out of options and the production falls off a cliff. In essence the techniques tend to shift the production rather than changing the totals. Yet the decline rates look nice and linear in the resource base. Is this physical?