The Record Falls - January 2008 is the New World Record for Crude Oil (plus Condensate) Production
Posted by nate hagens on April 11, 2008 - 9:44am
The EIA’s newest International Petroleum Monthly shows World C+C production for January was 74,466,000 barrels per day, eclipsing the heretofore peak of May 2005 by 168,000 barrels per day. (thanks to Ron Patterson for the heads up and to Khebab for the quick graphics).
")
Fig 1.- World production (EIA data). Blue lines and pentagrams are indicating monthly maximum. Monthly data for CO from the EIA. Annual data for NGPL and Other Liquids from 1980 to 2001 have been upsampled to get monthly estimates. Click to Enlarge.
 and various forecasts (2001-2027)")
World oil production (EIA Monthly) for crude oil + NGL. The median forecast is calculated from 13 models that are predicting a peak before 2020 (Bakhtiari, Smith, Staniford, Loglets, Shock model, GBM, ASPO-[70,58,45], Robelius Low/High, HSM). 95% of the predictions sees a production peak between 2008 and 2010 at 77.5 - 85.0 mbpd (The 95% confidence interval is computed using a bootstrap technique). Click to Enlarge.
Peak oil a hoax? Deffeyes dephazed? Robert Vindicated? Bumpy plateau continues? Oil prices gonna drop like a stone? Totally meaningless datapoint? Pass the Kool-Aid? Discuss.
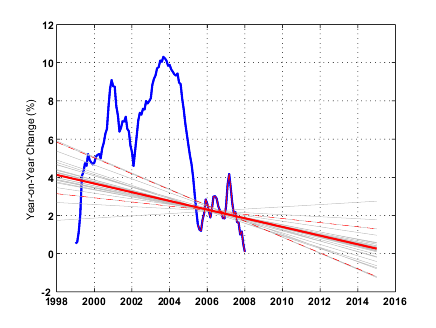
[Update by Khebab]: Despite the good news above, Russia's production plateau is looking more and more like a peak now:
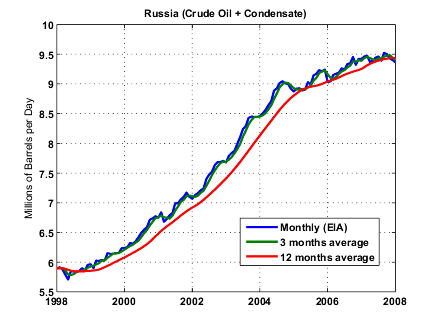
The year-on-year monthly production growth is near zero and reached its lowest point since 1998:
The Record Falls - January 2008 is the New World Record for Crude Oil (plus Condensate) Production
PDF version
367 comments
The Record Falls - January 2008 is the New World Record for Crude Oil (plus Condensate) Production
PDF version
367 comments
Contact
- Content: editors at theoildrum dot com
- Tech support: support at theoildrum dot com
License

This work is licensed under a Creative Commons Attribution-Share Alike 3.0 United States License.
Whew, with oil worries out of the way, it's onto the next problem:
http://news.bbc.co.uk/2/hi/business/7342161.stm
Nonetheless, I doubt anyone here thinks they'll drop like a stone. With the falling dollar, and major producers like Russia becoming stagnant. Only if that new Saudi field (Kuri-whatever) comes on line and gushes oil like Old Faithful will oil prices drop any reasonable amount.
And with declines, only for a short time.
I followed up on several of the mega projects from the wikipedia oil megaprojects list for 2008 put together by
1. Samuel Foucher
2. Stuart Staniford
3. Tony Eriksen
4. Publicus 21:07, 10 December 2007 (UTC)
5. Phil Hart (talk) 06:10, 21 December 2007 (UTC)
http://nextbigfuture.com/2008/04/oil-mega-project-status-saudi-russia.html
Saudi Arabia announced on Thursday, April 10 that they will start adding 500,000 bpd to its total capacity when the Khursaniyah field comes on stream this month [april 2008]. Abdulaziz al-Judaimi, vice president of new business development at Saudi Aramco said, "The Khursaniyah field will start producing within a month [apil 2008] at 300,000 bpd and will eventually add 500,000 bpd to the country's production capacity."
Azerbaijan, and the two petrobras projects appear on track for mid-year.
Horizon (CNRL) for oilsands will be going at 110,000 bpd in Q3 it appears. Suncor Firebag looks to be later in 2008. Suncor overall will probably have an average for the whole year up 25,000-55,000bpd (because Firebag will be a few months late but by year end 350,000 bpd probably up from 240,000 last year)
My link also has an update on the oilsands from presentations made in Jan and Feb of this year.
OIL Projects 100,000 barrels of oil per day or larger, Big to smaller
Country Project Name Company Peak Yr Peak amt bopd
Saudi Arabia AFK Aramco 2009 500,000 [Abu Hadriya;Fadhili;Khursaniyah]
Russia Vankorskoye TNK-BP Rosneft 2017 420,000 bopd towards the end of 2008
Mexico Amatitlan PEMEX 2029 393,000
Saudi Arabia Hawiyah Aramco 2009 318,000 (NGL)
Azerbaijan ACG Phs III BP 260,000 [Q208]
USA Thunder Horse BP 250,000 End of 2008
Canada Cold Lake CNRL 2018 240,000
Nigeria Agbami Chevron 2010 230,000 [first oil Q308, ramped up Q309]
Nigeria Akpo Total 180,000 [Probably early 2009]
Brazil Marlim SM2 P-51 Petrobras 180,000 P-51 On track for mid-2008
Brazil Marlim Leste P-53 Petrobras 180,000 P-53 also on track second half 2008
Russia YK Lukoil 2009 150,000 [ramping up 2008-2009]
Kazakhstan Dunga Maersk 150,000
Canada Firebag; Steepbank Suncor 2010 140,000
Qatar Ras Laffan QP 140,000
Canada Horizon CNRL 135,000
Iran Azadegan P1 NIOC 2012 125,000
Norway Alvheim; Marathon 2009 120,000
Nigeria EA expand Shell 115,000
Iran Darkhovin P2 NIOC 2008 110,000
Brazil ML(FPSO C d Niteroi) Petrobras 100,000
Angola B15 Kizomba C (Mondo) ExxonMobil 100,000
Angola B15 KizC(Saxi;Batuque) ExxonMobil 100,000
And yet the Saudis also announced that their production would not be increasing, and the following news report, citing a Saudi source, shows that their production has fallen back to 9.0 mbpd, from 9.2 mbpd in January. Of course, as always, it's "voluntary."
http://www.gulf-daily-news.com/Story.asp?Article=214240&Sn=BUSI&IssueID=...
It's impressive that so many projects are coming on line in the next two years. But at even a conservative 4.5% decline rate ala Yergin, we need to add approx 8 million bbl/day of liquids through 2009. The above megaprojects list only accounts for about 4 million bbl/day in two years time.
One has to wonder if the Saudis have hit serious decline in Ghawar and are scrambling to add capacity to make up for shortfalls. Of course it's all speculation since their oil data is mostly secret. But if Ghawar were humming and they were adding all this capacity, then would they really keep flat in the face of $112 oil and risk of high prices destroying demand? History says no.
Perhaps a validation of Simmons.
The complete list of megaprojects at the wikipedia [oil megaprojects] is for over 13 million barrels per day added.
Plus there is all of the small 200-25000 barrel per day small wells. Like several hundred in the Bakken to offset the 4.5% decline. Ten of thousands of small rigs.
So it looks like 8-16 million barrels per day to be added net of the decline.
Dream on. . . you lost me at Bakken.
I'm still waiting for an answer regarding the following question:
Note that Saudi Arabia and the world, in 2005, were at the about the same stages of depletion at which Texas and the North Sea respectively peaked in 1972 and 1999 (based on HL).
If the Ghawar complex is in decline, it would appear that every single oil field in the world that has ever produced one mbpd or more of crude oil is in decline.
I'm not arguing that we can't make money finding smaller fields, but I doubt that we can reverse the long term decline, especially given the super giant situation.
In calculating this 8-16 mbd did you account for the fact that many of those megaprojects will not reach the stated peak flows during 2008/2009?
Thanks for calling my attention to the megaprojects list.
http://en.wikipedia.org/wiki/Oil_Megaprojects
If the depletion rate holds at Yergin's 4.5 percent, and if all these projects are on time and reach their production goals you have a net addition of about 5,000,000 bbl/day by end of 2009 through the megaprojects. Do you think small wells will account for 3-11 million barrels per day? Seems like a pretty huge stretch to me.
Taking a closer look at the megaprojects list, though, causes one to feel a little more cautious about making overly optimistic predictions:
1. Saudi Arabia, alone, is slated to add 2.7 million bbl/day in the 2008-2009 period. With Saudi stating it will not increase production and that the market is well supplied, one has to wonder if any of this 'new oil' will see the market as a production gain. Saudi Arabia's secrecy in the oil reserves area also does not inspire confidence.
2. Iraq is slated to add 900,000 bbl/day in the period. Given the current trouble in the country and geopolitical instability resulting in production being shut in, it is possible that Iraq may not deliver.
3. Nigeria is slated to add 610,000 bbl/day. As the country has a history of instability and shut in capacity, I don't know if any added capacity is likely to reach market in a consistent fashion.
4. In all 7.5 million bbl/day of new capacity is supposed to be produced inside of OPEC. As the cartel is acting more effectively as a cartel it may be possible that these barrels won't reach markets for reasons of political self interest.
5. Canadian additions in the megaprojects summary during 2008-2009 are supposed to reach 735,000 bbl/day. Canada is just now beginning to feel the bite of plummeting natural gas supplies. Since Canada relies on synthetic oil/tar sands for new supply gains and such production is slated to involve 10+ percent of the nation's current natural gas supply future reductions in that supply may well have a negative impact on Canada's ability to increase production.
6. Russian additions in the megaprojects summary during the 2008-2009 period are supposed to reach 1.1 million bbl/day. Taking a closer look, Russian production 2007-2008 is flat or declining so one wonders if the 1.1 million bbl/day addition is a realistic figure. Furthermore, it is possible Russia could curtail new projects in favor of higher priced oil. Its strong arm tactics regarding gas supply do not inspire confidence in its commitment to add supply to world markets and place downward pressure on prices. Most analysis supports a price increase bias on the part of the Russians.
Of course it's possible that many of these projects will also experience delays or fail to produce expected amounts of crude. Regardless, given the above list, at least 6.1 million bbl/day of the megaprojects list confront serious geopolitical and other production risk factors. Furthermore, if enhanced recovery is biting as deep into the reserves as some on this site are projecting, the depletion rate may well be beyond Yergin's optimistic 4.5 percent.
In any case, I don't think this new oil is a sure thing by any stretch and a net gain in oil production of 8-16 million bbl/day by end of 2009 seems to be in the realm of a hallucination. I think any gains, if there are real gains, will be fought for tooth and nail and that we will struggle to break 90 million bbl/day in any case. Both above and below ground factors make this a really tough sell.
Good luck with your predictions! I hope you don't have any money riding on it :)
Cheers
Rob
Um, guys? Have you seen the latest IEA OMR?
http://omrpublic.iea.org/
"Global oil supply fell by 100 kb/d in March to 87.3 mb/d, led by lower supplies last month from OPEC, the North Sea and non-OPEC Africa."
This has got to be monumental. The world is scrambling to produce every liquid an engine or generator can burn. Prices are as high or higher than they ever were. Demand is still pushing forward. And the IEA reports a supply backslide?
As for megaprojects -- show me the oil.
Canada has new natural gas discoveries in BC.
http://nextbigfuture.com/2008/04/some-natural-gas-and-oil-plays.html
The Horn River Basin, very little was known about the play until Feb 28, 2008, when Houston-based EOG Resources Inc. said it might have reserves of six trillion cubic feet - the same as Mackenzie Delta, Northwest Territories, and a figure that would increase Canada’s total proved reserves by roughly 10 per cent.
EnCana Corp. of Calgary - which claims the initial discovery of Horn River’s potential - and partner Apache Corp. of Houston may also have 6 trillion cubic feet of gas, Apache said in early February.
Montney natural gas is potentially one of the largest economically viable resource plays in North America, says a report by Raymond James Ltd.
Estimates for gas content in the sandstones, siltstones and shale sequences of the Triassic-aged Montney formation in northeastern British Columbia put the resource size at about 50 trillion cubic feet (tcf) over an area of about 680 square miles (73 billion cubic feet per section). This estimate is near the bottom end of the range of the B.C. government estimates of 30 tcf for the Upper Montney and 50 tcf in the Lower Montney in B.C. alone. the report says.
==
I will adjust my predictions (not speculating quite as much on the smaller production).
2006, 2007 were flat oil production years so roughly 3.5-4 million b/d of megaprojects has gone to offsetting decline. So 3 to 3.5 million b/d is the projected excess from 2008, 2009. So it would be 6-7 million barrels per day to be added net of any decline for the end of 2009 and into 2010 as those new additions scale up. If the increase in large projects also indicates more small projects then say 0.5-1.5 million b/d each year from that increase.
So if we are at 87.3 million b/d Jan 2008.
Then my prediction is a little over 90 million b/d at the end of 2008 (not the full 3.5-5 million b/d increase because of lag in scaling)
For the end of 2009, over 94 million b/d and for the end of 2010, over 97 million b/d.
So, to be clear, you are predicting that world total liquids will (on average) increase by between 300,000 and 400,000 b/d every month from now until the end of 2010?
Hmm, you know I have been posting about oil stuff for quite awhile but I don't recall ever intentionally using the word "play" to describe a prospective reservoir. I always knew what it meant, but it seemed to insider talk for my tastes. So when I see it used, I immediately think about the possibility that AdvancedNano reads too many press briefings or worse, is some sort of shill.
A similar thing occurs when I read about an earthquake. If people read only newspapers, everyone would go around calling it a "temblor". Now I look it up and find it is just Spanish for "earthquake". So these journalists go around and use the word Temblor because they probably secretly want to impress somebody. Or they happen to be a Mexican seismographer.
Play (n): Oil industry jargon for a prospective reservoir. Used by investors to hype something.
I did cut and paste a some of the sentences from the press release on the natural gas discovery. So what. I gathered information (which happened to be company reports and press releases) on over a dozen of the biggest oil projects. It seems likely that if an oil project is going to start producing or is producing this year then the company working on it would have a pretty good sense of it was going to happen. If a company says that they are going to start up a project this month, I would tend to believe them since there is little uncertainty. If they are promising for the next year or later then a lot more can go wrong.
So I added information and research to this oildrum discussion. My website http://nexbigfuture.com you can see that I have almost 2100 articles (43 of which are about oil). You and other here whenever they see any information from a company or from someone who has a position that is positive on any industry or company have a knee jerk reaction ... shill. Which is an assertion without facts.
You parse one or two words in one of serveral 1000 word posts.
Why don't you try to find some information about why particular projects will not happen if you believe your case (as one of the other commenters Robert Marsdon did). Bring some information and research to your position.
Yes my prediction is an average of 225,000 b/d increase in 2008
avg 333,000 b/d increase in 2009
and avg 250,000 b/d increase in 2010.
Overall avg 277,000 b/d from now to the end of 2010.
You are looking at Jan 2008. I indicated that the 300,000 bpd is adding in April so the increase will show when May, 2008 figures are reported in 4 months.
Reported in the Wall Street Journal 14 April 2008:
"...Ukrainian President Viktor Yushchenko said on Tuesday that he had agreed to let Libya grow wheat on 247,000 acres of land in the Ukraine. In exchange, Libya promised to include the former Soviet republic in construction and gas deals.
Brazil recently invited Egypt's minister of commerce to discuss a possible trade deal which would have a strong agriculture component. China also cut its first free-trade deal with a rich country, picking New Zealand, a major food exporter, and is talking about a pact with Australia, another big agricultural producer..."
In the words of a very wise man, "I'll believe that when me sh!t turns purple, and smells like rainbow sherbert!"
Seriously though, I do hope there is one more bump over the next year at least, it's a longshot but every bit counts and the longer we have before the slide, the more (still slim) chance there is that world leaders will choose to confront the problem head on (in ways that don't involve bombs and guns).
Another bump up in production may no help PO arguements (when trying to convince lay people) but it still means more time, and that can't be a bad thing.
The time to act was over 30 years ago. A little bit more time at this point will do nothing to wake up the dead, those who believe that salvation is just around the next corner, the next wilderness area, or off the next shoreline.
I disagree. To my mind, the sooner we cut back on oil consumption, the less precipitous the slide down the backslope of the curve will be. It's unrealistic to think that by allowing more time, consumers & their so-called "leaders" will wake up & make important lifestyle choices. History doesn't support this view. The sooner fossil fuel consumption is curtailed the less oxidized carbon will be in the atmosphere & surface ocean. The more reduced carbon that remains in the ground the better chance ecosystems & the species that comprise them have of adapting, rather than crashing & going extinct.
Word.
But effectively curtailing it requires one essential resource, among many others... time. We need time to build wind turbines and solar panels and even geothermal plants.
We need time to build vehicles that can run on compressed air, or batteries. We need time to build more electrified rail systems. We need time. If the United States takes the initiative and makes the choice to conserve at all costs and begin implementing these strategies, it isn't going to significantly curb world demand, it will just make it easier for China and India to consume more of the oil, and demand will stay relatively flat.
One the other hand, dragging out the plateau gives us more time to get these manufacturing processes implemented with the supply of energy currently available. It doesn't necesarrily take government intervention to start these steps. It takes the action of an influential company to see the coming crisis and begin making the investment in its own infrastructure so that it can become the dominant energy supplier in a few years time.
It is true, however, that using up all of the surplus production to maintain the plateau or even bump it up now with certainly make the slide on the other end alot steeper.
We need more time that is well-spent. IF we end up at the current status quo for another decade, and nothing or little is done, then it will have made no difference. There are efforts afoot, but they are quite small and disorganized. For example, the new Nanosolar (Google) solar panel plant is expected to produce 400MW of panels per year. Assuming it does that, and we had 100 of those plants fully producing today, in ten years we would only produce 40% of our needed electric capacity by then. I've since lost my calculations on that, but I don't even think I calculated that the US averages less than 180 sunny days per year. But if only a few plants are built in the next decade, it will make no difference at all.
Don't forget CSP!
Arclite,
Thanks for your comments! CSP looks like a great technology and I think it will play a big part in our future. I didn't leave it out on purpose, thats an oversight on my part. I think PV panels still have alot of potential in less sunny (less arid) regions because unlike CSP, they can function pretty well with scattered sunlight (i.e. sunlight that has passed through clouds).
I think that you're right that it won't make a very big dent in our current energy landscape. This wikipedia image sums it up pretty well. The sustainables (everything hydro and lower on that chart, though some argument for biomass could be made) represent about 5% of our current energy usage. Say we put in an amazing effort and double the amound of renewables we use. It would then make up only ~9.5% of the energy grid.
But now suppose that the FFs, nuclear, and biomass are taken completly out of the picture. Suddenly, insead of a 5% increase in overall energy supply, we'd have doubled what we would have had if we did nothing.
So yes, compared to our huge, wasteful supply of energy that we now have, alternatives don't look like they do much. But an increase in those alternatives now could make a world of difference later when they are the only thing we've got.
The point I want to stress is that we didn't start nearly soon enough to avert the kind of shortages we're now in for with PO. But better late than never. Anything we can build or change now that will help us post PO should be done with the utmost urgency.
In reference to the wikipedia image listed above, if a similar graph were made of transportation modes in 1900, automobiles would make up a fraction of a percent of overall transportation and airplanes would not even be on the graph. Present usage is not a good indicator of future usage.
Electricity could be made to take on a greater load in supplying energy needs -- domestic, transportation and industrial -- however, electricity is an ephemeral quality and is most efficiently used as it is produced, with production matching load over a large distribution area.
Solar, as a replacement energy technology is problematic, not because of cost or production shortfalls, but because of its intermittency, as mentioned above.
Wind, however, could become the heavy lifter of the future, especially in North America which is blessed with high average windspeeds in the thinly populated center of the continent. At 300 feet up, the wind blows night and day year-round on the Great Plains. North Dakota, alone, could supply half the electricity need of the U.S.
The biggest problem, by far, for wind power development is availability of collector powerlines to gather the energy from the turbines and feed them into the national grid. Powerlines are the electrical homologue to oil refineries: they are absolutely essential but are low in profit making potential and no one wants to build them or have them cross their property. In Minnesota, there is now a theoretical 600 year waiting list to authorize wind farms planned but unable to access existing feeder powerlines.
For windpower to make a break-out, super-regional planning authority is required that would survey and preplan future wind turbine and powerline siting to allow for efficient phased-in development. Federal funding of collector powerlines, as is done now for highways, would provide a huge boost to wind. The resource is there, but without the powerlines it can't be accessed.
The Stanford study on wide-area windpower generation http://news-service.stanford.edu/news/2007/december5/windfarm-120507.html has shown that wind can be a stable, predictable base-load electrical energy source. With wide-area interconnected wind farms, energy storage is unnecessary if production capacity is greater than demand and excess turbines are feathered when not needed. Building more turbines is cheaper and more efficient than trying to store electrical energy.
Windpower could replace all coal, nuclear and about 2/3 of petroleum use. HVAC can be all-electric. (Our permanent home in northern Minnesota and the farm in North Dakota are heated by off-peak electric power.) Linear transportation (rail, light rail, trolley and bus) can be fed off mains electric. Personal isotropic transportation (automobiles) can be stored electric -- not easily or cheaply, but doable.
Industrial isotropic transportation -- farm, construction, sea shipping, trucking -- will continue to need high power density portable fuels. Stored electrical power density is too low to be useful in these situations. For example, a standard field tractor or combine on the Northern Plains would require about 3,000 Kwh of stored energy for a day's work. To put this into perspective, a Tesla electric roadster has a 57 Kwh battery pack weighing 1,000 pounds and costing $20,000. The cost, which would scale up to $1,000,000 for our electric tractor, is less serious than the weight, which would be over 50,000 pounds. For a semi-tractor rig, that weight penalty would be an even greater impediment. This is why biofuel energy development will continue to be necessary.
I cerftainly agree that wind power seems to be the most practical.
As to your EV and electric tractor comments, there may be another option. The main problem I see with EV for normal cars is really all of the gasoline cars on the road now. They can't be easily converted to electric and it will take years and years to replace that infrastructure. Your weight problem with the tractor is also a good point.
A possible (carbon nuetral) solution would be to take H2O and split it (electrolysis) in to H2 + O2 and then use the H2 and CO2 from any source, carbon capture, extraction from air, etc, and use a Sabatier Process to generate methane as auto fuel.
Automobile could then be converted to run on methane, which would be a much easier task than converting the transportation infrastructure over to electric vehicles. This could also be dne much faster if needed.
And of course the problem with this is that it requires a huge amount of power. You have to put in alot of effort to make that methane fuel, but that's just the reality today, isn't it? This methane would serve as an energy carrier, and it wouldn't make sense to use it for electricity generation because you need electricicty to make it in the first place (except in areas that don't have many other energy sources, like the SouthEast US, if it's deemed unfeasible to use transmission lines).
Like I said, the main advantage here is that it would be relatively easy to convert lots of cars over to methane fuel (compared to other options). But you have to build up those wind farms on the plains to get that process going.
This is a good example of loose use of that old "we" word. Unless "we" are one of the very large oil exporters, it will not be "we" who make the initial decisions as to who gets to even bid on ever-diminishing exports. This "above ground factor" is the refuge of fools, demagogues and CERA, but it is absolutely true nonetheless and accounts for a large part of current market prices.
The first decisions are going to be whether exporters can allow foreigners to outbid their own citizens for indigenous hydrobcarbon supplies. The decisions are not as straightforward as they may seem at first blush. Mexico is the best current case in point: Is it two thirds of the government budget or Fx earnings directly from Pemex. Also, Chavoco (a new and quite naughty name for PDVSA) has annlounced that they may not be willing to sell to certain customers at certain times, even if those customers are properly configured to refine and market their output.
You must mean "we" that is weaning itself off hydrocarbons without starving to death or going after the neighbours and their pets. Less and less likely as the box of options gets smaller. Indeed, a world without political leadership on this set of issues is an earthly paradise for fools, demagogues, CERA and especially the profiteers of the Iron Triangle. Maybe Oil Drum could present an Iron Triangle Award to the biggest dinosaur af the year.
Damn, I hadn't thought about the pets.
I'm not sure I want to learn much more about what our brave new world is going look like. There is a subtle transition from being prepared to just being depressed.
I wouldn't count on oil dropping like a stone. The IEA said:
Should be interesting to see what Deffeyes has to say about this. I know, he's actually using a curve fit, not individual data points, but he's been giving the May 2005 as the specific time of peak oil, and he can't do that any more.
EIA haven't shown themselves to be extremely accurate with their initial numbers-it is so close that May 2005 might still be the peak.
I agree, and it may yet be several months or even next year before we know whether this peak month "stands." Included in this month's IPM are two revisions to 2006. When I load my spreadsheet, I can look to see whether the values have increased or decreased.
Using the smoothing technique that Stuart Staniford uses the "peak month" was December 2005 with the shoulder of months on either side being very flat.
Of course, one month does not tell the tale AND if we see month after month of climbing C+C production values each month (more or less) a new record, we will know that the two-and-half years between May 2005 and January 2008 was merely "the pause that refreshes."
Leanan was talkin IEA forecats, BrianT EIA forecasts. These two agencies have disagreed before.
Current opinion from IEA:
- some lowering of oil demand growth for 2008 due to US lead recession: - 0.5 Mbpd from their previous forecast
- regardless, projected demand for 2008 @ 87.2Mpd, up 1.3Mpd from 2007
- supply rising slower than forecast
- so, demand from Asia's growing economies remains strong
- sees that margins remain tight, geopolitical risks notable, prices driven up partly by tight refinery margins
- no supply/demand related big price drops expected
- current price may reflect increasing costs and thus be justified, or then not (really, that's what they in effect are saying)
- on a related note: OPEC anticipates a higher demand increase for 2008 @ c. 2.1 Mbpd
EIA standing
- clear speculative premium in current prices, real demand driven price even down to c. $90/barrel.
- expected average of $100/barrel for 2008
- demand increase 1.2Mbpd for 2008, bulk coming from non-OECD
- expects possible delays in new non-OPEC supply
- US gasoline price will peak at $3.60 during summer, down from there
- tight supply/demand situation driving up oil price (trend)
- speculation driving up price volatility
- upside/downside risks remain for oil price and make it hard to predict accurately
So, currently they are mostly in agreement, but not always. As for price projections going forward, on that EIA has been increasingly off the mark during the last years, but seem to have corrected somewhat late last year and early this year.
Refs:
http://www.guardian.co.uk/feedarticle?id=7454433
http://online.wsj.com/article/SB120792207645407921.html?mod=googlenews_wsj
http://omrpublic.iea.org/currentissues/full.pdf
http://www.cattlenetwork.com/content.asp?contentid=211559
http://blogs.wsj.com/environmentalcapital/2008/04/09/running-with-the-bu...
http://ap.google.com/article/ALeqM5jkPHIIfviqYN5x89eQb16MYtMNdgD8VTNLK00
First, when they say that "demand is lower",
the only correct interpretation is that "growth in demand is
lower."
Second, heating oil is at it's lowest inventory point since
1993. H/T CNBC.
Third, can the IEA really get w/in 178 000 on a 74 000 000
number?
740 000 is 1%. 178 000 is slightly more than .02%.
Rigid scientific experiments would kill to get an accuracy
rate like that.
178,000 is 0.2% not 0.02%. Its fifth part of percent, not fifyth, but you are right, even with this 0.2% its one part in 500, not think they are that accurate especially when some oil producing areas are under war (nigeria, iraq etc).
Hello TODers,
If I may add a bit more to the accuracy debate: How many more wells providing C+C have been added from 2005 to now? I have no idea--100,000? 200,000? 300,000 if we count all the old horsehead pumpjacks restarted to extract oil-stained brine? The larger the database, the harder it is to get the truly accurate and time-dependent numbers for summation; this new C+C high is mathematically-bound to be less accurate than the 2005 data. Thus, IMO, this recent single measurement basically means the 2005 record still stands if one mentally adds error bars to this latest number.
I think it would be interesting for the reporting orgs to detail how much the reporting accuracy has gone down, or else what expensive data-collection steps they have taken to keep the accuracy level the same. My feeble two cents.
Of course, if C+C goes higher in each report for the next year or two, and net exports goes higher too, then I would agree that the 2005 number was premature. But TODer Ace's report [bottom of yesterday's DB] seems to indicate otherwise, plus the excellent statistical work done by Khebab, then detailed by WT.
EDIT: plus a big kudo to Darwinian and any other hard-working, much-admired data-freaks I overlooked at all the other TOD regional chapters.
Bob Shaw in Phx,Az Are Humans Smarter than Yeast?
Thank you for the correction.
I practice close math. ;}
And i humbly think I understand Pakistan better now.
Leanan,
Wouldn't Peak depend on how, or why, the oil outflow is being produced? the figures from 2005 only produce one month over 85 gazoolian barrels yet the next two years which produce visibly less than that year each have 3 months higher than 85. While the previous four months including Jan 2008 have figures over 85, the pressure from the faltering economy could be responsible, much like someone jumping on a garden hose, a temporary spurt. Is the present increase sustainable?
The plateau is bumpy at fine scale. May '05 wasn't THE peak, & this January may not be either. Over time, the bumps smooth out. Doesn't change the fact that we're peaking out & the downslope impends. The impression that production can be cranked up to meet demand just promotes business as usual. The longer the slide is delayed, the steeper the downslope is going to be.
And along similar lines, what does the 'peak number' really signify other than a source of great debate? Taking into account random error, measurement error, human error, etc.. I'm skeptical that these 'peak' values are even different numbers. As a data analyst in the pharmaceutical industry, I'm continually amazed at the variability observed even in tightly controlled quality control labs. Gathering consistent and reliable data is extremely difficult.
I agree with you. I've stated this here before, but my wife is a data analyst for a natural gas field service company. The data loggers connected to wellhead & pipeline meters transmit data directly to the computer (there are no "meter readers" anymore Leanan). In any given month, between 20 & 30% of the meters (or data loggers or transmitters) are malfunctioning. The job of the analysts is to report the malfunctioning meters to service techs, and to "guesstimate" the amount of gas flowthru for which they have faulty or no data. They do this by averaging flowthru for the meter over previous months, or by substituting data from a similar meter that's currently working. How accurate this "made up" data is is anyone's guess. I agree with you that this new "peak" blip in global crude production is likely well within the margin of measurement error.
Especially as demand increases in FF producing countries and they reduce exports for domestic use.
Another bump on the plateau — meaningless.
Indeed just another bump...a bit of spare capacity in saudi arabia, blowing gas caps in north sea and the help of Angola. And during that time, Russia passed from a daily production of about 1333/1335 th tons (february/march) to 1323 in a few weeks. See http://www.riatec.ru/en/shownews.php?id=37182&sha=1&sfa=1&RiatecSess=1d7... for daily production figures. Which means about 1 percent in a month... Is Russia about to loose same production as Saudi arabia did in 2006? Time will tell but if yes, the bump of this winter was the real peak...
That's right. We're waiting for a trend not an isolated data point.
Yeah people, that's right. 'We're waiting for a trend, not an isolated data point' - unless of course the isolated data point in question could have been (and was) interpreted as 'Peak in 2005', in which case it was OK to scream 'Head for the hills!'
Now that's been contradicted, it's time to start questioning the evidence. 'Measurement errors', is it ... which, mysteriously, only apply now but didn't apply in 2005. Funny, eh.
Oh wait, I guess I must be in Peak Oil denial or something.
You people would be funny if you weren't turning into prime evidence of the thing you always complain about - the intractable stupidity of the human race. (oh, that and having kids, especially if the parent in question is black or yellow or something).
They did question it in May 2005. That's what happens when figures are new and recent.
But almost three years later, they're more sure the figures are right.
So in March 2011 you can come back and see if they're still questioning the figures of April 2008 :)
No wonder prices are so low. :<)
I just gave a presentation this week to the league of women's voters which included a slide on peak oil. Talked about 2005 as maybe the peak. What will happen when they find out about this?
It might make sense to place more emphasis on peak per capita than total peak. Anyway, no one on this site fails to qualify that we won't really know the peak until it is way beyond the rear view mirror.
Talked about 2005 as maybe the peak. What will happen when they find out about this?
Nothing if you gave them enough info and they have brains. Suggestion: don't say we peaked in 2005, say "the current peak." Then show them a graph of the production and how flat it is and explain the bumpy plateau. Then show them all the oil coming on-line this and next year while also showing them the dearth of new oil after 2012 or so.
Cheers
I didn't say it was necessarily the final peak; I told them that there is controversy with others saying the peak could be as much as a decade or more away. I did,however,say, it might be the peak but time would only tell. But people don't always retain all the subtleties. So this, like Bakken, could create problems for those who are trying to educate people about peak oil.
Well, the question looms: Are we smarter than yeast? Before I read Diamond's Guns, Germs and Steel I had already theorized humanity must logically be getting more stupid. We are interrupting natural selection, right? Everyone survives, so there is no winnowing of those with low intelligence, poor insight, lacking common sense, etc. We may "know" more, that is, have more data to hand, overall we must be getting dumber.
Perhaps we are dumbing ourselves into extinction.
Unintended consequences.
Cheers
Great book indeed you cited, very important if you want to understand the history of civilization. But I disagree with your point that intelligence is just a matter of gene selection. What it counts now that we are civilized is the intelligence of the whole community and not only that of the single individual. Collective intelligence is more a matter of "meme" selection, i.e. the spread of successful ideas and concepts. And I feel that this blog has succeeded in creating very lively and useful memes.
Aceroni,
First, I didn't say intelligence is only genetic. There is a lot of anecdotal evidence of lowered intelligence. TV viewing rates, drop-out rates, voting rates, who gets voted into office, how easily the populace is duped into accepting/participating in horrific events, etc. Diamond's example of friends who retained such detailed knowledge of their environment is a great example of how we even fail to test intelligence in a meaningful way. How stupid is it, for example, to test intelligence only by what is learned in school?
Meme? You are equating meme with intelligence?
Given the above, one can define a meme as data or behavior far better than as intelligence. Cultural actions/beliefs, etc. are not examples of intelligence, though they may be expressions of it, to a degree.
This is simple logic: if all persons are allowed to survive, then those poorly adapted are surviving and procreating. The average and the mean must fall if we assume intelligence is a positively selected trait, i.e. generally leads to a greater chance of survival.
Cheers
Our brain has not changed that much from when the first homo sapiens has appeared. A nuclear scientist and an hunter-gatherer living in the amazon forest are sharing basically the same cognitive capacities. So which of the two is more intelligent?
I am pretty sure that a nuclear scientist put in the amazon forest has pretty low chance of survive but the chances of an hunter-gatherer to design a power plant are even lower, he probably doesn't even have the word for it.
If you measure the intelligence with QI tests the nuclear scientist would score probably 100 points more than the poor guy, which wouldn't even understand what he has to do. But QI tests measure only how good you are in doing QI tests. I agree that scholastic systems are putting less selective pressure in the individuals, that are moving much faster through high school and university, but there is also a much larger number of PhDs out there now than ever before.
Anyway measuring the capability of a single individual is a pretty worthless exercise. No single individual, not even the more knowledgeable, would ever be able to produce from first principle (just raw materials) anything more than a stick with a stone attached to it. What we are looking at is the capabilities of the entire civilization that individuals are forming. The current global civilization is able to create fusion reactors and space carriers, and this is because we have accumulated and selected memes from when we started talking to each other.
As the first definition you are posting is saying, a meme is also an idea and a concept. It's true that beliefs are strong memes, but even "Peak oil" is a meme, or quantum mechanics. And internet is helping propagation and selection of ideas at a much faster pace. Look for example at the global scientific output compared to 10 years ago.
In fact, this belief give me hope for the downward slope. Because if you compare the pre- and post-oil societies the difference in accumulated knowledge is huge and therefore the capability of solving problems at the global scale. If oil has done anything this is to allow us to produce knowledge and infrastructures that we can reuse to, for example, produce renewable energy based power plants.
This I doubt very much, but I wasn't comparing us to spear throwing people. A pretty high percentage of people died early even just decades ago, let alone hundreds of years.
You've offered nothing to refute the proposition except to say that the amount and kind of knowledge we have has changed. You don't need a high level of intelligence along the general population for that.
May god save us from yet another fad... memes... crikey...
Cheers
So would you provide evidence for selective pressure to your definition of intelligence (which is?) in the last centuries? Most of the people died anyway for infections or malnutrition, and neither bacteria nor famines are looking to much at the cognitive capabilities. The spread of human genes in civilized countries is mostly governed by the simple fact of reaching the mating age. Don't tell me that at roman times the smartest where mating more than the normal peasants.
Anyway, I am just telling you .. it doesn't matter. Single individual's intelligence is not affecting too much the collective intelligence of the population. But you can't get this point.
P.S> Franz is not me, I am not a troll.
We spent about 99% of our evolutionary history as hunter-gatherers. Our brains were our primary tool for survival. The smartest survived. Our brains had to change dramatically from when we first became non-arboreal upright walking animals until the end of our hunter-gathering days. But it has likely changed very little since then.
In times of plenty natural selection loses much of its grip. Today, when almost everyone survives to reproductive age, the most prolific reproducers will be the ones whose offspring will be dominate the population. And those prolific reproducers are not likely to be the smartest members of the population. Therefore, as long as this situation continues, the average intelligence of the population will decline.
Anyway, this very short YouTube video explains it all.
http://www.youtube.com/watch?v=upyewL0oaWA&e/
Ron Patterson
I *can't* get the point? Arrogant a bit, are we? More like, I think you are wrong. That is, we disagree. Your high level of "accomplishment" can be argued to be rather stupid in the face of overshoot/depletion, no? Further, it can also be argued to be nothing more than building incrementally on what came before.
No. My contention is based in logic. It is neither provable nor unprovable, in any case. You can philosophize about it all you wish, but the logic makes sense to me. If it doesn't to you, so be it.
However, just for shits and giggles: war. One could argue the least able (intlligent) are in the lowest ranks and the most likely to die. Accidents: The least able (intelligent) are most likely to be doing the dangerous manual labor, thus most likely to die. Etc., etc. So, the dumb are dying. Yay! Except that population is increasing far faster than people are dying, so, relative to the past, more of us dummies are escaping Death and his bony grip.
Anecdotal: Dumbya remains president; large numbers of Americans still think Saddam had something to do with 9/11; after many hundreds of years and all this development, the 1/5/20/80 ratio still applies to wealth and income distribution; television, etc. I mean, how dumb do you have to be?
On a more serious note, it is a fact that watching TV has negative effects on cognitive development. The average American, for example, watches something like 4 hours a day. Back in the day, kids played and/or worked, both of which increased intelligence.
Ron's post does a good job of covering the more "sientific" aspect, but again, please note this is not an issue that one can prove. Accept the logic or don't. Your choice.
Personally, I believe we are collectively no smarter than yeast. Relatively, we are dumber than yeast: we have brains (they don't), yet we are doing no better in terms of overshooting our environment.
Hmmm....
Cheers
P.S. Who said you were a troll? (<-- See! No smarter than yeast! He-he... joking...)
I was going to contradict you, until I realized your own post provided prime and irrefutable evidence of the thing you are complaining about. Bravo, Maestro!
Look! We have a troll! You already got your ass handed to you above. Do yourself a favor and don't go looking for more kicks in the ass.
That's a 0.23% increase over May 2005 - you need to take out the redundant million BTW. How precise are the numbers being quoted? How do they actually gather this data?
Given the (even after adjusting for the USD), the prices of oil, you would expect to see more than that as an increase (given that demand ought to have increased 7-8% over from May 2005 to April 2008).
I would say that supply is struggling to keep up with demand and is vert sticky at this point.
Srivathsa
Some things I recall from reading Oildrum for awhile--EIA data seems to always be revised, so these figures are at best preliminary; "production" from SA tank farms may be capable of causing this "increase"; Robert Rapier may be correct that we're experiencing "peak-lite", where consumption/demand is exceeding supply/production, even though supply may be still increasing--hence the high prices...
I find visual materials a better aid to understanding, so to put this in perspective I went back to Khebab's December 2007 update. The current EIA figure is indeed a small blip on a plateau that has been ongoing since May 2005. The shape of this now-three-year plateau is plainly different than any pattern exhibited in the 1985-2005 runup of production.
Furthermore, the current EIA figure is still far below the APSO-58 projection for conventional oil (and even farther below APSO-76). Oil production is going to have to increase a lot more to reach APSO's projected 2010 peak. So far, APSO-46 and APSO-58 seem to constitute the most accurate upper and lower bounds of near term forecasts.
Chart:
http://www.theoildrum.com/files/PU200712_Fig5.png
Correction
My math was a little off when I figured the amount that production was up from May of 2005. The amount was actually 168,000 bp/d rather than 178,000 bp/d. I did the data by pencil instead of on my spreadsheet. I should have known better. Sorry about that.
Ron patterson
I don't think it is important to look at the average production for each month but to look at it for each year.
2004 72,512
2005 73,807
2006 73,539
2007 73,223(11 months)
If we could average over 73,807 for the year that would be a little more significant.
http://www.simmonsco-intl.com/files/NYC%20SCI%20Investor%20Lunch.pdf
The average production is now in for 2007, it is 73,274 kb/d.
But all this matters little. The fact that non-OPEC is down one million barrels per day since May o 05 and is clearly on a downward trend, that is important. As far as non-OPEC yearly averages go, they are down over 300,000 barrels per day from 2005.
It's all up to OPEC. Angola, since May 05, has been the one big gainer in OPEC, up 822 kb/d with the UAE second at up 307 kb/d and Iraq third, up 250 kb/d.
The non-OPEC trend is clearly down. Will OPEC trend continue up to offset the non-OPEC downward trend? That is the question
Ron Patterson
As I recall, Angola recently joined OPEC and this is partly why the comparison between OPEC/non-OPEC has changed, with non-OPEC declining-Angola changed teams!
Insofar as I know, we don't have monthly data for the Lower 48 but we do have annual data, and (using the world data through December, 2007) the annual world decline rate in 2007, relative to 2005, was -0.3%/year, versus the initial two year decline rate of -0.8%/year for the Lower 48 (C+C in both cases).
The initial Lower 48 data, and year over year decline rate:
1970: 9.408 mbpd
1971: 9.245 (-1.7%/year)
1972: 9.243 (-0.02%/year)
1973: 9.010 (-2.6%/year)*
1974: 8.581 (-4.9%/year)
1975: 8.183 (-4.7%/year)
*Note that worldwide, in January, 2008, we would be at about the same point as January, 1973, in the Lower 48.
And regarding the monthly data, as Khebab has previously noted, the EIA revisions tend to be downward with time.
More importantly, I estimate that the top five net export decline rate accelerated in 2007, relative to the 2006 net export decline rate. With the latest data from Russia, and with Saudi Arabia saying that they will not increase production (whether they can increase production is the question), I don't see the situation changing. So, at present the top five net oil exporters are on track to approach zero net oil exports in about 23 years.
This decline in exports (due to domestic consumption) was given some attention at the EIA Conference as well as a note that this sort of taking oil of the world market for internal consumption is a driver that is being missed in some quarters (not here, of course, because we are pretty much able to think at multiple levels simultaneously. We can even walk and chew gum at the same time).
So, really folks, this shouldn't be cause for peeps to go out and buy that new Suburban.
Naw, just a Tahoe Hybird.
(ducking)
In all seriousness, it is a pretty impressive feat to get such a beast to get 21 MPG.
Total US monthly data is available at
the EIA.
Further, you could derive lower 48 production from this EIA web page by taking total production and subtracting out the part of PADD 5 that is Alaska as well as US offshore. The data is all there if you wish to make the adjustments just for lower 48. Note that the data for any of those series is available as a monthly spreadsheet from 1920 to 2007 (and in a few cases to 2008).
I have put two charts within the post, just hit refresh.
What is not clear from your World Production chart (fig 1), given that from 2007 the Canadian tar sands production is no longer broken out, is the ratio of tar sand production to tradition oil production....
What I am thinking about is all the EROEI posts lately... certainly as far as EROEI is concerned tar sands are a different beast than traditional C&C.
Is there anyway to break out the tar sands production again? And, if that could be done, might it not be clearer what the "peak" dates truly mean?
I have corrected the chart, It's clear that the Canadian tar sands are contributing a little bit to this new record. The production was around 800 kbpd in January 2005 and is now around 1,500 kbpd end of 2007. If you remove this contribution (~0.7 mbpd) the corrected maximum would be still in May 2005. Anyway, if Russia goes into a decline, the tar sands contribution will be wiped off in a few months.
Well there ya go. As I wrote about 2 years ago, the changing definition of 'what is oil' will confuse people and lull public into complacency at the same time the internals deteriorate. So for CRUDE OIL, May 2005 still is the peak. Ceteris paribus, I am sure more energy and other resources went into Jan 08 world oil production than went into May 2005 world oil production. In addition to higher dollar costs 4 years later, we have higher costs in terms of natural gas, iron ore, water, oil, and environmental inputs.
"...more energy and other resources went into Jan 08 world oil production than went into May 2005 world oil production."
What, Nate, you sayin' EROEI matters!?! :-)
If Crude and Condensate is a smaller percentage of the total, the total BTUs produced is quite possibly lower in Jan 08 than in May 2005, because the non-crude tends to have fewer BTUs per barrel. When you combine that with spending more BTUs to produce the "liquids", we are definitely behind.
I'm saying net energy matters. Immensely. EROEI is the primary accounting metric for net energy, and is fraught with problems. But its the best we have, for now. I doubt the EIA will complicate things to that level, but its CLEAR that NGPL and ethanol and some other liquids have different BTU contents, and are able to do less work that straight crude oil, so that SHOULD matter. Im sure they would agree - they just don't 'complicate' it unnecessarily because it's never mattered before. Lets petition them to start reporting in net (not net energy) but the net in BTU terms. One way to do it is to start EIA SHADOW statistics on TOD and report them in graphical form each time an EIA report comes out. I don't have the technical skills to do so, but several of my fellows here do...
Absolutely, getting EIA to report in BTU's, rather than in "any ol' goo will do" terms would help clarify the picture, and be a meaningful first step in the direction of full bore consideration of net, rather than gross, energy.
Well I was about to make this point, but you beat me to it Nate. I thought it would be the first comment in the list, Ha silly me, I must say though I have been confused by this new "Oils is Oils" reporting strategy, Kudo's to big Oil, I'm confounded, ;? I expect SLW mbp to fall, and Shudder in horror when Brent$ rises, but I am still at a loss as to where these condensates finally end up, I can see it now, Damn, My Mustang just wont run on this High Octane Premium Condensate.
Nate and Khebab --
I think you guys have nailed it. My basic additions to your statements which, to many here, are likely to be seen as no-brainers:
1. The 2005 bend/peak/plateau saw ever after diminishing returns in EROEI for all oil. The easy, high energy, oil peaked.
2. After 2005 we saw a greater influx of lower EROEI fuels which, along with contraction in world exports, added cost to all interchangeable oil products. I think non-conventional oil and ethanol are obvious constituents of these low EROEI liquids. But I think you need to add in previously uneconomic oil that came back online after the drastic increases in prices as well as weird, semiconventional oil like the stuff coming out of Bakken right now.
3. This greater influx of lower EROEI fuel may well push the total liquids 'peak' up or extend the plateau. In my opinion, it's really not possible to exactly predict how many months or years this trend may continue. That said, prices will have to stay high and continue to climb to keep new resources open until we have significant enough demand destruction to make a serious dent and allow for some relaxation in price -- albeit never to past lows (IMO the current demand destruction bottom isn't much lower than $80 per barrel).
4. The cliff/downslope will likely come as net EROEI for oil/liquids approaches 1:1 and economies are placed under enough strain to see serious demand destruction. In this case, demand destruction would be enough to result in a net decline in world oil demand. Sure there's massive amounts of oil locked in the ground. But how much of it can be extracted at a measurable net energy gain? Once the net liquids EROEIs reach a certain tightness (6:1, 4:1, 2:1, 1.5:1??) then I think we'll start to see a measurable and consistent drop-off in production. I guess this would be the famed 'rear view mirror effect.' In any case high cost energy at least, in part, reflects lower EROEI energy.
Caveats:
a. Net oil exports per West Texas seem likely to contract regardless as net gains in liquids are likely to be marginal considering the depletion rate.
b. OPEC has a firm control over price as any small decrease in OPEC exports has serious impact (historical data from early 2007 bears this out).
c. It is possible that we have just seen a post 2005 bump in net supply even though follow on plateau/marginal decline may still materialize in the 'rear view mirror.'
d. My past critiques of EROEI analysis were due to bias in the data reported and not in the validity of the underlying logic. It is perfectly reasonable to want high energy content energy sources and the natural preference would be for greater EROEI. But once these basic assumptions are accepted, everything else seems to fly out the window as sample/issue bias comes into play. People who dislike ICEs will negatively skew EROEI numbers. Conversely, those supporting electric vehicles may well exaggerate their efficiency numbers. In this kind of environment, it's tough to separate truth from fiction without a much broader and less biased system of peer review.
e. I think EROEI will be in most visible decline in liquid fuels throughout the coming decade. I also think we'll have a much better idea how resilient or frail economies based on renewable sources are as time passes. In any case, since we have few alternatives to fossil fuels other than renewables and nuclear I think a rapid transition to these alternate sources is advisable. Some net energy gain is better than none at all and even if we have to increase our efficiency and do without certain luxuries it's far better than having to do without everything and live in a state of starvation and anarchy.
So this means that May 2005 was the all time Peak for world wide Conventional Oil Production ?
Alan
What Canadian tar sands numbers are you using? Someone in a Drumbeat mentioned that tar sands production was down in 2008 relative to 2007. Do you have any numbers on this? Do you have any hard data showing tar sands production is up in 2008?
I used data from the EUB up to December 2007 but I don't have the link handy right now, I'll post it later.
I'll check on the site for the 2008 numbers.
Ok, I've found the source (National Energy board):
http://www.neb.gc.ca/clf-nsi/rnrgynfmtn/sttstc/crdlndptrlmprdct/stmtdprd...
you will need to add the entries named AB NON-UPGRADED BITUMEN and AB UPGRADED BITUMEN and multiply by 6.2929 in order to get a production in barrels per day.
It seems that it has been revised downward significantly for the Non-upgraded bitumen figures but I don't know why, my numbers where more optimistic by 150 kbpd:
for 2007 (kbpd):
1107 1187 1257 1133 1064 1056 1158 1329 1243 1215 1200 1217
for 2008 (projections):
1220 1114 1259 1203 1210 1221 1255 1294 1323 1406 1426 1451
data for 2008 are only forecasts.
You will notice in my post below (little table shown) that Canadian production is not doing well in January 2008. The lower tar sands numbers would seem more likely than high ones.
Thanks!
To an outsider, when they hear statements about "oil production" and so forth there is much confusion, and many people do not realize that "all liquids" includes even water (if counting Orimulsion and not adjusting for water mixture.)
To me, when I hear "oil" I interpret that to mean the liquid that comes out of oil wells, not some other hydrocarbon produced through the acrobatics of chemical engineering.
Here is a primer on whats included in the EIA oil numbers, also linked above. Tar sands are part of C+C, but Orinoco emulsion is part of 'other liquids'. We really ought to challenge the EIA to report this data in ways that are more meaningful. To ask them to do 'net energy' reporting would be too much. But they at least could handicap the increasing amounts of NGPL and ethanol by the much lower BTU content. A barrel isn't a barrel in its impact on society after all.
If Tar Sands is taken out of Crude and Condensate, then we lose the Canada total (unless we can get EIA to give us an all liquids total for Canada, including the Tar Sands + Biofuels). At least we can get the total data pretty easily this way.
It's the same old problem of comparing energy apples and oranges. Things can not be compared if they are different. Peak Oil is about conventional oil production. If non conventional oil is added in, it is an invalid comparison and illogical.
Hubbert was talking about conventional oil and the historical data is for conventional oil as far as I know since unconventional oil is relatively recent. It is invalid reasoning to base Peak Oil on conventional oil data and then at some late date throw in non-conventional sources and say there is a new peak in oil production. It is comparing energy apples and oranges and a big no no.
The valid approach is to keep separate data for non conventional oil from tar sands and such and also ethanol for example. Then do a Hubbert type of analysis for those types of liquid energy just as one might do for coal for example. Things that are significantly different can not be compared. It is a logic error to do so and invalidates the result. Logic rules, not numbers. Logic tells numbers what to do. Do not let numbers dictate logic.
Significantly different things can not be compared or mixed. If it is done, for whatever reason, the result is nonsense. This is an important concept. It appears that even government agencies have a difficult time grasping it. Or maybe they do understand and make the mistake on purpose to confuse the sheeple and obfuscate what is really going on.
X - We agree!!
(note, ethanol not mentioned in your post)
Nate, are you sure about this? Orimulsion, which is no longer produced, was part of "Other Liquids" but I believe heavy oil produced from the Orinoco Bitumen is considered crude oil just like oil from the oil sands.
Ron Patterson
I was sure about Orimulsion because of my links in my post from 2 years ago. Not sure about heavy oil - presumably that is in C+C. When did Orimulsion stop being produced?
It was phased out in late 2006. They could get much more money for the goo by converting it into crude oil than using it as boiler fue.
Venezuela to phase out production of Orimulsion boiler fuel
Ron Patterson
IOW, compared to 2006 (when I wrote that post), in 2008 ALL Venezuala production is now in C+C, whereas in 2006 and before, some fraction was in 'other liquids'.
What had confused me is that EIA, in their definitions, still list Orimulsion. I guess they leave it in there for historical reasons.
No doubt Robert is vindicated. I think time after time Robert has been proven to be the best predictor on this site.
http://www.youtube.com/watch?v=YwEMxYggoKQ
Now I know I am in trouble-I am starting to find you funny. I can't figure out if you are posting from a frat room or from a Junior High classroom, but your comments are getting funnier.
My guess is junior high classroom.
Laughter is the best medicine. Hey if I can give you a laugh no matter how it comes, then cool. :) Alright peeps, gotta take off for a bit, have to head to Europe for work. Peace out.
At least when the predictions pertain to oil production..
(Of course, he is only one on staff that works (worked) for an oil company...)
R^2 is the Alan Combs of TOD. He's the token sane person they add for balance.
Robert is not "vindicated" yet by a long shot. As the discussion right above your comment demonstrates, the crude peak remains May 2005 once you remove the synthetic stuff from Canada's tar sands which is in no way, shape, or form "crude" oil.
All liquids is rising because of tar sands, ethanol, biodiesel, etc. The problem with many of these is the environmental atrocities committed to create them.
It is interesting to note that most of this gain came from OPEC. Though non-OPEC nations, since May of 05, Azerbaijan and Russia were up 506,000 bp/d and 459,000 bpd respectively, non-OPEC as a whole was actually down 997,000 bpd since that date. The largest gainer was Angola, up 822,000 bp/d since May of 05.
According to most reports out of Russia, they have peaked, at least for the short term. January Russian production was down 161,000 bp/d from their latest peak in September of 07.
Ron Patterson
Russia and China look liked a lot they are peaking.
Chirs Skrebowski was forecasting a peak for China in 2007 I think. More oil imports for China?
China March imports up 15% from last year according to Drumbeat item
Just a little caution on short-term Russian declines. I seem to remember that they have some production difficulties in winter months, and if this has been a more than recently normal hard winter then this may have effected some of the numbers, even y-o-y.
I wrote: non-OPEC as a whole was actually down 997,000 bpd since that date. The largest gainer was Angola, up 822,000 bp/d since May of 05.
Sorry, I did those figures before I updated all my spreadsheet. Non-OPEC is actually down 470,000 bp/d since May of 05. The EIA updated all OPEC data all the way back to 1997. It had something to do with Ecuador. I have got to slow down and make all changes before I post them. My error, sorry.
Ron Patterson
If the new drilling techniques being used in the Bakken shale formation work on other formations,it would push Peak Oil back indefinately. The U.S. has 3X current Mideast oil reserves locked up in shale.
"Oil companies began sharing technology about two years ago on how to recover the oil. The technology involves drilling vertically to about 10,000 feet, then "kicking out" for as many feet horizontally, while fracturing the rock to release the oil trapped in microscopic pores in the area known as the "middle" Bakken."
http://www.cctv.com/english/20080411/105608.shtml
HaHaHaHa!!
Oh, you're serious...
Well first, one needs to distinguish the (probably less than) $4 GB of Bakken oil trapped in shale from the vast "oil shale" where one has to dig it out and barbecue it before it becomes something usable. Oh, never mind.
HaHaHaHa!!
You didn't read the link I provided JoulesBurn. They aren't digging up the shale in Bakken. New drilling techniques allow them to tap it. If the same can be done for other shale deposits,it will delay Peak Oil quite some time,true or false?
Well, you didn't read my post.
Your link (Dateline Beijing?) has the same story reported yesterday. Your 3X Mideast assumption includes what, per chance?
False - Bakken is not an oil shale, it is an oil deposit in ordinary shale rocks (that have very low porosity). Since the oil is still a liquid, it is possible (using a lot of money and energy) to get at it through drilling.
The Colorado 'oil shale's are solid form of hydrocarbons, which require an order of magnitude more energy and money to mine and convert into liquid fuels. There is no liquid fuel in those deposits.
Think of the Colorado deposits like the Canadian tar sands; Bakken is a really crappy (and possibly fairly large) oil field.
"The Colorado 'oil shale's are solid form of hydrocarbons, which require an order of magnitude more energy and money to mine and convert into liquid fuels. There is no liquid fuel in those deposits."
Thanks for the info Hindmost. Still,it doesn't mean Colorado shale won't be tapped eventually. These drilling techniques to get at the Bakken deposits weren't available 3 years ago. People can be damn creative when the price is right.
I disagree. IMO wind energy (and others) will always be more worthwhile than shale, especially since that will continue to develop as the energy squeeze tightens.
The horizontal drilling part has been around a while, I think what may help more is the slickwater frac job. By changing the composition of the fluid to make it thinner and more slippery they are able to drive the proppant further back into the frac.
The oil shales will most likely be tapped in the same manner as our other major solid fossil fuel deposits: mining.
Despite the name they really compete more with coal than with crude oil.
Hindmost. What a wonderfully clear and concise explanation.
False. It's all about flow rates.
As I have previously noted, in 1956 Hubbert found that a one third increase in estimated Lower 48 URR from 150 Gb to 200 Gb delayed the projected peak by all of five years.
If we round off the upper end Bakken estimate to 5 Gb, and assume that it was pretty much fully developed in 1970, it would have therefore delayed the Lower 48 peak by about six months.
And you need to consider that these are very expensive wells, relative to fairly modest production rates, after the initial peak production period, and we will need a lot of them at the same time that we are facing personnel and equipment bottlenecks.
Also, we need to keep in the mind the difference between Kerogen deposits, e.g., the Green River Formation, and thermally mature oil reservoirs, e.g., the Bakken Formation.
Any way you slice it, maintaining an infinite rate of increase in our consumption of a finite resource base tends to be difficult to achieve--at least outside the special world that people like Peter Huber live in.
By all means, let us exhaust what little capital is available to maintain our God given need to infinitely increase our consumption. Let us not consider whether or not the required billions to explore and drill Bakken, not to mention futile attempts to bake oil out of shale in Colorado, might be better utilized in conservation, efficiency, and in further attempts to make renewables like wind and solar more competitive. For, indeed, if oil were not infinite, God would not have given us the ability to drill and bake in the first place. It is not a cruel God; it is merciful and has blessed us with infinite abundance ( except for that brief little blip where we thought we had peak production in the U.S.).
FALSE.
Bakken Not Giving It Up
It appears there's a lot of oil down there. It also appears not much is ever going to come out. They're looking at getting out about 1% of OIP.
Cheers
Expensive is right; the initial - or older - figures for wells I'd seen were ca. $2 million; latest batch of news articles have prices more like $6. Last year when we were wholly in the dark about what could be pulled out of the Bakken it seemed like tens of thousands of wells could do some real good if the URR were high enough. Nope!
I'm constantly seeing the conflation between Bakken oil (API as high as 42 - good stuff) and shale, too. Also the odd bit of tinfoil liner on baseball caps. OF COURSE the low figure is a conspiracy to hamper domestic production! Just like Gull Island!
Wonder why Price was so far off, though - his low figure was 271 bbls.
I dunno much about Bakken production but I keep checking the mailbox - they brought in a 1,200bbl/day well on my family's land in North Dakota and the royalty check is due ...
Right now, Bakken flow rates are around 100,000 bbl/day. They are hopeful for 250,000 bbl/day in a few years. Not quite so earth shattering is it? As everyone is saying, it looks like a really crappy formation with a lot of mumbo-jumbo needed to coax the oil out.
Imagine how much (useful!) plastic we could make from that?
Let use it to make plastic instead of burning it. Oh wait, that's not our decision. My bad.
That's about $49,000,000 a year. What are typical royalties? If you get a dollar per barrel, that's about 438k a year. Ten cents a barrel would eliminate the need for a job for one family.
Let us know what it's like in Beverly Hills, Jed.
Lucky bastards...
:)
Cheers
To the mineral rights holders somewhere between one quarter [one quarter would be for a a hot prospect in a hot area -- more of those in the late seventies] to one eighth [the old standard now much less common in TX or OK except for on old leases held by production].
Most of what I have seen lately are three sixteenth leases sometimes with some small additional overrides attached.
If SCT and his family have the whole unit, they could indeed be headed for the "Hills of Beverly" if so inclined. Personally, I'd wait to see what happens after initial flush production, but one tenth that rate with no expenses would be a very tidy sum.
Do these contracts pay off of market price? At 1/8 that would be nearly half a million/mo.
Lordy be...
There are a lot of newly rich in the area of that basin, if so.
Cheers
Probably close to "market" if you are defining market as the NYMEX WTI headline number as market. In ND or MT there may also be severance taxes payable to the state -- OK takes about seven percent -- otherwise the mineral rights owners take their cut right off the top.
The gathering company gets a cut [somewhere around two dollars off WTI in central OK -- adjusted for gravity and sulfur if out of specifications].
ND or MT oil probably sells at a discount, but if the discount gets too large I suspect the producers will make other arrangements. I was told that Elm Coulee, MT Bakken oil is great stuff, light at 42 degrees and sweet. There should not be a problem [longer term at least] for finding a receptive market for this oil. Just conjecture, but shorter term a local glut due to availability of pipelines may result in a bigger discount.
I read the report last week and remember a figure of 3.65 billion barrels recoverable. From memory the consumption in the US is 20.5 million barrels/day. So dividing 3,650 million by 20.5 gives 178 days or about 6 months, if my memory, maths and calculator are correct. I wouldn't call 6 months "indefinate".
I have recently seen lots of share tippers pushing this, usually mentioning the huge quantities 500 billions but never the recoverables of 3.65!! not a surprise really.
Do you understand permeability? Porosity? Flow rates? No? Then you're just repeating BS from someone trying to hype a bad stock play. The oil companies have known there is oil in the Bakken formation for a long time. But the physics of the rock won't let it come out at anything other than a tiny trickle.
Horizontal drilling, which is what you describe, is decades old. It's not some new super secret magical tech that will make the Bakken produce anything approaching useful amounts of oil.
The US uses 21 MILLION barrels of oil per day. The Bakken may add a few tens of thousands of barrels per day to our production. Do you understand what that means?
Horizontal drilling has been recently improved with Stacked fracturing (multi-stage fracturing).
http://nextbigfuture.com/2008/02/multi-stage-fracturing-of-horizontal_29...
This is what is making the Bakken economically viable and increasing flow rates.
Each of the new wells is producing about 200-2000 barrels of oil per day.
The success ratio for the wells is high.
Flowrates declining to an average of 60% of initial flow.
At 400-1000 wells per year (USA and Canada) this could be quite significant into the hundreds of thousands of barrels over 2-3 years. It will take 5 years for pipelines and refinery expansions to be put in place.
10 years at 1 million b/d for the 3.65 billion (US only) avg estimate with todays technology. The Canadian also seems to be multi-billion barrel.
US and Canada combined seems like Bakken without improved tech could go to 1.5 to 2 million b/d in about 5-7 years and last at that rate for another 8 years.
Going beyond the 3.65 billion US figure. It seems that the remaining oil should be easier to go after than straight shale formations. There is a massive multi-trillion motivation to get to better technology to get at that oil. Between 1995 and 2008 the technology and price improved to allow 25 times more oil to be accessed economically.
You are using all of the most optimistic numbers possible and still all you get is 2 mbpd MAX from Bakken for a few years. Whoop-dee-doo. On the global scale that doesn't amount to squat, given BRIC increasing consumption.
However, I don't see that 2mbpd happening because drilling costs rise as rapidly as price, as the rest of the industry is discovering. You can't assume a $150 per barrel price gives sufficient incentive if the costs rise proportionately, can you?
And there is still a problem in proving those flow rates will scale. That's one reason the majors have been very leery of Bakken.
In short, at the best of all possible reasonable estimates, the Bakken is peanuts overall. And at more reasonable estimates (which you don't even give), the Bakken is inconsequential.
Drilling costs in the Bakken are 1.7 million (Petrobank) to 6 million (EOG) for the horizontal wells. Payback is in 3-11 months based on actually drilled wells.
We will see how consequential this is over the next few years.
Brazil's National Petroleum Agency President Haroldo Lima is talking about a 33 billion barrel offshore oil find (not Tupi another find) deep-water exploration area off the coast of Rio de Janeiro
http://ap.google.com/article/ALeqM5jjfzogTbuKqVbYSPLPvAodaTOUyAD901TM3O0
According to the ANP director, the field, temporarily named "Sugar Loaf," in reference to Rio's landmark, would be five times larger than Tupi, the giant field discovered in November 2007.
Tupi is regarded as the largest oil and gas reserve ever found in Brazil, bearing an estimated volume of 5-8 billion barrels of light oil.
Petrobras' press office has not confirmed the discovery yet, but informed that the Sugar Loaf field is located in block BMS-9 of the Santos Basin, west of the BMS-11, where Tupi was discovered.
It is my understanding the 3.65 figure representsrecoverable for the entir Bakken formation, not the US portion alone.
Cheers
If you look at the actual report fact sheet you see the estimate for the US only.
3.65 avg based on tech in hand.
http://pubs.usgs.gov/fs/2008/3021/pdf/FS08-3021_508.pdf
I guess I'll just pop in at the GMC dealer to get a Yukon XL Denali
I'm not saying it's a good thing consumer. It would mean even more CO2 put in the atmosphere each year. It would delay the inevitable move to the grid,and cleaner sources of energy. Experts always claimed technology would unlock the oil in shale eventually. It's a massive resource. It will get used.
A Yukon eXtra Large Denial - Do I get fries with that?
The "Yukon Denial" - that's funny!
But why get the Denali when you can really splurge and get the Lexus LX 570?
With peak oil over now (and me out of a job again) I think this Lexus has gotta be the way to go if you've got the bucks.
-- Dave
Thanks for the tip on the Lexus. The wimpy 4.7L was the reason I passed on the last model. Now everyone will know how big my dipstick is.
Hello Dave Cohen and Consumer,
I tell Yerginites, that if they absolutely must buy a big, new ICE-vehicle: then they are much better off getting a four-door crewcab pickup instead of an SUV. The resale value of the pickup will be much higher when the time comes to mount the .50 cal heavy-machine gun/RPG launcher to the pickup bed & frame. The extensive bodywork required to mount the same equipment to a luxury SUV will be cost-prohibitive.
Also, until that lock 'n load time arrives: hauling fresh manure is much less aromatic with a separate cab/cargo bed pickup versus being loaded into the enclosed plush leather and carpet space of an SUV.
Bob Shaw in Phx,Az Are Humans Smarter than Yeast?
one last note:
I believe steel engine blocks and valve-heads in most big, V8 heavy-duty 'Murkan pickups are more resistant to bullet piercing than the much softer aluminum engines in many SUVs. This engine choice may be a matter of life and death when wealthy Yerginites keep driving to Starbucks postPeak.
Does anyone have any idea how much oil was heavy sulfur laden oil compared to the May 2005 number, and how much more oil was used to produce the new peak? The overall quality of the oil in relation to the previous peak and the net oil produced is more important, n'est pas?
Sensible questions. This whole hoopla over the month of peak production of c & c is a silly distraction. Peak oil is an historical event with many characteristics and will in the future be situated circa the end of the 2nd millenium/beginning of the 3rd millenium of the Common Era. Quality of the product, net energy, available exports, etc. are some of the aspects of this event. This peak month stuff is a circle jerk.
And hopefully not to be picky, since it is probably a typo, but you wanted to write, 'n'est-ce pas?'.
"Experts predicted the "end of oil" in the early 1920s, again after World War II, and most famously in the 1970s--not long before oil prices collapsed from $38 a barrel to $9. In each case, what doomsayers underappreciated was the powerful impetus that rising prices give to innovation and technology; when prices surge, petroleum prospectors become uncannily good at figuring out new ways to suck hydrocarbons out of the ground."
http://money.cnn.com/magazines/business2/business2_archive/2005/12/01/83...
Just something to keep in mind when predicting peak oil.
Everybody hopes you are right-we might lose some on the oil investments but the way it is going lately the doomers seem to be picking up points almost hourly.
Also note that that article is from 2005. When oil prices were "hovering around $60 a barrel."
I didn't bother reading the link-I remember when CTL was going to be huge by the time oil hit $100. That and all that gigantic Orinco sludge that just needed slightly higher prices to turbocharge. It doesn't matter, because solar will take over once oil prices get just a little bit higher, then we move to hydrogen flying Jetson cars.
I guess in that case the whole thing is a sham then. I mean, if they've been wrong before, they can't possibly be right now, yes?
Now to go buy that Expedition.
The trouble with statements like this is that they are totally unreferenced. If one actually goes and studies the history, very rarely does one find the experts making the predictions they are alleged to have made.
Not true. In Yergin's book The Prize he documents many instances of "the end of oil" predictions.
The problem is the premise. We are not anywhere near "the end of oil". What we are near is the end of oil production meeting demand at a low price.
My favorite quote from Yergin's book is also pertinent to this thread. In regards to Colorado shale oil the quote is along the lines of: "Such vast quantities of oil exist that soon no one will want for gasoline for their automobile". The quote is from the 1920's.
I think of that quote every time I read yet another story about oil production from Colorado shale.
The problem is that no one ever identifies who "THEY" are. Sure people have been predicting everything from the end of the world to an invasion of space aliens. And I am sure there are a lot of "THEYs" out there who have predicted the end of oil many times in the past. But who were they and what were their qualifications?
Many geologists, since the late 1950s have been estimating the world's endowment of recoverable oil to be approximately 2 trillion barrels. So if we identify "THEY" to be oil field geologists, then THEY have hit the nail pretty well on the head, and they did so way back in the late 50s.
So I ask you to compare the "THEY" that have predicted the end of oil in the past with "THEY" who are predicting the impending "PEAK" of world oil production. I think you will find a difference in the quantity and quality of the latter verses the former.
Ron Patterson
Oh, no. During my entire life I've saw experts predicting the end of oil. Those predictions are also at historical documents.
What statements like the GP fail to tell is that those experts were almost unanimously predicting peak oil to the end of XX or first half of the XXI centuries.
Yes, and note how they magically figured out how to keep increasing U.S. production indefinitely. Not.
About 1 out of every 8 bbl now comes from something other than C+C with most of that being Canadian bitumen.
As for all that fuel locked up in shale you could look at reports from 100 years ago about its use being only a few years away. Getting at the Bakken shale will be a slow, difficult, and very expensive process. Even if the investment is made the rate of extraction will be so slow that it will have no noticeable effect on daily supply.
"About 1 out of every 8 bbl now comes from something other than C+C with most of that being Canadian bitumen."
And that contributed to the delay in peak oil thomas. I'm sure it will be 2 of 8 eventually. Then 3 and 4. That's not a good thing. It means even more pollution and CO2. I favor going all electric,and mandating solar systems on all new construction. Today,not tomorrow or the next day. Every barrel of oil burned harms the environment,some more than others.
"Today, not tomorrow or the next day."
Yesterday!
Bakken is important because it has wheat fields over the top of it and corn fields not so far away. We will need to continue to eat as we migrate away from fossil fuel based farm practices.
See how well this works - we can get our ethanol and our oil from the same place. We just need to finish the auto pilots for our cars so they can continue to drive after we've starved.
Deffeyes peak goes down! The peak oil clock is reset!The question is: Assuming the new record holds, according to our local Deffeyesians, when will peak occur now?
Jeffrey Brown (westexas) used to cite Deffeyes continuously although I noticed that dropped off sharply in recent months.
Leanan is also a Deffeyesian.
Back in late November, when I came out against a sharp falloff in oil production, she disagreed and supported Deffeyes.
http://www.theoildrum.com/node/3308#comment-271062
Well, the Deffeyes peak was actually in danger back then at the time of the conversation.
Actually, I'm presenting a talk at the University of California at Santa Barbara on Tuesday, which supports Deffeyes' work, and check out my comments up the thread.
Hey, I live in Santa Barbara. Mind sharing the time and place of your talk?
I called up UCSB's Geology dept today and a woman there told me the talk will be at 7 PM in the University Center's Corwin room (Corbin? close to that).
As I mentioned in my comment above, Deffeyes actually uses a smoothed curve to predict the peak. So one month doesn't really change things. The "Hubbert Peak" may not match the actual peak month. IIRC, it didn't for peak oil USA, which has caused some confusion on peak oil sites.
That's assuming this number stands, which it may not.
Excellent! I wanted both you guys on record as unrepentant Deffeyesians.
How anyone can actually conclude this indicates that the "peak oil clock has been reset" is baffling.
When do you date peak?
The peak oil clock is about how far we are past peak.
Global oil supply has been flat for 3-4 years-no one disputes this. Do these numbers today change your view of 2013 oil supply numbers? If not, then the relevance isn't there.
The relevance is there because, strange as it may seem, it's rather difficult to have a permanent fall off in oil production if you are not past peak oil.
RE 2013:
True this is only a single month. But should we have 12 months of production that surpass the previous record for a similar period, then I would say that orthodox Deffeyesians' view of 2013 production would likely be revised higher than their estimates were a little while back. Maybe they can shed some light on this?
Agreed. Why use the monthly numbers? Why not daily, or weekly, or hourly...or yearly? Deffeyes uses a curve fit, and there's good reason for doing so. That's why I said we wouldn't know for sure until years later. (And Deffeyes has said that as well. The peak is only recognized in the rear view mirror.)
Could you source this? As far as I know Deffeyes has always referred to single months and just switched them around according to how the EIA revises its numbers. His website doesn't support your contention.
If he is fitting a curve, what is the scheme? If he is using a simple moving average (which he should be) it would only move the peak forward into 2006. It would be nice if people could agree on what method they are using to calculate a peak beforehand.
He discusses it in his book.
You're kidding, right? Both his books were published before March 2005 and it is well known that the "predictions" contained in them have proven wrong. The peak he uses is on his website under the March 2008 post and it specifically refers to the t11d.xls EIA file (and the most current one). Granted, it changed as the EIA updated its spreadsheet so it doesn't necessarily produce the same math as is on the page. But having followed his site for at least a year I can assure that is his method.
His books sometimes refer to yearly production data and Hubbert linearization.
If as another reader here suggests it is some sort of gimmick, it is wearing kind of thin.
I was talking about the US peak. Presumably, he used the same method for the world peak.
In neither book did he back away from what his model showed for the world, i.e., a peak between 2004 and 2008, most likely in 2005.
An observation, that the world appeared to have peaked in 2000, earlier than what his model showed, is not a prediction.
So we just have to wait for 2009 ;)
Not to be a pain, but I read the second book and don't recall such a timeframe, but I read it a few years ago. I'll try to look it up some time. Thanks for the link about the EIA revisions.
His prediction in his two books, notwithstanding an erroneous observation regarding 2000, was always for 2004-2008, most likely 2005. If memory serves, he said that his Thanksgiving Day, 2005 prediction was mainly just a gimmick, i.e., give thanks for what we had, and get ready for a far different future.
Deffeyes has a sense of humor that probably made him an interesting lecturer (as college profs go, anyway ;-). But it's sometimes misunderstood by mainstream types. Like his Thanksgiving Day prediction. And his "back to the Stone Age by 2020" comment. Folks, he doesn't mean it literally.
A suggested exercise.
Take the May, 2005 number for C+C, 74.3 mbpd. and then take the rest of 2005 monthly data, and the 2006 and 2007 annual data, and then calculate the cumulative shortfall between what we would have produced at the 5/05 rate, and what we actually produced. My estimate is about 760 mb.
The preliminary January, 2008 number is about 74.5 mbpd (I'm rounding off to 0.1 mbpd), which as noted above, is subject to revision, generally downward.
In any case, for the first time in 32 months since May, 2005, the EIA shows that the cumulative shortfall has gone down, from about 760 mb to about 754 mb. Clearly, the crisis has passed, and gasoline will soon be too cheap to meter. We will just pay a flat rate and drive to our heart's content.
A minor note. Deffeyes was modeling conventional production. What would the C+C data look like without the production from bitumen deposits?
Granted, a barrel of upgraded oil from bitumen can be refined just like a barrel of conventional light/sweet oil, but the question is, can nonconventional production offset the decline from conventional production? I think not. Also, the two largest sources of nonconventional oil in Western Hemisphere are Canada and Venezuela. Canada isn't exactly flooding the market right now, and I estimate that the combined net oil exports from Canada and Venezuela are going to show an annual decline in 2007.
Actually this is basically the approach I use. We assume that the peak production in 1980 could have been met at anytime after that if supported by prices and you back calculate how much oil production was moved forward or backwards in time assuming technical progress over the time period was capable of increasing extraction rates to give you a constant production number.
Basically the same trick but you back cast and it makes sense to use a more conservative number then the 2005 peak since this includes a big slug of idled capacity that was brought online.
We had a net carry forward into the 1990's of unproduced oil. And as price and production shows it took till around 2005 to get maxed out. So we have had a broad production capacity level for decades.
Given this we have had a interesting combination of capabilities as in my longer post increases in extraction capability and because of low prices selection for draining the best fields first.
But technology allowed us to produce if needed at high production rates to around 75% URR.
So I generally do the same as you but I'm back casting into the past and assuming a big wedge of potential production by assuming potential production rates or capacity is constant out to 75% URR.
Assuming a resonible production rate URR of 1500GB before production would be much lower than today gives about 1125 GB's we can produce at a constant high production rate.
It took a long time to burn through this oil glut. Doing a rough back cast like your forward casting gives a 20GB glut that had to be worked off because we did not produce at capacity.
5mbd of under production ** 365 days * 10 years /1000 == 18.25. I think we are now around 1100 or so GB of production so this is at least consistent. In the sense in the last 30 years we have had because of both technical advances and production below capacity a sort of virtual 20GB field that was producible. This is the total spare capacity URR cushion we had over the last 30 years. On average we eroded it at a 1.8 mpd clip. Or another way to look at it is we basically had a free year of oil production with zero depletion to use as we wished.
Lets figure we had this glut available for 30 years ---> (20/30)*1000 --> 670 mb or a average excess of 1.8mbd of capacity we worked off over a 30 year period.
So my yearly extra glut number is not all that different from your cumulative short fall. I think your really talking about the loss of the last segment of glut production.
I just think its interesting with my approach I get a similar missing number. Also of course and a lot simpler its similar to the final segment of spare production that was brought online.
In any case by taking your method backward in time you can see the "glut" we had before we went negative. And like I mentioned a really convoluted way to say we ran out of spare capacity in 2005 :)
I have just checked it. According to the BP statistical review we had 66 MMb/d in the 1979 peak year, then dropping to 56.6 in 1983. Production was back at 1979 level only in 1993. During that period of lower production 22.7 Gb of oil were not produced. It took until 2003 to burn that oil, which lifted production to 77 MMb/d
That sounds right.
My 20GB quick eyeball was pretty good.
In addition to the glut you have to figure 1979 was not the peak year if we had continued to produced we probably would have hit 80 MMbd/d by 1995 in line with the early but post major discovery peak predictions.
"Can nonconventional production offset the decline from conventional production?"
Not without substantially increasing costs and a nasty payback in the form of reduced efficiencies.
"I estimate that the combined net oil exports from Canada and Venezuela are going to show an annual decline in 2007."
The energy intensity and environmental impact of bitumen is going to also make it more and more difficult to scale production upward. It may happen, but in the end they will probably need nuke plants on site (as a tightening in natural gas looms).
In our article
"Did Katrina Hide the Real Peak in World Oil Production? And Other Oil Supply Insights"
http://www.theoildrum.com/node/3052
we showed that crude oil production would have been 74,524 Kb/d in December 2005 without hurricane Katrina. In sofar Deffeyes' claim still stands.
Nothing will change the fact that the 1st underlying peak of a group of declining and peaking countries was in 2005
As we said in our update article
Bumpy Crude Oil Plateau in the Rear View Mirror
http://www.theoildrum.com/node/3793
a 2nd underlying peak of hitherto growing countries is shaping up and that is to be monitored. Once this peak is established and everyone else is flat or in decline, the whole system will go into decline.
Minor rebounds in production here and there and from month to month can never be excluded.
IMO, this is all predictable (and petty). The date of Peak Oil, and its ostensible repercussions or lack thereof, ofttimes become a contest in who was right and who was wrong. When we are right, in a competition/debate vs another, we get a surge of dopamine - it feels really good. In animal competetion, the winners 'surge in dopamine' ends up typically in a mating opportunity, while the loser has a drop in the same neurotransmitters (picture dog with tail between legs and head down). So of course we all like to be right, and don't like to be wrong. This is natural.
Fossil fuel depletion is happening. Natural resource depletion is happening. Population and demand is increasing. All these statistics that look important up close are irrelevant from a birds-eye view. Arguments intra-tribe in the end are not helpful other than they make the people feel good who made correct predictions in the past. My own opinion, and one I've voiced since writing here is we are going to peak sooner (as opposed to later) and the longer we remain on a plateau a)the more opportunity we have to make important infrastructure changes and b)the steeper the ultimate decline rate will be. Of course todays announcement is newsworthy to this community. Lets discuss it, get over its novelty, and quickly move forward towards discussing solutions, if any. I think the peak oil community is a good canary for peak oil itself - the smart, strongly confident in their own beliefs, cooperative/competitive nature of the people and discussions here, and how they play out over time (some people leave, some new ones show up) are a good precursor for what human interaction might look like when statistics become more than academic. (this is my prediction....;-)
During George Bush's first four term, we consumed about 10% of all crude oil (C+C) ever consumed.
Based on Deffeyes' model, during Bush's second four term term we will consume about 10% of all remaining conventional crude oil reserves.
As noted above, if we use 5/05 as the index month, the cumulative shortfall (conventional + nonconventional) has shrunk slightly, from about 760 mb to about 754 mb.
Nate wrote:
Nate, this dopamine obsession of yours is becoming very predictable!! ;-)
I think in the intervening years, we witnessed a decent part of the solution: high prices ..... which helped reverse the decline and has begun to prompt adjustment.
But my sniping here has a serious point. For real world responses to oil depletion timing matters (Jevons). So does the shape of the production curve. So do prices.
A related important point:
1. We now know the market rose dramatically in the years before the peak (whenever it turns out to have occurred).No matter what your view of when peak oil will occur, you have to concede that the market responded before peak occurred. Prices rose to unprecedented levels. One can't say the market was blind sided by peak oil. It has responded in advance for several years now.
I'll raise other points later when time permits.
thats a good point.
However I will counter with these:
The data released today are within any statistical parameter of 'equality' for gross C+C. The market, IMO, is driven by actual demand. If the energy sector itself has used an increasingly higher fraction of world oil and gas production,(and we don't have data to prove or disprove this hypothesis), then its possible (and anecdotally, I might say 'likely'), that we have passed peak 'net energy', which explains the 1000% price increase since 1999. By definition, the peak in the net of the resource will occur before the peak of the gross, if any of the resource itself is cannabilized in its own production. IOW, the market will react to Peak Availability, not Peak Production.
And on another topic, even though the 'market' has risen essentially 9 years in a row, the 'pundits' that are constantly reshuffled in the major media have consistently said that it was a short term phenomenon and that prices would go back down (until maybe recently). So what do policymakers and corporate leaders do when oil is higher than they've ever seen before but 'professional' authority figures keep claiming that its the 'speculators', or 'above ground factors' or 'those pesky kids at theoildrum' causing the temporary price rise. In other words, for the market to be effective, in the sense that you infer, we need permanent expectation of higher energy prices, not just higher energy prices.
I think that goes way too far. For instance, I would agree with Charles Hall that high oil prices helped deflate the housing market. And, as it turns out, one of the biggest needed adaptations to oil depletion is to scale back suburbia or at least sharply curtail it's growth. (We are right on schedule! Pre-peak, too!)
You are a philosopher, so you like to emphasize the cognitive element. But, though it would help, it isn't actually necessary that the rank and file understand peak oil in order to adapt to it in their behavior, especially if credit is contracting. For instance, most of the mortgage eligibility models I've seen take monthly energy bills into consideration. Your banker may never have heard of peak oil, but he's reacting to it.
I agree with all that (except the philosopher part). What I meant was that the energy market is similar to the bond market in that it prices in not actual inflation but expected inflation. Crude markets technically are unlimited by how steep of contango there can be due to limited storage - so even though 2016 oil is over $100, its barely over $100 - if market expected true peak and its consequences, it would be far higher.
(regarding philosopher - next week marks the opening of the floodgates for my peer-reviewed lit! And just in time for them not to matter...;-)
well, more like small-scale hydro at first but stay tuned.
Nate Hagans wrote:
That is interesting.
But if you're right, it would seem that net energy is then already captured in market dynamics. i.e. Falling EROI would be less likely to cause us to succumb to a boiled frog syndrome where something we can't detect kills us (because we don't bother to measure it).
In other words, the economic frog dies if prices fail to tell it that it has to react to something important. But what if EROI always shows up in prices via reduced availability?
BTW, I discovered a couple of weeks back that the Canadian government provides estimates of consumption by energy producers. They have estimates for 1990 and for 2001-2006. Thus a very narrow measure of EROI can be calculated. It's not declining. Arguably it's rising.
Source:
http://www.statcan.ca/bsolc/english/bsolc?catno=57-003-XWE
They have also (as of 2006 I believe) begun breaking down producer consumption into the various forms of energy being eaten.
Obviously they are not counting the energy needed to manufacture equipment, transport workers to and from work etc. Still, it's an interesting measure.
EDIT: It should be noted that the graph above is misleading because although the data is missing for 1991-2000, there is a line connecting '90 with '01 . My skills with Excel are primitive and I haven't figured out how to leave the line out for the missing years.
The Economist has no clothes, and neither does the market.
http://science-community.sciam.com/topic/Economist-Clothes/Economist-Clo...
Neither is rational. Interpreting PO, or anything else, via market dynamics is a bit like the proverbial blind men describing the elephant.
We are seeing, and we will continue to see (at least for a while), a net increase in nonconventional oil production, in response to higher oil prices.
But several relevant post-peak case histories, chief among them Texas and the North Sea, show no conventional production response in response to higher oil prices--quite the opposite. The initial Texas decline occurred despite a ten fold increase in oil prices. The initial North Sea decline has occurred despite a four fold increase in oil prices.
Texas & the North Sea were developed by private companies, using the best available technology, with virtually no restrictions on drilling.
The question is, can increasing nonconventional oil production offset declining conventional production? In my opinion, the answer is no. And in any case, the net export decline marches on.
Yes, Westexas, these are still the strongest arguments in the arsenal. If we are talking true geological peak, then price and logistics simply cannot extract what is no longer available in extractable quantity. All the money and effort in the world will not matter.
We all know that day must come for every field, and then for the world when we are discussing conventional oil. Why shouldn't it occur today? Or yesterday? Or thirty years from now? No one date is better than the other, but the outcome of a world peak TODAY is very painful to think about, so most folks assume that yes the day will come, but...it's not today. They have no way of knowing, but it JUST CAN'T BE TODAY!
We are safer to assume that it could be today and begin making the changes as if it were. If it is not today, we will only be more prepared when the day does come. Tomorrow? The next day?
No day is exempt.
RC
It's a bit like arguments historians have about "what was the turning point of WWII?" Believe me, it's a matter of some heated argument.
But just imagine how heated the argument would have been at the time...
Which front? Eastern front was Stalingrad. Pacific was Midway. I can't recall reading or hearing about any conflicting opinions for those two. The Western European theatre is a bit more difficult, but I'd say it was El Alamein.
As to the date of Peak Oil output, it really doesn't matter. We're close enough, at this point, that any effort to cushion the eventual shock will almost certaily be less than successful. Oh, well.
The turning point on the western front came when Hitler declared war on the USA. Or was it when P-51s were dogfighting over Berlin? Or was it the Battle of Britain? That southern sideshow in the Egyptian desert didn't settle much of anything on the western front. It was good for Montgomery's ego though.
Peak Oil will be different. It will become an unheated argument and an un-air conditioned argument.
Personally, I prefer the arachidonoylethanolamide or "anandamide" rush over dopamine or serotonin, but that's just me. ;)
I agree with b) but not with a). All that prolonging the plateau accomplishes is to make AGW worse. Good post tho, overall.
Interesting. I'd pass them both up for an oxytocin rush.
I agree with both a) and b) but see the likelihood of a) happening to be negligible. Even among those who agree that we could change infrastructure to accommodate alternatives, the debate over how to do it would then create the same spiraling dopamine rush/let down for the winners and losers. It's like a nested system.
My psychiatrist friend thinks that I may be an oxytocin seeker. Not a bad thing :-)
Alan
When do you anticipate such a discussion beginning? The key point is how to create an economic and political system that is dedicated to the long term preservation the true sources of our wealth rather than to the short term accumulation of private fortunes. Over the better part of a year that I have been visiting this site I do not seem to recall any articles discussing this subject. You mention from time to time (which I appreciate) the necessity of ending the paradigm of conspicuous consumption. But, in fact, the eventual necessity of such a paradigm shift has been obvious for decades to anyone capable of seeing beyond the end of his or her own nose. The question is how to bring about such a paradigm shift. Unless we are going to go all the way back to Neolithic technology and small tribal groupings as the fundamental social unit, then such a paradigm shift will involve major changes in social organization and a redistribution of political power at a macro level. This fact was evident to me thirty seconds after I became convinced that peak oil was a near term problem.
Even the people who emphasize reduction of ecological footprint and the end to conspicuous consumption seem to think that the future will look a lot like the present except for a change of scale with respect to resource consumption. I doubt very much that such will be the case. As long as the future security of the nuclear family depends primarily on how much value they can store up in exchange for their economic production, a strong tendency to try to grow output as rapidly as possible will continue to exist. In my view voluntary simplicity and mutual support must go together if a true ecological economy is to emerge. The emphasis on mutual support requires fundamental structural social changes and not just a change of scale. If a competitive instinct is indeed an ineradicable part of human nature we must find some other sphere of action for it than in earning our daily bread. If such redirection is not possible, then no solution exists and we should find something better to do than engage in endless circular discussions on this web site.
It does seem that all that is done is to chip away at the edges while not even talking about the core that needs to be done.
Roger that Roger. We are sympatico.
Here is an interesting example that tangentially shows me how close we are yet how so far away.
Today one of my best friends called from airport on way back from Vegas. I don't know precisely but he is mortgage trader and makes between 500k-1 mil per year. His portfolio is easily 4-5 million, meaning the daily swings in value of his 'net worth' (measured how society currently measures it) probably changes easily by 50,000 per day, perhaps more. Today he called all excited that he was at a craps table last night where he was down $600 and then some 'shooter' got hot and rolled for 25 minutes and he ended up actually winning $500 - an $1100 swing. He told me about the camaraderie around the table and how much fun it was - we spent the entire 5 minutes talking about this experience (we've played craps in Vegas together before). The entire time we were on the phone he never asked where the market was, where his stocks were (I know he owns several hundred thousand in some oil stocks), where oil and natural gas were etc.
The point of this little story is we, individually, and collectively as society are penny wise and pound foolish. His 'brain' didn't understand that the amount he would make or lose playing craps for 3 hours was the rounding error on a bid ask spread of his hourly portfolio movement. He got the same (and I would argue higher) 'utility' from the social/gaming experience of very small stakes as he did when he was sitting at the office looking at his (much higher value) stocks go up. This example is a microcosm of what is happening with our energy use. We are so USED to using energy profligately, and in fact, much of our infrastructure is dependent upon it, that we don't realize what's right in front of our noses - that social interaction, natural beauty, friendly competition, and extended family relationships are what make us most content and happy, (once our basic needs are met of course).
This is clear to me. What is not clear is how to get from here to there, but it will have to start with changes in our institutions, and the economic system will have to be tweaked if not altogether chucked. The first symptoms of peak oil as well as the credit crisis is going to be the disappearance of the middle class. As the GINI coefficient rises, some people will realize that the 'american dream' may not actually be attainable by anyone who works hard, etc. We better have some changes in place before this trend escalates, otherwise we are talking revolution, not between countries, but within.
I've spent the last 3 years honing in on the problems - on the supply side -declining net energy and energy quality for our current infrastructure - on the demand side: conspicuous displays of consumption being consistent with biological relative fitness (peacock tails), modern stimulation hijacking our neural reward systems, and the total collapse of a core tenet of walrasian welfare economics - that we are rational actors. This combined with dozens of human cognitive foibles showing how we deny problems, only act if its urgent, believe in hope and authority figures over science and facts, etc. I still don't have any 'answers' to the puzzle, but you are right, it's now or never to make big changes. How do we get from here -to where you see us having a chance Roger?
This is the same error virtually everyone makes. Our institutions are not alive. They are not people. They don't change. We do. The economic system is not a living thing. It cannot change. We can.
There are no changes that do not begin in a mirror somewhere. The sooner people stop externalizing the necessary changes, the sooner they can happen.
Look at the state of the US as the perfect example. How can Dumbya and Dick still be in office given the many and varied ways they have broken the law and violated the Constitution? We don't stand. We keep waiting for the politicians to do something. We are collectively afraid to act. We fear the IRS, the FBI, the draft, the NSA, the CIA... we fear our own troops.
But, if Americans wanted change more than they wanted their McD's, all we'd have to do is walk outside and simply refuse to participate in the economy until the politicians acted as we tell them to.
Done. That easy.
But the system is complex and the nodes (us) not closely connected. We don't trust each other to act, along with always expecting someone else to do it because we are just too busy, too vulnerable, too.... something.
So... do we have a snowball's chance in hell? Not really. At least, not to create a world I'm excited about living in. If this civilization continues on intact, we have already lost. And have already failed. We will have allowed power to concentrate further and will have given up our rights to self-determination.
You can look at this any way you want: complexity, chaotic systems, collapse theories, entropy, natural cycles... they all lead to the same conclusion. We have reached a tipping point in history, not just climate and not just energy. A bifurcation is happening/has happened. How quickly it comes back into a more linear movement is anybody's guess. But as long as *we* exist in BAU mode (keep eating our Big Macs), it won't even matter because the world you end up in won't be worth much.
And, where in history do you see large communities of people, that is, nations, living sustainably? How do you overcome our seemingly inherent need to compete, to acquire, to dominate, to.... win? Of course, you don't. This is why societes always collapse. Either from within due to the above factors or from without due to the same. You only see sustainable living in small clusters of people. This is why the localizing is *the* only answer that can ultimately succeed. Should we be able to transition to localized living on a global scale, might we be able to keep loose connections/cooperation/development alive via a surviving internet? If we don't reorganize into larger geopolitical groups, but maintain communication and share knowledge, might we overcome the imperatives discussed above? Maybe.
I forget who it was - perhaps it was Diamond? - that said once we get above about 150 or so people in a community, we lose cohesion because we simply cannot maintain meaningful human connection with a larger group of people.
This is an important metric to consider. It may be *the* limiting principle of the human condition.
Cheers
Here is some history for you:
I don't know about you, but I am not getting a very warm feeling that the argument 'If an event has not happened in a long period of time it can never happen' is valid, at least not in the realm of the development of the capabilities of living beings. Of course the above observations do not prove that cooperative, egalitarian, large scale economic production will occur or is even likely to occur, but I reject absolutely the idea that history has 'proven' that such a form of human social organization is impossible.
One thing is certain: Such a social transformation will not take place unless a sizable group of people spends time thinking about the nature of economic production and says to themselves, "This idea makes sense. Why don't we make an attempt to bring about such a transformation of society?" If we just throw up our hands and claim that we know a-priori that any such attempt must inevitably fail, then our doom is 100% certain. Personally I will take 99% over 100% any day of the week.
None of what you said is what I said. To wit:
You said:
but I had said:
Let me simplify, since my previous was misunderstood:
Societal change doesn't happen by people expecting someone or something *else* to change. In counseling, for example, taking responsibility for one's self is vitally important. If that step doesn't occur, the change doesn't occur. Important to this is how we talk and self-talk. Words have meaning. They influence thought. And vice-versa. Thus, we encourage self-talk that encourages responsibility and action.
"They" gets nothing done. "I" and "we" do. Nate said, and this is, for me, the *key* sentence in his post:
Let me change it:
You may consider this a minor point. I don't. Nate is a smart guy. He knows this, I'm sure. (He has a post further down where he may have already addressed this, but I haven't read it yet.) This reinforces my point. Talking about things with an externalized frame of reference has become habit. It is a symptom of the lack of connection between people and their institutions. Ultimately, it is a symptom of collapse.
Cheers
I have no argument with this statement. The economic and political system as it exists today is the creation of our collective cowardess and greed. If it is possible for signficant change to occur with the political context of the current nation-state it will be because a majority of the population has gone to the streets to demand change and not because some technocrats in the capitol have tweaked the economy.
However, I am skeptical about localization as a mantra for a sustainable world order. There is a difference between localization and simplification/decentralization. True localization would mean a return to neolithic technology (not every little bioregion is going to have access to high quality metal ores) and a probable return of illiteracy, since even paper making and printing require a substantial specialization of labor. If the internet is going to survive we will need semiconductor manfacturing which is not going to occur in the context of a truly localized world. I am very much in favor of creating strongly knit local communities, but if we cannot also figure out a way to create cooperative communities at larger levels then we will end up losing all of civilization, both both the bad aspects and the good. Some people maintain that you cannot have one without the other, so good riddance and welcome the stone age. I am not ready to take such an extreme view.
I've changed. I quit my high paying job, with not nearly enough money to retire on, and now make $22,000 a year on a grad research assistanceship while my friends and peer group are all millionaires. I did this because I learned about all this stuff and wanted to do something more meaningful than make rich people richer. I'm no saint, but I HAVE changed and I've never been happier in my life. (n=1) (btw -when looking in the mirror I notice a little paunch - due to now living in the Cheese state and too much time on this website)
You refer to Dunbars number
I've no doubt you have made changes. Just being active here is a big change. That is not my point. We cannot only act with intention, we must think and speak that way, too. When we speak to others about change, we need to speak with the knowledge that we are modeling behavior. I said above (with an edit):
Thanks for the reminder on Dunbar.
Cheers
I think that with world crude production at 73,807 m/b/d in 2005, and 07 coming in at 73,275 m/b/d, we have moved the peak oil bar to a yearly basis of comparison. We have three straight years of data to make conclusions on. When the US peaked, it took five years of data to win a solid majority of analysts to the peak side. We now have 36 years of data. We don't know if some production numbers came out of inventory in OPEC's January numbers. After all, OPEC doesn't want people freezing in the winter. What OPEC does want is for the Iraq war to end, higher interest rates in the US, and a higher dollar to lower the galloping inflation in their countries caused by the US Fed's reckless reduction in rates.
The January data shows Mexico, Norway and the North Sea as real decliners. It also shows Angola and Azerbaizhan as big performers. Future gains in these stallworths are forecasted to be at much slower rates. Russia and China numbers also raise questions. And lest we forget, exports of crude in the world have likely fallen over 1.5 m/b/d over the last two years. Given the above scenario, hoarding or cartel high pricing is in vogue because demand exceeds supply at present and in the near foreseeable future.
Assuming the new record holds...
I think this "record" needs some legs. The data gets revised (usually downward) much of the time.
By-the-by, what makes this particular number any more reliable than the unemployment, inflation or money supply data the government has been "managing"?
Why do you say, "the data gets revised (usually downward) much of the time"?
Do you have any data to support that statement? How do you know it doesn't get revised up most of the time?
Khebab posted a study of EIA data that showed the general downward trend of revisions, with time.
I've looked at it a while back on a limited dataset (~3 years):
http://www.theoildrum.com/story/2006/10/1/233347/717
It seems that in average the monthly estimate for C+C becomes stationary after two years and is around 300 kbpd lower than the initial estimate (month 0):
Thanks for this excellent graph and the link. But I notice that this was done with data that is 21 months old.
I just did a quick excercise with the same data but from the most previous 2 years and found the opposite. Average increases of 100 kbpd of final versus initial estimates.
Interesting, it means that I have to revisit that post.
These are not the droids you're looking for... Move along.
I propose a new term to describe oil production between May 05 and Jan 08.
Let's call it an
undulation.Or, as noted above, a multi-hundred million barrel shortfall, despite the highest nominal oil prices in history, which in the past year have shown an annual rate of increase of over 50%/year.
Kool Aid? Q'est que c'est? Was'n das? Here's a link for international readers explaining this:
http://en.wikipedia.org/wiki/Koolaid
scroll down to the part "Drinking the Kool-Aid"
thank you.
I am too americentric. But americans are 65% of our viewership. (and about 65% of the problem....)
I was going to retort "you mean, we contribute 25% of the problem", but then I thought about all of the cultural factors where most of the world wants to emulate our penchant for large houses, large vehicles, large TVs, etc, on top of the overt resistance to making changes in GHG emissions, and suddenly 65% looked a little on the low side...
Yup!
But it also means we have 65% of the responsibility and opportunity to navigate a way forward.
Per capita your Canadian viewership is double your USA numbers.
Well, whatever the Jan 2008 figure, the Mar/Apr 2008 figure will very likely be lower. The fighting in Basra claimed a pipeline in late March, it's up and repaired at the moment but is a prime target - they lost I think it was 800,000bbl/day for a bit. And of course MEND in Nigeria haven't stopped their activity just because their leader is on trial, quite the contrary.
Is there any merit to this? I didn't surf the site to see if anybody'd commented on it yet:
http://www.classicalvalues.com/archives/2008/04/south_dakota_di.html
Net of it is: Two hundred billion barrels of oil have been discovered in North Dakota
nevermind...found the report on that thread...
"3 to 4.3 Billion Barrels of Technically Recoverable Oil Assessed in North Dakota and Montana’s Bakken Formation—25 Times More Than 1995 Estimate—"
Big deal.
I understand the preoccupation with the date of peak. Many of us have a little anxiety about oil depletion and want to know when the axe will fall. The question I have is how productive this preoccupation is when "experts" attribute all price increases of oil to above ground factors such as market manipulation, falling dollar, etc. In order for the population to change its behavior, they must believe that there is a strong connection between oil depletion and price.
Rather than focussing on peak dates, since we will only likely know the approximate peak time a few years after its occurrence, let's focus on establishing the connection in the public's mind between price and physical limitations. Let's establish that easy oil is gone and only more expensive, harder to find and refine oil is left. Let's focus on years of flat production despite increases in prices. This evidence is more secure and more likely to penetrate public consciousness than multiple instances of errant predictions of peak date.
I'm just waiting for the signal!
I don't think the actual date of the peak has much to do with "when the ax will fall." The ax has already fallen in many developing nations. For us, the question will be how long we can keep outbidding others for oil.
And despite the current financial crisis, I think it might go on for some time.
It depends on who you mean by 'we', Leanan. My neighbour's rich relations in India will easily outbid most North Americans.
Over time though it is the 'grouping' which can most successfully add economic value per unit of oil consumption, which wins the bidding war. This is why efficient energy producers, food and fuel, will outlast producers and traders of non-essentials, however efficient, in the competition for the remaining oil. Economies are built also on the production, distribution and consumption of desired non-essentials. So, as there will be oil available in excess of that required for food production and for the production of non-food energy, there will be competition between 'regional' bidders, as well as sectorial bidders.
I don't see the US as a whole remaining particularly competitive, especially vis a vis more socially coherent societies. By way of example, Canadian auto plants are more competitive than US plants, thanks in large part to the efficiencies of socialized medicine.
Are walmart wages going to maintain US competitive fitness? Can the US lower labour costs to Chindian levels? Are working US americans going to give up the few holidays they currently enjoy? And how low do labour costs have to plunge before the US can push Chindia to the back of the oil purchasing queue?
For the US to stay in the bidding game for oil, a cheap labour strategy is not likely to work. Given its starting position, the US has to play the game by the rules of other advanced industrial nations. It needs to: lower the cost of illness and injury, most likely through some version of socialized medicine; lower the cost of transportation, most likely through increased regulation and public investment in mass transit: lower the cost of crime, most likely through investment in the identification of children at risk, through increased aid to families and through less and shorter periods of incarceration; overhaul the education system in favour of lifelong learning; and so on...
In the short term anyway, the US appears to be too ideologically hidebound to initiate the necessary reforms. Not to mention the deeply entrenched and widespread paranoia, evident even on this blog in the sad, and ultimately futile, discussions of guns and ammo. I hope I'm wrong. Maybe Obama and some thousands of other less known agents of change can lead you folks away from the abyss of racial and class strife to which the messianic and the greedy have led your nation.
I hope I don't sound like a smug Canadian. Many of us are shamed by the mostly hidden poverty around us, especially among first nations people. Our post-secondary system is sad. Our socialized medicine is not as efficient as France's and I could go on. And some people here like to talk about higher average US incomes (though this is changing with currency revaluation). I tell them to take the top ten percent in terms of income and wealth of all industrialized countries out of the equasion and then do the comparison.
This little uptick is very good news as far as I'm concerned. Since I'm firmly in the no solutions camp, all I want to see is BAU go on for as long as possible. My wife and have booked a dream vacation to Italy in June, so I would hate to see any catastrophes happen before then. I've got all my post-SHTF preps done so I'm as ready for TEOTWAWKI as I'll ever be.
My models show Italian gasoline and refined product imports dropping 27% from May to June 08.
Seriously? What are the models based on?
Im kidding. Solardude is a friend of mine from Vermont so I was just busting him...I wish him and his wife a wonderful vacation. sorry for the dark humor..
Ah, I thought you must be joking.
RE: 95% confidence interval
Shameful BS.
The theory behind this statistical term relies on some basic assumptions.
1) You are polling a smaller group, and using results to infer the behavior of a larger group. At a minimum, the larger group participates in controlling the outcome.
e.g The election predicting scenario
This does not apply to the data shown, because the neither applicable group (the experts polled nor the larger group of analysts they represent) controls the supply. They are merely guessing the supply. The "confidence interval" is in this case a discovery of the most likely opinion, in the case that many were to analyze currently available data. It has no mathematical relation to the actual future oil supply.
2) You are using records of past outcomes to predict future outcomes.
Also does not apply. In that case oil supply would continuosly rise to meet increasing demand.
Remove those ugly dotted lines!
Re: The "confidence interval" is in this case a discovery of the most likely opinion.
so much anger :).
Your mostly right.
The goal of the "confidence interval" was to illustrate the large uncertainty existing among forecasts. I used only forecasts that are seeing a peak in the near future so this interval does not reflect variability among no-visible peak forecasts. Mixing the two kind would have made this interval completely meaningless. Also, most forecasts are dealing with production capacity and not actual supply.
Don't know if this thread is still alive, but if so sorry for the anger content.
I work with data a lot, and get particular about the subject.
I think the chart misuses that tool.
The no-name Name does not understand that some sort of model underlies all of these curves. For the "election polling" analogy Name brings up, no human behavioral model exists and yes indeed the projections are bootstrapped from a smaller subset and one can only use pure statistics to project error margins.
I find confidence intervals like Khebab presented perfectly valid. The "truth" about a situation may indeed converge with more and more physical behavioral models applied from sources of various breadths of knowledge.
I'm guessing hubble telescope is not your actual name.
Mine is Kevin.
I do understand that a model underlies the curves.
One can not use statistics based on those models to measure the error margins of the actual oil supply, only error margin you would assume for the resulting projections when N new studies are started based on the same range of assumptions.
Statistics based on models built on historical behavior are what helped create the current situation in the US mortgage backed security market.
Good point. They are also what built the underlying tenets of our economic system.
Arguable point. Those financial models were made to pry money out of people's pockets, i.e. Black-Scholes and others.
Explain what motivations that the TOD "amateurs" have in coming up with models which describe oil depletion. For the most part, it amounts to finding out the truth.
Just the other day, Gail was actually able to get someone from EIA to admit that their models are basically regurgitations of demand forecasts. So the production model came directly from the demand forecasts. How unscientific can the industry get?
The other thing is that Name has quite a narrow view of what Statistics can do. Whenever I can I will place a "Probability and" in front of Statistics and this is where the real power comes in.
I agree that the TOD amateurs are searching for the truth, but we also are not conforming to the classical economic model in that we are doing it for free (unless subliminally we are all doing it to impress people to get better jobs, which I don't believe is the case).
In any case, I wasn't really disagreeing with you, just taking the opportunity to point out that economics is a classic example of Post Hoc ergo Propter Hoc reasoning. The 'correlations' that have shown to be true in economics have all been in an era of rising energy gain. Economics (as is) will be eventually shown to not be a 'science' but just correlations that worked during a certain passing environment. It would be benefical if this was recognized ahead of time.
So that classical economics rely an unending supply of cheap energy and resources to allow them to make the strange premise that production would always meet demand, given the right monetary incentive. But now, the TODSters are finding that metaEconomic, i.e. Scientific, models may be the way to go. And as you say, this aint going to make us any money.
The same is true of Ecology. Standard models are predicated on work done on temperate ecosystems by American & Western European males in the 20th century. Furthermore, they only apply to interfluvial conditions during a mass extinction pulse. Current models may not apply to the tropics, to a world warming at unprecidented rate, to the past or to the future. Keep this in mind when evaluating the ideas of Odum & Hall, et al. If you don't trust Neoclassical Economics, you shouldn't trust contemporary Ecology, either.
Thanks for this reference to Odum & Hall. Thinking of extinction dynamics gave me a lot of insight into how oil depletion plays itself out. Seeking oil is like hunting down every last passenger pigeon, but without the "benefit" of having the prey able to reproduce fast enough or adapt fast enough to avoid going completely extinct.
In other words, if you think the passenger pigeon didn't stand a chance, think about the poor little oil molecule.
Longtime lurker, first time poster.
With regards to the recent uptick in production, I have been looking for that. My expectation is that the world peak will NOT have the same characteristics as a regional peak. Regional peaks are based on geologic, economic and other factors, but they are not based on survival. In addition to the other factors, the world peak of oil production is also a matter of survival, and as such one must expect an uptick in production off the back end of the nice rounded peak, as future production is sacrificed for the sake of present need (referred to as ‘pulling out all the stops’). I believe that is what we are seeing coming to fruition now and because of logistical constraints, I expect that it will not be able to last any longer than 6 months.
Offsetting factors: the Lower 48 in the Seventies didn't have any material amount of nonconventional oil production, while the world will not be drilled to nearly the same density as the Lower 48.
Another factor: Memmel thinks that high tech horizontal wells have accelerated forward in time production which would normally be in the second half, which implies a steep decline rate.
Based on drilling and production methods in the US at the time, I consider the lower 48 production profile irrelevant when considering a world peak. Original vertical wells are the reason the lower 48 US has a soft peak with fat-tail decline profile; whereas because we are in survival mode with tertiary production methods, the world production decline will have a sharp peak before drop with a much thinner tail.
I agree with Memmel.
Have you seen any data showing what percentage of production is produced with tertiary versus conventional production methods?
I seem to recall a post a while back arguing that while one would expect this to eventually occur, production data isn't broken out by type of well so pinning this down is harder than it seems.
And here in lies the real answer to whether it would be better to stay on the plateau or come off of it. If, by staying on the plateau, we are producing tomorrows oil today and this will increase the decline rate then we are better off declining now. On the other hand, if we are staying on the plateau because there is more oil in the ground and the increased production is not changing future decline rate, then we are better off prolonging it.
This is easy enough to answer using price as a metric. Assuming advanced extraction methods allowed us to basically double the depletion rate. I use the case of going from 5% depletion to 10% depletion as a bench mark. And assume that production remains high to say to 80% to keep the math simple. Then the price of oil would remain low till you hit the 80% mark. If you really were also getting a higher recovery factors that where significant say 10% then your doing even better. But if this is true the price of oil would remain low well past estimated reserves. Pick a number 2000GB 3000GB etc does not matter its a lot more oil then we have extracted to date which is around 1100-1150 GB.
In short oil should still be dirt cheap and remain so for some time.
Its not.
So the price signal indicates that two things are probably true if you willing to assume we where able to double our depletion rates and keep production fairly constant out well past 50% URR. The exact numbers are not important.
1.) We probably don't really have anywhere near 2000GB of reserves or at least not in a form that can be extracted rapidly. What ever we have left will have low production rates vs reserves (tar sands)
2.) Overall % increases in recovery have not been significant since they would have depressed prices.
3.) Considering we have plenty of example of the use of advanced extraction technology that can increase production rates then the last few years should have spurred deployment of it. So if we were at 50% URR and if we have not used the technology we have today then we should have been able to get one more technical move upwards before final peak this include wider deployment of tertiary extraction with meaningful production. This has not happened.
To disprove all this you have to assume that despite all our technical advances they really haven't changed production all that much since the 1970's if this was true then we would not have invested billions and decades of work into developing them. To prove a asymmetric peak you have to show we have systematically increased extraction rates for decades. It takes a long time to pull enough oil from the backside to the front side of production to significantly change post peak production.
We would have had to over produces by at least 20-25%. This is something like 100-200GB of oil or the equivalent of one of our large producing regions like the US. Its a big number. Big enough it looks like to cause a good bit of the oil industry and many of the worlds governments to dismiss peak oil.
If its less then this then it has little effect on post peak production but this implies that technology advancement since the 1970's has had little effect.
So you have three basic scenarios.
1.) Peak oil in the distant future we are on a decades long plateau or slowly increasing slope pick your argument the explain how the current stall in production increases is some sort of blip for whatever argument your using.
2.) Considering we have probably spent more on oil extraction then any other human endevour for our entire species history, technology has had a minimal effect and we have a symmetric peak.
Maybe you can show that increased depletion rates and increases in extraction efficiency are for some reason balanced. This could be simple coincidence.
3.) Peak now is real but the primary effect of technology was to allow us to extract oil over the last decades that would have been produced post peak in the symmetric case. This leads to plateau then steep decline.
Which ever scenario you choose to really change things you have to realize your dealing with a big number thats wrong the mistake is on the order of 100-500GB it takes a big change in URR to discount any of the three scenarios.
The simplest answer is that technology has had a big effect but primarily in increased extraction rates so our investment in advancing oil technology has paid off. If not then we would not have kept pouring money into oil extraction technology over the years.
However peak now indicates that claims of increased recovery are probably not true or at least not true at high production rates.
Thus reserve estimates based on enhanced recovery expectations must be terribly wrong either about the amount recovered or the rate it can be recovered at.
Most of the reserve increases since the 1980's have been backdating of previous discoveries based on expectation of higher extraction rates for one reason or another.
Just a note to say that I find your arguments wholly persuasive.
Thanks for the analysis.
mike
I have wanted for some time to write a post on maximum power principle and our penchant to borrow from the second half of the curve, but have no time. I too think your observation is spot on and I fear choice #3 is the reality. If you would be able to write this up as a guest post let me know.
No problem let me know when. Just email me.
http://en.wikipedia.org/wiki/Maximum_power_principle
Defined as the maximum rate of useful energy transformation
The maximum power principal neatly ties together the related concepts of EROI and technical refinement.
And other words as you get better at doing something the cost of getting better increases over time.
The cost measure in my case is that we have gotten better at extracting a finite resource at a high rate making it exponentially harder to do so in the future as we have both physically less of the resource and its harder to extract. So my arguments and EROI arguments are tightly related and the underlying reason is as Nate notes maximum power.
Now whats interesting is I'm getting the result that as we have approached the restrictions of maximum power estimates that don't include it diverge significantly from the result I'm getting.
So for oil I'm saying 1250-1500GB of recoverable oil of interest.
The common result for the symmetric case is 2000GB and of course he have even higher less reasonable estimates. But the striking thing is 500-750GB or about a 25% - 40% overestimate. This is a big number more optimistic projections are even worse.
So it seems that by ignoring maximum power you can get pretty far off in your predictions.
So maybe using Jacobi's version is clearer.
http://en.wikipedia.org/wiki/Moritz_von_Jacobi#Jacobi.27s_Law
"Maximum power is transferred when the internal resistance of the source equals the resistance of the load, when the external resistance can be varied, and the internal resistance is constant."
Lets say external resistance is demand for oil and it can be varied up and down right now its been varied up but its exceeded the abilities to supply the oil considered constant.
Oil supply could have been flat since the 1980's since either because we have had enough reserves or via techical progress we have been able to supply as much oil as the market wanted. This is my constant source or flat capacity plateau for decades.
Only recently have we crossed over and passed the maximum power threshold. This is why EROI concepts have popped up. Its pretty obvious that we are no longer at maximum power.
And further more oil is very much like a battery you can get a constant power out across a lot of the charge range right to the end. So a batter powered maximum power circuit is a good model.
Say something like this for a lead acid battery.
http://en.wikipedia.org/wiki/Peukert%27s_law
In fact this principal was revived during the 1970's oil crisis. From the wiki link.
My argument is pretty simple since we are having maximum power issues or EROI issues with oil extraction then we must have been optimizing extraction rates for a LONG time. Which means we have robbed the second half of a assumed symmetric production profile. If you read the links about maximum power its part of the concept.
You can also see that Jevons Paradox or the tragedy of the commons is in essence simply the maximum power principal.
Here is another good link.
http://www.eoearth.org/article/Value_theory
And finally to close this post off because I think I've stolen a good start for a key post :)
We would not be exploiting low EROI resources like the tar sands unless we have seriously degraded the EROI of our remaining oil stocks. This means that the amount of oil remaining that can be produced at a high EROI which is pretty much the same as high production rate is very low.
Sometimes we call this easy oil. But the point is once the easy oil is gone production rates plummet and so does EROI thus world production will not be symmetric post peak.
Also West Texas's Export Land Model is not unrelated this can be seen via the relationship between export land and Jevons Paradox the commons if you will has moved from the oil importing nations to the oil producing nations they are now internalizing oil usage to extract maximum power. They can do this because the high profit margins are allowing them to grow even with a significant portion of the returns bleed off by the elite. So Export land can be seen as a sort of shift of the commons from the importers to the exporters. They are late to the party but none the less hell bent on joining.
Maybe call it Jevons Paradoxically Movable Feast Principal if you think Export Land is to simple :)
Its not incorrect to consider Export Land as a rapid decline in EROI for the importers since growth in the exporting countries is quickly draining the real EROI of the importing countries.
Again its all related and it all signals that EROI should decline rapidly and with it production.
Interesting that the Maximum Power Principle doesn't really apply for current electrical applications. By clever use of switching power supplies and using inductance and capacitance, much higher efficiency can be achieved and no longer does R_load have to equal R_internal. If TOD's EngineerPoet shows up, he can explain it to you in more detail.
In any case, I would like to see some math worked up to show how this could apply.
Would it not simply be another shock in the shock model ?
But how in the hell to you measure it. We can't even get EROI right.
http://en.wikipedia.org/wiki/Emergy
This is not a bad approach but the solar energy embodied in oil is huge vs other power sources.
I guess we could say its the btu equivalent to say sugar cane or soybeans then translate to the latent solar power but this get involved in the energy loss of processing both forms.
So maybe use a PV as the baseline ? This sort of route is what seems to have been generally taken.
The definition of emergy
But ...
So maybe one way to explain is the EROI is in a sense incomplete. It does not encompass time.
For example lets say you raise corn in a field three years in a row. The EROI_t or empower of the third crop is much higher than the first crop. The forth year you will get a dismal crop.
From a oil perspective the energy embodied in extraction of the last barrel of oil from a well is higher than the first barrel. EROI is flawed because it is missing the emergy concept.
To use my multiple crops example the EROI does not change much over three years but the emergy has taken a nose dive by the fourth year. This is what people who look at EROI are worried about and the calculations of EROI don't embody the key concept.
My electrical example was a bit of sleight of hand since you can measure all this in a electric circuit. Another way to look at it is you have increased the probability of failure. Its the difference between a brand new car and a 20 year old car. What are the physical units for this quantity ?
I honestly don't know how to apply this quantitatively to oil production. I'm assuming we will first introduce these concepts and take a shot at a simple calculation.
But to put the quanative side to rest for a bit. Its pretty obvious when you look at it that oil has a emergy ratio of like 1000:1 to corn ethanol its orders of magnitude greater. Its like comparing a nuclear bomb to chemical explosives as tons of tnt. Oil is the bomb dude :)
And in my opinion the emergy content of our crude production has already dropped rapidly. EROI approaches are not capturing the real situation. Oil follows my corn field analogy. Although its got fantastic emergy since its a big input in its own production the empower produced drops rapidly.
I honestly don't know how to apply this quantitatively to oil production. I'm assuming we will first introduce these concepts and take a shot at a simple calculation.
OK, here is my attempt at it. I start with the assumption that R_I is analogous to the value equiva
Let me try that again, as I lost that post.
My electrical example was a bit of sleight of hand since you can measure all this in a electric circuit. Another way to look at it is you have increased the probability of failure. Its the difference between a brand new car and a 20 year old car. What are the physical units for this quantity ?
I see you mentioned the probability of failure analogy. This is actually pretty good. You ask the difference between a brand new car and a 20 year-old car. Everyone realizes that a brand new car is particularly prone to failures, as are older cars as the physics of failures (wear and tear, etc) build up. To describe this situations, reliability analysts often describe it via a "bathtub curve", with higher values of failure at the beginning of life and the end of life. The middle area is constant so that the curve describes the contours of an old-fashioned bathtub in profile.
http://en.wikipedia.org/wiki/Bathtub_curve (click the link for a pic of a bathtub!)
Yet, to model this effectively in the real world you basically use just a constant which is described as the rate of failures per time unit. So the physical units for this quantity that you asks for is a probability of failure per year. This is a Markov model, and given an initial state, the probability of cumulative failure is described by an exponential. It simplifies the calculation considerably and works very effectively in practice. All reliability analysts use this approximation as a tool in their arsenal.
I assert that the model for this in oil depletion circles is essentially the Oil Shock model,
http://www.theoildrum.com/node/2376
which makes the same Markovian assumption and we assume constant extraction, with disturbances carefully added for shocks, which mimic the non-stationary aspects of the bathtub reliability model.
QED
Cool thanks !
I need to mull all this over and work with Nate. Once we have something I'd like to send you some proposed shocks for your model. You can of course beat me on this but I have to figure it out on my own.
But to go with the Markovian model. The problem with reserve additions is they are not really taking this into account. The empower of reserve additions is much lower than the empower of the original discovery. If you think about it ultimate URR is 100% of OIP which means every single molecule of oil is extracted we know that to achieve this takes basically infinite energy. Its a big enough number that you can set it to infinity in a model. The minimum energy input is that needed to drill one well in a contiguous reserve. It will extract something less than OIP and has a URR but the time to fully extract is also basically infinity. So these are the two bounds on the system.
I'm asserting that most of the reserve additions made since the 1980's are actually negative in empower and thus won't be extracted.
This is what I think Nate and I have to show and we have to develop some valid shocks for your model.
One is of course Markovian to take into account field age. I think you have already done this.
Field size probably has a similar shock.
Just playing around now I see why I got concerned when EROI drops below 10:1.
The problem is subtle but obvious. Oil has a high empower content but its used as a input for its own extraction. So you have empower/empower. What people are missing is its a big number divided by a big number. This is the heart of the problem. And way its a Maximum power problem.
The tar sands for example are almost certainly negative using empower.
The shocks have to happen pseudo-determistically and not stochastically, otherwise the effects will get buried in the noise. For example, bathtub-like characteristics can not be picked out if applied to individual areas. They have to apply to everything collectively as part of a absolutely-timed disturbance.
Understood.
Memmel, this is an interesting thesis, but I don't see how we'll know until after we start down the other side.
we have a clue because dozens of fields follow the ramp up, steep production, leptokeurtic to the right type distribution, with much less than 50% of max production occuring after the peak. Like Forties
For Forties, you mean much less than 50% reached when the peak is reached (not after the peak or on the backside). I think you meant this but the wording seemed a bit confusing.
Most individual fields should follow this general shape, as it follows the intuitive behavior of a proportional volume rate-limited flow.
yes
I'd not say irrelevant more a best case scenario. We will be lucky to follow a US production profile.
I guess the best way to say this is that the US hit maximum depletion rate post production peak. In fact the US data is now probably significantly above HL's. In general the technical innovations the allowed us to increase depletion rates where made over time with a lot of them developed in the US in response to the production peak.
To use and example you could look at Moore's law for transistor density it works until it doesn't. As long as your well below the physical limits then technology can be used to enhance extraction rates and so of course can simply drilling a ton of wells.
Where world peak differs from the US peak is that we have had fairly advanced technology for decades now starting in the early 1990's so the world has been blessed if you will with the ability to extract oil at high depletion rates for some time. This is a very different situation then in the US which had to develop the technology as it fought production declines.
Now after 1980 the technically advanced world developed a spare capacity level of around 10mpd or so.
But understand that when oil was extracted it generally was extracted at a depletion rate that approaches twice the depletion rate of the 1950-1990 time period. So a good bit of this cushion could be considered as a artifact of technical advances.
A easy way to view this is to take 1980 as being close to the worlds probable symmetric peak production. Then strike a line across the graph. I do it at 65 mbpd. You can see that you can fairly easily fill in the low spots in production in the 1980-2000 time frame of cheap oil with current production. This is spare capacity that came from oil that went unproduced because of price.
The thesis is that any year since 1980 if needed the world could have produced at 1980 levels. As you can see we where not at maximum production. Most people agree that the jump in production since 2002 has a lot to do with bringing online spare capacity and of course expansion of production.
So my thesis is we have been close to maximum depletion rates since the 1990's but we had spare capacity. So if oil was produced we produced it as fast as possible.
We have our could have been on a virtual plateau for many decades. We just recently in a sense uncovered the existence of the plateau as spare capacity went to zero. Given that a symmetric peak means that 50% of the oil is left to produce to get a asymmetric peak takes decades of production at increasing depletion rates. It does not happen overnight. In fact its taken decades of technical progress to extract past 50% URR.
The proof if you will is simple if we where early in the game and could increase depletion rates to maintain and even increase production rates then we will. Thus if we are at 50% URR and not at maximum depletion rates we could double the depletion rate and basically double production rates from todays levels and the asymmetric peak would still happen but it would be out around 240 at about 160mbpd. I think cornucopian analysis is getting caught by this and its because our reserve estimates are way off and they are assuming we can continue to progress as we did for the past decades.
So my approach is actually in agreement with the more optimistic projections I'm simply saying they are wrong and we are close to max depletion and in fact have been close for decades. The mistake I think they are making has to do with the effects of spare capacity and low prices on yearly production and mixing that in with expectations of increasing depletion rates.
So in closing for me to be right real URR is probably 50-75% of the 2trillion barrels estimates it has to be in the 1250-1500 range which matches well with the 1980 papers done well after peak discovery. If its 2000 GB's then my asymmetric production curve is still valid but peak production is much higher and its much later in time. So understand that to really distort production profiles from a symmetric one we have to have had to get to close to 75% depletion of real URR.
My flat capacity argument since 1980 is a simple way to show that we probably have done this.
We have had innumerable posts on the oil drum that cast doubt on the reserve estimates because depletion rates don't match well with reserves. Maybe a way to see is to assume a 10% depletion rate coupled with unproduced spare capacity. This gives a effective depletion rate of around 5% or about 20 years of flat production around a symmetric peak that would have been about 1995 from Hubberts analysis. We where much lower than this for above ground reasons after 1980 so this 20 years of flat production got pushed almost a decade into the future primarily because of OPEC cutbacks in the 1980-1990 time frame. So 1995+20 = 2015 but this is overestimating the 1980-1990 contribution since production was about half what it should have been not zero so the push is not ten years but five.
So its better to shift the plateau by less than 20 years more like 15. which gives 2005 as the point we would have come off and began a sharp decline. So you get a range of 2005-2015 as a rough estimate for the end of the plateau and beginning of sharp declines because of lost Iraq production and lack of investment in Mexico, Venezuela and Iran I've picked 2009. Russia once corrected for the fall of the Soviet Union should follow the US production profile because it has a similar technical effect.
In any case the projection seems to be well bounded within the 2005-2015 time frame. Many symmetric approaches put us in decline by 2015 the difference is I'm saying we decline world wide at closer to 75% URR than 50%. And whats even more fascinating is that the dismissed lower 48 peak in the US was actually the driving force for causing a asymmetric world peak since as this large producing region went into decline early it produced technology that allowed the rest of the world to increase its depletion rates in effect smearing world peak out into a decades long capacity plateau with cheap oil prices. So although the production profile of the lower 48 may not be correct for the world the technical achievements made trying to combat it are of key historical interest.
I think future historians will correctly explain how the decline of the US spurred technical innovation and eventually resulted in the world oil production collapse in 2009.
In any case since my theory requires current reserve estimates to be way off it should be easy to disprove.
I would agree, but with a slightly different formulation, based on observing NatGas drilling behavior in North America.
In prior regional peaks, there were other sellers of oil on the market. This limited how far prices could rise. If prices could not rise, then drilling could increase enough to keep production flat.
What we have seen in with North American natural gas is that prices have been allowed to triple and that has paid for the drilling of previously impossible to tap supplies.
However even if prices are free to rise (no competition), they cannot keep rising for long. Eventually demand destruction happens, prices stop rising, and we fall off peak (which is what is happening with Canadian NatGas right now). That has started in the US.
I work in the 'Canadian patch' and am well aware of the natural gas implications.
Current Alberta gas production is 12 BCFD and 1 BCFD is in use for the tar sands, by 2012 Alberta gas production is forecast to be 9 BCFD with 6 BCFD in use for the tar sands. That means the 11 BCFD currently available for other sources will progressively drop to 3 BCFD in approx 5 years. The Mackenzie Delta will not bail this out.
I only see three possible scenarios with that, either: 1) The tar will have to stay in the ground until the nuke plants come up in 10 or so years or 2) it is going to get pretty cold and dark here, or 3) both.
Albert should be warm and toasty, but if I was on the East Coast I would be really worried.
What part of the industry do you work in? I am always looking for more data to turn into EROI calculations like this post Canadian NatGas EROI.
Any opinions on why NatGas drilling in Canada is falling off while still growing in the US? Canada is generally believed to be a less mature province.
I work as a Project Manager in oil/gas facilities engineering.
We don't affect the East Coast much, they import LNG. Alberta gas barely makes it to Chicago.
Natural Gas drilling is off in Canada for a couple reasons, the largest is that work on the oilsands has made the services in some cases 3-4 times more expensive than before. That throws the economics on natural gas out the window. Historically we would look at a 6:1 ratio between the price of oil and natural gas to determine where more investment would go. For the last couple years that number was about 13:1 meaning there was almost zero investment in natural gas. Combine that with the ultimate push into the tar sands and there just aren't enough resources to do both oil and natural gas. It is starting to shift a little bit of late, but not enough. Because natural gas drilling has been left so long, I have predicted last year that this ratio will swing to approx 5:1 by end of 2010, leaving 2 more years (not sure which ones they will be) of ecstatic drilling before its GAME OVER.
Most of the SAGD (Steam Assisted Gravity Drainage) plants will be operational by 2012, which is when the rubber will have hit the road on the natural gas issue (or maybe there will be no rubber on the road) :)
The other reason is that Alberta is past production peak of Natural Gas (we are further ahead of the US in this regard). All the big pools have been found, and there is not much bang for the buck in drilling the smaller pools. So we are letting production drop, while the US is on a drilling spree trying to catch up with us on the peak NG curve. :)
4.Canada stops exporting so much??
Or is that out of the question
NAFTA has a provision that requires Canada to provide natural gas to the US. I believe that the treaty requires a minimum of X% of the previous Y years rolling average. Something like 80% of the last 3 years rolling average, but I'm not sure about the numbers. So Canada can reduce the exports, but it is legally required to be a slow reduction over time. Sorry, I wish I remembered the specifics.
-Tim
The actual oil production increase by 2012 resulting from this increased gas use is far lower than 6x I assume. So why will gas use increase so much for tar sands by 2012? Is it replacing another energy source, or is the whole process simply becoming much more energy intensive?
We currently have very few SAGD systems in operation, but there are more than 6X the SAGD equipment currently in service now being built. Most will be onstream by 2012 or shortly thereafter. They are gas and water hogs.
If there were to be enough gas to continue, oil production would rise substantially because of this (can't remember the exact numbers), but I believe that forecast oil production is nothing but a dream.
A new peak that isn't really that much more than a peak in 05 probably means we are still on a plateau. Afterall, 160 thousand barrels more is only 1/5th of 1% increase over 05's total. It is more, but is it cause for celebration? 3 years and 1/5th of 1%? I suppose it could mean the industry has adjusted to mo-money per barrel and this blip could lead to more in the future, maybe even one's that are much greater. But for now I'm going with the opinion that we are still on a bumpy plateau. Let's see if Feb. continues the trend or if this is just a blip.
Talk about a tempest in a teacup. Last time I looked the scenario was an ALL LIQUIDS peak of 90 mbpd in 2010, and while I don't have the numbers in front of me I believe the megaprojects data supports that as well.
Gosh, a whole two years and 5 mbpd for industrial civilization to do a 180. No problem!
Cheers,
Jerry
Just a few thoughts here. A big chunk of rising oil prices is a weaker dollar. To better put things in perspective I suggest that you take the current spot price of oil, in dollars and then divide by the current value of the Euro to give you the value of oil in Europe. If you are buying oil with Euro's oil is more like $70 a bbl.
As far as predicting the "peak" I feel this is a lot like predicting the top in the stock market. I don't feel it is very useful, unless you are in to serious speculation. I believe if the market is left alone things will tend to sort themselves out. (Without the world coming to an end.)
The problem is politics is forever screwing with the market. Not just in the US but elsewhere, too. Think Nigeria, Mexico, Iran, EU, oh and our buddy Chavez to name some.
West Texas, what do you think about the Bakken now? 3.5 Billion, right? I have not read anything other than a quick blurb, that is excluding Canada, right?
As noted elsewhere, if we assume the top end estimate of 5 Gb, if the Bakken were more or less fully developed in 1970, it would have postponed the Lower 48 peak by about six months. Note that the USGS estimates tend to be on the high side.
Why is the Russian 12-month average below the curve almost continuously, while the 3-month average seems to track the curve better?
this is a causal moving average (average for the last 12 months) so there is a 6 months shift in the curve and 1.5 month shift for the 3 month average.
When used in another context, they call this "dead reckoning". In other words, if you don't intuit the inertial state behind the algorithm, you will be dead when you slam into the reef dead ahead.
Let's not forget that the data are only estimates and they are very noisy, just looking at Saudi Arabia (from Stuart):
the standard deviation is already around 0.25 mbpd. Consequently, monthly differences smaller than 500 kbpd are likely to be below the noise level and therefore not meaningful.
One way of looking at this is to see how much countries have changed from January 2007 to January 2008 in their reported Crude and Condensate production. In total, production increased 1,357,000 barrels per day in this period. This is a little table I put together:
The three countries with big increases are Saudi Arabia, Iraq and Angola. Based on this article, Angola's production is pretty much maxed out. It is possible that Saudi Arabia and Iraq will have further increases, but it is far from a sure thing.
As others have noted, now both Russia and China are showing decreases. This is not good, since they are both huge producers. Last year at this time they were both increasing.
The countries I show missing in action are Canada, Brazil, and Iran. All three of these, particularly Brazil, claimed many barrels of megaprojects in 2007 (as did the UK). It is difficult to see much benefit.
I was under the impression that the Canada C+C amounts include the tar sands amounts, since production has been increasing in recent years, and would not be without tar sands. Perhaps someone can clarify this for me. Canada's production had been increasing previously, but this increase has almost disappeared now. Canada's January 2008 amount is 2,589,000 BPD, compared to average production for 2007 of 2,611,000, and compared to January 2007 production of 2,578,000 BPD.
Gail - its an interesting table. I'd note that in your risers, Saudi, Iraq, Kuwait and UAE are all managed production increases in a way - I wonder where reserve capacity now stands - not much I think. Only Angola, Sudan, Azerbaijan, Kazakhstan and Libya are bringing new oil to market (756,000 bpd).
In the fallers I note 4 OECD countries and 2 BRIC countries - that is very bad news.
And those who missed the party - speaks volumes.
No doubt we are in THE ZONE - still surprised this is not all over the news.
€
Russia and China are not showing decreases. That is false.
Angola is not maxed out. That article is hardly evidence of anything except talk of their new OPEC quota.
Other is not a country. The EIA covers more than these countries, where are they in this list? Have you put them in aggregate into the other category?
If production increases by the same amount in the next year
(1.35 mbpd) does that put us above 2005?
I wouldn't analyze possible production with such an obvious bias. This is what lead people to believe today's record wasn't possible. Try looking at the possible outcomes given observable, proven, current trends. I stress possible.
For instance there has been debate about Russia for a few years. but they continue to increase production at 2% per annum, so allow for for the possibility they will do that this year. Don't assume on 3 months data that they have peaked and their production will fall. But allow for it.
A year ago people thought Saudi Arabia was falling at 8%. It rose instead.
What is the probability that Angola will be over-producing their OPEC quota a year from now at 2.4 mbpd?
Russia Oil Production in thousand barrels per day from Sept 2007:
Sep . 9,520
Oct . 9,500
Nov . 9,425
Dec . 9,400
Jan . 9,359
Feb . 9,361 (Approx)
Mar . 9,352 (Approx)
Apr . 9,323 (Approx so far.)
The data is from Russia's Central Dispatching Unit of Fuel and Energy Complex. I have been gathering the data from there since December and used conversion numbers for February, March and April that yielded the correct data for December and January. So the numbers are pretty close. The data is updated every two or three days.
Russia will clearly be down about 1.5% to 2% this year because all reports out of Russia report this trend will continue. China has been on a plateau for two years and shows no signs of increasing her production. Even the EIA's Short Term Energy Outlook predicts China to be down slightly in 08 then up slightly in 09.
But there is about a 95 percent chance that Russia's production will be down this year. There have been several reports, posted on TOD, out of Russia that confirms this.
Ron Patterson
"Russia will clearly be down about 1.5% to 2% this year because all reports out of Russia report this trend will continue."
All reports out of Russia do not report that this trend will continue. And even if they did it wouldn't mean that production would be "down 1.5% to 2%." If it is so clear, than which is it? 1.5% or 2%.
"China has been on a plateau for two years and shows no signs of increasing her production."
This is not the same as decreasing.
I couldn't help but notice that you cherry-picked Russian data from a source other than the EIA and also failed to mention that Chinese production has increased in 2005, 2006, and 2007, and that January 2008 production is higher than the average for 2007.
This is exactly the type of thinking that would have lead one to believe 2 years ago that May and December of 2005 were the peak months. Don't buy into all the negative reports and discard the positive ones and use the same data sets and methodology.
Good God man, I picked Russia's own official energy information web site. This is where the EIA gets their information. You really have some balls calling that "cherry picking". Go to the link and click on "About CDU TEK" and you will get the following:
May and December 2005 were peak months, just like January of 2008. We are currently on the peak plateau. We have been on that plateau for four years.
I really don't know what your game is. All we are doing is reporting the data and expressing the opinion that we are on the peak plateau. I predict that when we come off this plateau, in from a few months to no more than two years, it will be to the downside.
Ron Patterson
My game? We're talking about EIA C+C production. Russia's increased about 2% in the last 12 months.
What's your game? Try responding to what I said instead of obsessing over predictions based on the data source that best fits your preconceptions.
We have not been on a plateau for 4 years. It has been 3. But that changed today.
You clearly just want to argue and aren't looking at the numbers that we are discussing. Nice talking to you.
From the EIA
Russian oil production:
January 2007: 9.86
January 2008: 9.82
Russian oil production from January 07 to March 08:
9.86
9.90
9.91
9.81
9.83
9.88
9.90
9.83
9.96
9.94
9.86
9.84
9.82
9.81
9.82
Both datasets show a slight decline and no net increase year on year.
Source:
http://tonto.eia.doe.gov/cfapps/STEO_Query/steotables.cfm?periodType=Mon...
The STEO is not what is the standard. It is a preliminary forecast dataset that remains unrevised. You have to use the t11d.xls file that Deffeyes uses and that is the whole basis for the thread you are posting on.
There can't be any net year on year increase. There have only been 3 and a half months in 2008.
Comparing Jan 2008 to Jan 2007 in unacceptable. This is the method that meaningless press releases use because it is the level of detail that reporters can handle.
http://russianoil.blogspot.com/
Note the bolded text in the article provided.
There is a link on the new Drumbeat thread to an IEA report showing a decline in Russian production. As I noted over two years ago (in January, 2006), mature Russian basins are quite depleted, based on the HL model. And based on the HL model, the recent rebound in Russian production was just making up for what was not produced following the collapse of the Soviet Union. In January, 2006, I thought that Russia would show another year or two of rising production, before starting to decline, probably sometime in 2007. The Russian decline rate, especially the decline from mature basins, could be quite severe.
Our (Khebab/Brown) outlook for Russian net oil exports (note that the Russian are reporting close to a 4% year over year decline in crude exports):
This is amusing. From the poster who said we had been on a plateau, but "that changed today." So, one month of a slight rise over the previous high (a rise that apparently includes non-crude, i.e., oil sands, inputs) ends a plateau, but year-to-year monthly comparisons aren't acceptable?
Which oil company or government agency do you work for? CERA?
:)
Cheers
Canada's east coast offshore oil fields are in decline.They have also had some temp shut-ins(leaks and icebergs).
Actually, it is looking like they had further declines, not increases.
Royal Dutch Shell
If this is true, then we would expect the revised data to come in substantially lower? I wonder if they want even higher prices or they think that the 2008 Mega projects list will come in on schedule? (or they are in decline).
With respect to further increases for Saudi Arabia and Iraq, I was thinking, in theory, a year or two down the line. I agree that is not what we are seeing.
According to your link, the high month was January, so it is possible the January estimate could remain with out revision.
Thanks Naet, Ron and Khebab,
My main observation to this is that demand is strong at $100+ / barrel. For so long as the world on average is prepared to pay, production will keep rising. Peak, IMO, will be defined by price - and this is a point of agreement I believe with Peter Jackson. Where that price lies is the $50,000 question. I would qualify that by including eroei but am beginning to have a suspicion that the way our financial system works that a broad bound eroei break even may coincide with that max price. What happens after that is the next $50,000 question - if we are no longer willing / able to pay (neg broad bound eroei) then production will fall. Prices then may rise uncontrollably or substitution will occur.
High energy prices are beginning to hurt in Europe and I suspect a further doubling from current levels will see widespread conservation.
The latest view of Saudi production looks interesting - plateauing at a lower level. High price clearly suits them - anyone who believes otherwise needs an appointment. When AFK comes on I don't think we'll see production shifting much. KSA will wait to ramp to higher levels when they can get $200+ / bbl.
That would be risky.
Was poking around in the EIA data and found out that during the 4+ years from the 12 months ending Feb 1979 to the 12 months ending May 1983, overall crude consumption in the US shrank by over 21%. That contraction works out to about 5% annually.
http://tonto.eia.doe.gov/dnav/pet/pet_cons_psup_dc_nus_mbblpd_m.htm
I realize the perma-pessimists here believe all the low hanging fruit have been picked etc. But I don't see them pouring over the consumption data to see where more fruit could be plucked. My eyes tell me there is waste everywhere waiting to be squeezed out.
Never underestimate what high prices and a decent recession can accomplish!
Jimmy Carter televised address
JC,our last patriot President. Oh, how different things would have been if we had followed through. Imagine that. Restricting imports.
Even without your eyes looking around you day-to-day you can look at consumption figures. You get numbers like 25bbl per person annnually in the US, 15bbl in Australia, something like 8bbl in Denmark, etc.
Sometimes there are excuses like, "oh but we're a big sparsely-settled country, that's why we use 25bbl", well what about Australia on 15bbl? I promise you we're not paragons of efficiency. But that's a 40% drop the US could have without any change in lifestyle, really. And that'd be, what, half of all imports?
The US is not picking the low-hanging fruit of energy efficiency, it's just letting it drop to the ground and get stepped on.
The problem is that most people are in a catch 22 situation. For those that current oil prices are causing a strain you generally have a situation that they have maxed out credit often one or more fuel inefficent cars with loans etc. Technically the vast majority of these people are bankrupt. In many cases they are now negative on the monthly bills and will eventually file bankruptcy.
Once they lose everything they probably will make a lifestyle change at least to a fuel efficient car.
Above this you still have a large majority that has borrowed itself into a corner its not on the edge but its caught in the same box. They have house/car/boat loans etc and are underwater on depreciating assets. They can't afford to change and gasoline/food prices have not yet sent them negative every month. In general this group cannot pay of its credit card debt for example.
I don't think Australians are in terribly better shape so the issue is increasing energy conservation this means in general downsizing the house and the car. The point is Australians probably have about the same ability to contract as Americans. Sure we are at a higher usage rate and your lower but because of the financial condition of many of both countries inhabitants the ability to invest in conservation is limited.
Now I'm not saying people can't take simple measures to cut out extra driving and other waste but this will at best probably give you a 2-3% efficiency increase. I suspect closer to 1%.
To go from 25bbl -> 15 bbl is a big step generally means changing cars houses etc etc.
And worse it means fiscal responsibility. And thats the real problem before you can get serious about conservation you have to get your financial house in order. This first step will be a big one for your average American and not small for your average Australian.
I'm betting most Americans are going to simply take the path of driving their lives into a wall.
They will makes some small sacrifices but never get the big picture and just go till they have to file bankruptcy. The business cycle is just passing the biggest debt bubble in history it will be years before a prudent financial life and conservation are back in force.
Look at it this way although purchases of fuel efficient cars has risen in the US overall care sales are way down this means that most people have chosen or been forced to hold onto the SUV. The net effect is that although we are now replacing our fleet with more fuel efficient cars the fleet replacement rate has dropped dramatically. Same with housing the McMansion trend has reversed but the number of homes sold is sliding into oblivion. And of course for many if they do sale now and are not underwater the have little equity and little savings so if they buy a new home they can afford a lot of energy conservation measures. And it will be a while before the McMansions are broken up into apts. So we are stuck with then for years.
So we are in a real spot as far as conservation goes.
Asebius - back in the 1970s we used oil to generate electricity amongst other things, and the options for substitution were more readily available. Most oil goes on transportation now - and to be sure there are huge options for making savings there. Down the thread I think it is Memmel who points out many are locked into gas guzzling assets with debt. It will take a long time to change this behavior. And then there is a long queue of folks in Russia, India, China and the ME waiting to use the oil we conserve.
During the early 80's when that 20% drop occurred, there were 2 recessions and unemployment hit 11%. There was a housing bust (prices fell 16% in real terms). That really helps to curb runaway consumption!!
Give us similar conditions now and the result will be similar.
Do you really think debt prevents people's consumption from falling? Especially in the middle of a credit crunch??
Overall, I doubt it. Foreclosed houses, repossessed vehicles, lost jobs are all highly efficient ways of curbing consumption.
Technologically speaking, we are substantially more advanced than we were in 1980. Consumers have more choices on the efficiency front in many areas. Could soften the blow.
Here is a couple of the macros from the period in question.
In general, I have trouble understanding the idea -- often expressed here -- that because Joe SixPack is 'trapped' in his consumption pattern, consumption will remain high.
Firstly, I doubt he is as trapped as people think.
Secondly, even if he is trapped, he's welcome to remain in his trapped condition while others reduce his consumption for him.
It's not politically correct to speak that way. But if you don't, you obscure how the system works. In a substantial recession, it will carve away inefficiencies without remorse. We have downsize specialists and bailiffs. We have bankruptcy courts and repo men and collection agencies. We have the apparatus needed to enforce economic constraints. And we've had for a long time.
People associate capitalism with runaway growth. But historically, it's also associated with liquidation and relentless trimming away of waste, incompetence, bad judgment and ill-luck. I guess most of us are just too young to have seen it in action.
Stand by and watch it perform nicely according to specifications.
Re the constant sloganizing using the term "Capitalism", the largest employer in the USA currently is the government. This is without factoring in business interests protected or favored by government power, one example is connected large banks and Wall Street investment firms. How about a vacation from rants about USA "Capitalism" and its magical powers until Paulson, Bernanke and co finish up their fiscal transfer program from Joe Shmuck to Grifter U.
For the record, I'm in favour of much higher taxes on the rich. If there is a severe downturn, it's inevitable.
Take a look at "Partial History of
U.S. Federal Income Tax Rates
Since 1913" in wikipedia:
http://en.wikipedia.org/wiki/Income_tax_in_the_United_States
The thing with the US system --- for our purposes here --- is not to love it or hate it, but to understand it. (Management of the money supply is integral to modern capitalism, BTW).
People are constantly saying the economy can't cut consumption , there's no way out, and we're in some sort of Tainterian complexity trap etc etc. Whereas the past 60 years is largely a tale of constant adjustment.
I'm just saying that the demand destruction will be forced not a smooth transition.
I think your reading to much into my writing. We are in agreement.
What you would want to see in the best case is a smooth transition from a oil based society to one not based on oil.
I'll post later in other threads but my conclusion is its impossible to prevent the collapse of a oil based society and solutions based on that concept such as electric cars are not solutions.
However nothing prevents you from creating a new society that happens to rise in time with the old one collapsing. The interval between the fall of one civilization and the rise of another is not a fixed quantity. For example on of the shortest transitions is one civilization conquered by another. And the reverse liberation via violent or non-violent uprisings. Ghandi/Martin Luther King.
This is the way out.
But the cumulative shortfall between what the world would have produced at the 5/05 rate and what we actually produced, through 12/07 was about 760 mb., while we have seen the highest nominal oil prices in history. With the preliminary January data, the shortfall fell slightly, by about 6 mb (C+C).
I agree that we will see, at least for a while, slowly increasing nonconventional production, but I have my doubts about conventional production, e.g., the initial Texas and North Sea declines had the following characteristics:
Higher Oil Prices + Increased Drilling = Lower Crude Oil Production
Jeffery - you need to remember that at any point in time ME OPEC has reserve capacity - though it is possible with current price that the reserve capacity is near zero.
When they have reserve capacity this means they could if they want increase production at any time - lowering price - which will either increase demand for the increased supply or kill off high cost production else where.
New ME OPEC projects will create new reserve capacity - not new flows - and the way this seems to be working is that this new reserve capacity gets eroded by decline (from all fields) over a number of years. In other words, new fields off set decline but given this is ME OPEC it happens in a more controlled manner than in OECD.
They will of course one day fairly soon discover that new fields are no longer able to compensate for decline and ME OPEC will at that point be passed peak.
That of course is the definition of Peak Oil. As you know, we don't stop finding new fields post-peak; we can't offset the declines from the old, large fields. And Texas and the North Sea are Exhibit "A" in rebuttal to ExxonMobil's, et al, claims that better technology can do wonderful things for conventional production. While the Texas pre-peak HL plot is noisy, the total HL plot shows the expected linear trend, and based on the C+C HL plot, the North Sea peaked when it was about 50% depleted.
I first tackled the major exporters story in January, 2006, when I noted that Saudi Arabia, in 2005, was at about the same stage of depletion at which the prior swing producer, Texas, peaked. As we all know, Saudi Arabia has shown two straight years of declining annual production, with a recent rebound to a level below their 2005 peak:
http://www.energybulletin.net/image/uploads/38948/image010.jpg
As I stated several times, IMO East Texas is to Texas as the Ghawar complex is to Saudi Arabia. The key difference of course is that Ghawar, in 2005, made up a much larger percentage of total production than did the East Texas Field in 1972. I think that the decline in production from North Ghawar caught the Saudis by surprise, wiping out most of their excess capacity, certainly their light/sweet excess capacity, and it took some time for them to regroup. And, as I noted in Stuart's articles on Saudi Arabia last year, I expected to see a rebound in Saudi production, to a level below their 2005 peak. In any case, the key question for Saudi Arabia is whether they will ever again show an annual production rate of 9.6 mbpd or more (C+C). On the net export side, I estimate that if they wanted, and were able, to match their 2005 net export level, they would have to boost their 2008 total liquids production to about 11.7 mbpd (versus 11.1 mbpd in 2005).
In the comment section of the January, 2006 article, after numerous discussions with Khebab, I concluded that Russia could show show a year or two of rising production, before starting to decline again, probably in 2007. Numerous reports show three straight months of declining production in 2008.
My position is that the HL models should be assumed to be more or less accurate, until proven otherwise, and some people, e.g., Memmel, believe that the HL models are too optimistic.
Copy of my Drumbeat post:
http://www.gulf-daily-news.com/Story.asp?Article=214240&Sn=BUSI&IssueID=...
Saudi cuts output
12 April 2008
I too have voluntarily elected to keep the production from my oil fields at a reduced rate--somewhere below one mbpd--because of a recurring problem finding buyers for all of our oil, even our light/sweet oil.
I am one of those customers and lately I have been demanding $3.25 per gallon gasoline. This summer, I plan to demand gasoline at near $4.00 per gallon. Next year, I may be demanding the gas at an even higher price.
It must be nice to live in a world where customer demand has nothing to do with price.
Jeffrey - you need to visit and live in the UK for a while to learn the true art of satire. This is a reasonable punt - and one worthy of respect - especially for an American.
So, the Little Engine that Could can be coaxed a higher up the hill, when the price of oil finally gets into the 90-100 range. Makes sense to me.
Wasn't the Marker of May 2005 always a kind of flashing strobe light anyway? Sort of a headline that one could refer to, when trying to explain all of this to non Oil-Heads? That was my view. Bottoms are rarely V-shaped, and so too with Tops. I never understood why Peak wasn't supposed to be chunky, granular.
You know, when NG fell way back from the highs of 2005, it passed through the higher-priced NG production and quickly found there wasn't much lower-priced NG production to tap. We're at the same juncture with oil.
Send the price of Oil back to 70.00 for 3-6 months, and The Little Engine that Could will be sliding backwards.
Gregor
I have reinforced in my mind that C+C predictions work because you can use discovery data as a basis, but anything beyond that will get progressively harder to predictively model as we have no idea of extractable content based on initial estimates.
Just look at that Canadian tar sands component and try to create a model of how that will play out; it is a huge potential field but balanced against low EROEI due to the high amount of NG used for extraction. Lucky that it is buried in the overall C+C dtataset which has a relatively good quantitative discovery model and reserve growth corrections. See http://www.theoildrum.com/node/3287 for a C+C estimated peak that lines up in 2008, and a total liquids peak that ends up in 2010 (the latter based on discovery data massaged by Shell to take into account non-conventional sources).
Unfortunately, the new EIA C&C monthly record of 74.47 mbd is bad news if it causes the world to believe that a new upward trend has started which causes a further delay in planning for reduced oil supply and higher oil prices.
I have updated my model with the latest EIA data and the chart below forecasts that Feb 08 may be higher at 74.6 mbd. Next the irreversible decline phase is forecast to start. The vertical red line in the chart below represents this current month April.
World Crude Oil & Lease Condensate Production to 2012 (bottom up project forecast) - click to enlarge
The IEA OMR highlights page was also released on Friday which agrees with the decline in the chart above from February to March.
http://omrpublic.iea.org/
For more info, please see my recent Feb 2008 forecast
http://www.theoildrum.com/node/3623
In this previous thread
http://www.theoildrum.com/node/3823/328740
Nate asked the question "What makes you confident that the drop you are seeing isn't like the dips you show after Peak 1 and Peak 2, and will make new highs later on?"
The answer I gave was:
I think that the drop in C&C production is irreversible because too many countries are now in decline or on plateau. Angola has just said that 2 mbd is their peak about now. Russia is either in decline or on peak plateau now. Venezuela is on a plateau or slight decline. Offshore areas such as North Sea, USA Gulf of Mexico and Mexico are in serious decline. Canada's tar sands production has been increasing but offsets Canada's declining conventional production. Saudi Arabia's C&C peaked in 2005 and Khursaniyah's 500 kbd project has been delayed and Aramco will only admit to a 300 kbd capacity.
Increasing production from Kazakhstan, Azerbaijan, Brazil and possibly Nigeria and Iraq won't be able to offset all the declining countries. The forecast is also an output of an excel model which contains over 350 world projects/regions, each with their own production profile.
I am also given further confidence by IEA's forecast in their World Energy Outlook 1998, prior to their acceptance of the overoptimistic USGS World Petroleum Assessment 2000.
http://graphoilogy.blogspot.com/2006/02/usgs-world-petroleum-assessment-...
http://www.hubbertpeak.com/laherrere/usgs2000/
IEA Oil Supply Profile to 2030 - click to enlarge
source page 100 of http://www.iea.org/Textbase/publications/free_new_Desc.asp?PUBS_ID=1244
The chart above shows a crude oil peak in about 2012 assuming that the total ultimate recoverable reserves (URR) are 2,300 billion barrels. I think that this estimate is high. Colin Campbell's URR estimate is about 2,230 billion barrels but this includes 143 billion barrels yet to be discovered. So Campbell's revised known URR is lower at about 2,100 billion barrels. This lower estimate pushes the IEA peak forward. My estimate is that the world total URR for C&C is closer to 1,900 billion barrels as I think that Campbell's URR estimates for OPEC countries are too high which brings peak C&C further forward.
http://www.aspo-ireland.org/contentFiles/newsletterPDFs/newsletter88_200...
The chart that shows crude oil production to 2012, is very startling as far as the peaks being so close in total since may of 05, but what is more striking is the 3% estimated decline from 2009 to 2012. As much as the data may predict that amount of decline, it is still at this point a prediction. So the proof will be in what actually happens, however if it does occur in that manner, the price of oil will skyrocket out of range for the transport of many goods over long distances. Those 3 years from 09 to 12 could be very difficult years, which of course would be followed by goodness knows what.
We went snow skiing at Heavenly this past ski season. We stayed at Harvey's on the 16th floor with a view of Lake Tahoe, went out for a filet mignon dinner and I wondered how much longer that level of luxury would be available to so many. I figure in years to come only the super rich will be able to take such excursions.
Unfortunately, the new EIA C&C monthly record of 74.47 mbd is bad news if it causes the world to believe that a new upward trend has started which causes a further delay in planning for reduced oil supply and higher oil prices.
Which is why I have always urged caution in making declarative statements based on the data we have. It's good to urge action, but if in doing so we make claims that are later shown to be inaccurate, then damage is done.
It won't matter that we have been on a plateau for 3 years, or that the record was just barely broken. This will be ammunition for some. Hopefully the media doesn't run with it and try to use it to discredit. I think prices above $100/bbl will lessen the risk of that, but again I would urge people to be careful. There has been a lot of rationalization in this thread that would have been unnecessary had people not staked out such firm positions.
Personally, and this is a repeat, I am not trying to be the one to accurately claim a peak date. As I wrote a couple of days ago, "If I had to guess - and these are just guesses - I would say 50% probability of peak within 3 years, 70% probability within 5 years, and >90% probability within 10 years." Given those time frames, I am certainly aware of the urgent need for action, and avoiding things that might delay action.
I think this is the right way to look at it. Even if we had complete data transparency and a flawless synthesis of that data there would probably still be an uncertainty of a couple of years in predicting the peak date. The various models employed are indicative of how the world production profile will go, but the uncertainty is probably pretty damn high.
So what if the media runs with it and uses it to discredit? To me, such events would be signs of a society that is utterly pathetic, and fully deserving of the dire future it has fully brought upon itself.
Survival of the fittest :)
I am looking forward to your longer post.
I just checked back to see when Bush and Cheney visited Iraq. Bush visited in the first part of January. Cheney visited on March 17. They were obviously trying to get Iraq to raise production, or at least keep it up. It looks now like they could keep the extra production up for a few months, but after that it is starting to drop back again.
"My eyes tell me there is waste everywhere waiting to be squeezed out."
How about all those kids driving cars to school? Bicycles may come back in style. Then we have those moms driving Johny and Mary to and back from school.
I don't know why so many folks see peak oil as a problem. I think it's great,as long as it means less CO2 going into the atmosphere. Would we have carmakers bringing PHEV's to market without peak oil? Would the U.S. have doubled its wind power capacity last year? Would I have covered my roof with solar panels? No,no,and probably not.
I put surplus power on the grid. Can't wait for the Chevy Volt to come out. We also have 7 fruit trees and a small garden out back. People,please stop with the gloom and doom already. My family is middle class,but just barely. If we can beat the peak oil boogeyman,anybody can. Honestly,I see fully electric vehicles taking over the roads in the coming decade. With wireless connections to the grid. I do wish countries that can afford it would begin mandating solar on new construction. My concern is CO2 emissions. Peak oil will have an effect on those emissions. We need to make sure the effect is a positive one.
THE GREAT BLACK SWAN(S) ARE CLOSER THAN YOU MAY THINK, BUT THE OUTCOME MAY SURPRISE US ALL
The Chevy Volt is fascinating isn't it?
It is amazing to me how many people are waiting and watching this project. If it works, and proves to be a success, it could set off a revolution in the one area in which crude oil is still crucial, transportation.
The interesting thing is that the Volt is a classic case of how you view it, glass half full or glass half empty.
Those who are doubtful say that it cannot scale fast enough, that the number of people who will want a car of that price and size is limited, that there are still bugs to work out.
And they are right.
Those who are enthusiastic say the car itself is not the point. The revolution is in the drive technology, which can be used not only in this car but in a wide variety of vehicles across the automotive spectrum. That the Volt is essentially a "proof of concept" vehicle, and that it is simply the vehicle that shifts the economics of oil so that oil is in direct competition with the grid and all the sources of energy that it can provide: Solar, wind, coal, natural gas, hydro, geothermal. That for the first time transportation can begin to make the historic break from crude oil that has already been made in home heating and electric production. In both of those cases oil has virtually disappeared as a economic factor. That the major technical issue is the batteries ability to withstand the repeated deep charge discharge cycles required for dependable long life drivetrains in automotive vehicles of all types, and that the developments in batteries have been spectacular.
And they are right.
For the student of transportation history in general and automotive history in general, we are approaching a possible change in epoch worldwide. The Chinese are already planning their plug hybrid, and various Japanese, European, and competing American brands are working quietly but quickly in "skunkworks" shops all over the world to arrive at the best solution. The full effect of competition is already starting to bear fruit with variations that may set standards of efficiency undreamed of only 5 years ago.
When the automobile was born, gasoline was adopted because it was cheap, easy to burn and offered astounding flexibility and convenience when compared to steam and electric, the two favored methods of propulsion in the earliest days of the automobile. Gasoline at first was a poor choice indeed, requiring hand cranking to start, and of low horsepower output per the weight and complexity of the engine.
But a few seemingly simple additions, such as spark advance, electric spark plugs and finally hand cranking, along with the economics of easy oil propelled the gasoline engine into the forefront of automotive technology. Steam disappeared from the highway, and electric became the realm of crackpot tinkers who held out hope for what everyone knew was an outdated oddity. It created the greatest revolution in transportation, and by extension in world culture in history.
We are at the cusp of one of those type of great defining revolutions.
The cat is out of the bag. Even if General Motors were to chicken out now, many other competitors will not. We have crossed the Rubicon.
Astoundingly, many do not want to even consider what is coming. It is easier to laugh and dismiss the breakthrough grid based hybrid auto as a "technotoy" a gadget of little importance in the greater scheme of things. They do not even consider the possible cultural and economic shift that is implied in a conversion of transportation to a clean and fantastically efficient transport system.
Make no mistake, the oil producers are paying attention. Saudi Arabia and OPEC are stalling, waiting to see what can be done. They do not wish to be caught out with hundreds of billions of dollars of new production of oil based on the supposed transportation need for fuel that never materializes. Remember, they must think in terms of a decade or more ahead. The oil companies attempt to sneer and even slander the radical new technology. They are older men, who do not want to face a revolution late in their career.
Those who hate the automobile and all it stands for are growing increasingly nervous, as the coming revolution in drive systems risk making the hated device acceptable even to those most concerned about greenhouse gas and consuption of energy in automotive usage. It may be possible to build and use automobiles in the near future that consume less overall energy than other consuming pastimes such as golf courses, pet ownership or lawn maintainence. The idea of an "acceptable" world automobile system sends chills up the spines of the neo primitive believer.
But those who fear and hate the complexity of the future cannot stop it.
Many people on TOD are familiar and often refer to the "black swan", the totally unpredictable events that are disruptive of all prior normal patterns. But TOD posters always take seriously the catastrophic "black swans" while dismissing or even attempting to humiliate anyone who would mention the possibility of advance, the possibility of the positive "black swan".
Both catastrophic and positive events are possible in relation to energy and transportation. Peak oil may well be upon us, in fact it may already be a historic event. Or it may be some years away. We have no way to know. The coming revolution will now almost certainly occur. Hopefully very soon. These two events, peak oil and the coming revolution in individual transporation efficiency may well decide the wealth and lifestyle of whole nations.
I ask my friends to please prepare yourself for what promises to be one of the great memorable periods in the world of technical and economic history. The future will be more complex and different than any of us can imagine. We live at a crossroads. Our choices, the work of our technicians and policy makers take on ever deeper layers of meaning. Retreating to the woods and teaching our children that a primitive life as a serf farmer is the best choice is consigning them to poverty, but to something worse. It is consigning them to missing out on the variety and challenge of the age in which they have been fortunate enough to be born into, the worst kind of hell for a thinking person.
Roger Conner Jr.
RC
You're my hero Roger. One of those contenders you spoke of showed off an SUV at the 2008 auto show in NY. It averaged 150MPG using commuters average daily driving. They used widely available "off the shelf technology". If they can't find an automaker willing to run with it,they say they can bring it to market themselves in 3 years. Devices that run on wireless electricity are pretty small at this stage. Laptops and whatnot. It doesn't take a leap of faith to envision wireless cars in the next decade or so. Here's more on the plug-in SUV.
http://www.theautochannel.com/news/2008/01/13/074940.html
How will a Chevy Volt power ships, trains and planes? Electricity has its potential niche applications in small short distance personal transport, however the wholesale reduction of an energy filled liquid fuel will make most long distance transport of goods uneconomical. No one is saying new ideas cannot assist in a hard transition, but there still remains a really big Matsoball out there to solve. But do please keep up the positive outlook.
"How will a Chevy Volt power ships, trains and planes?"
Electric trains have been around for years Cslater. Electric ships wouldn't be very difficult. Planes are another matter. Luckily,they use a small fraction of the oil produced today.
"The new propulsion motor represents a further milestone in the development of HTS technology for use in all electric ships. Cruise ships or megayachts already make use of the advantages of electric propulsion. The trend is also apparent in naval vessels, with first ships already at the planning stage."
http://www.physorg.com/news95525363.html
"As jet fuel constitutes only about 6 percent of global oil consumption and requires high-performance characteristics, it makes more sense to use higher performing synthetic fuels in aviation. The lower performing biofuels should be used to help supplement 52 percent of the processed oil currently used to manufacture distillate fuel oil and gasoline for ground transportation"
http://www.energybulletin.net/23098.html
You still have to have some source for all that electrical energy. The world uses 200 million barrels of fossil fuels a day, so there has to be a source for all that energy. You can't just suddenly have hundreds of millions of smaller and larger Chevy Volts without a source for that electrical energy. What is the source? Do you have a link?
Planes can disappear into the dustbin of history as far as I am concerned. There is nothing wrong with slowing down a bit. Besides, how many of those trips are really necessary? With modern communications technology, most business trips are clearly unnecessary except as an excuse to get away from one's spouse. I realize there are problems with trains but only because we have let the whole system deteriorate. Perhaps the demise of the airlines would be an inducement to finally doing something to rejuvenate our trains.
Bring back the sailing ships or hybrid electric/sail/diesel ships.
I agree. There are worse things than poverty. "Retreating to the woods and teaching our children that a primitive life as a serf farmer is the best choice..." might well be consigning them to survival.
Could someone please explain what this part of Figure 1's caption means:
"Annual data for NGPL and Other Liquids from 1980 to 2001 have been upsampled to get monthly estimates."
How accurate are the estimates that were obtained in this way likely to be?
There are no monthly data prior to 2001 for the NGL and Other liquids categories, only annual data. However, there is a monthly dataset for crude oil + condensate for that period. Because, I wanted to keep the monthly resolution, I simply upsampled the annual production figures using a spline interpolation. Note this upsampling does not affect the annual value but obviously cannot recreate the high frequency content of a true montly dataset therefore the fluctuations seen on the NGPL and total liquid curves are merely a repetition of the C+C monthly fluctuations.
Can anybody tell which country or countries have rise in production and how much in january 2008 as compare to may 2005, thanks.
http://www.eia.doe.gov/ipm/supply.html
Below are all the countries that have increased since 5-2005, in order of amount increased, in thousands of barrels per day. The increase is from 5-05 to 1-08.
Angola ...... 822
Azerbaian ... 506
Russia .......459
UAE ......... 307
Iraq ........ 250
Canada ...... 229
Sudan ....... 170
China ....... 154
Libya ....... 110
Other ....... 108
Algeria ..... 91
Brazil ...... 87
Malaysia .... 67
Qatar ....... 57
Kuwait ...... 50
Colombia .... 24
India ....... 16
Eq Guinea ... 15
Ron Patterson
Interesting, but ultimately irrelevant. This is why I say so. You are just filling a request by Pakistan. There is no analysis here. Why do you assume WFP has already done the analysis but just needs the numbers. Why can't he do the work himself? Weird.
WFPakistan can't do anything with your numbers. Westexas' reply was the best. I tried to do the math with the spreadsheets but 5 minutes into the task realized it would take another 20 minutes and the spreadsheets were freely available.
I was about to tell him this when I saw Westexas already had.
I'm guessing it took you (at least) 30 minutes to figure that stuff AND post it. At least "Wisdom From Pakistan" thanked you for your effort. After WFP already thanked Westexas. (what's your game?)
Then try to re-evaluate where your list stands in relation to the things that have been said about all those countries in the list in the last 5 years.
Start with Angola.
Read Asebius' comments again. Read them carefully.
I answered his question exactly as it was asked. Your two cents worth was unnecessary. Crawl back under your bridge troll.
When a prediction fails, isn't it time for new ones?
Here I offer some that are not very scholarly but that don't fly directly in the face of economic reality like Deffeyes's did.
If one wants to venture out several years...
Until Deffeyes starts taking price into account, I very much expect that an amateur like myself will be able to kick his ass in the prediction business. Geology and production history are all fine and good, but the guy absolutely has to learn some economics.
Perhaps Deffeyes should pay more attention to the Texas and North Sea case histories: developed by private companies, using the best available technology, with virtually no restrictions on drilling.
In response to higher oil prices, (a ten fold increase from 1972 to 1980), Texas oil companies launched the biggest drilling boom in state history, and they succeeded in keeping the production decline down to one mbpd, with 1982 production at 2.5 mbpd, versus 3.5 mbpd in 1972, with a long term decline rate of -4%/year.
In response to a four fold increase in oil prices from 1999 to 2007, North Sea operators have succeeded in keeping the North Sea decline rate down to -4.5%/year.
If Deffeyes would pay more attention to economic case histories like this--which show that post peak regions show lower conventional production in response to higher oil prices and increased drilling-- he could refine his model.
Come to think of it, in response to the highest nominal oil prices in history, worldwide we have seen, through January, 2008, a cumulative shortfall of about 754 mb--between what the world would have produced at the 5/05 rate and what we actually produced (EIA, C+C).
BTW, these production shortfalls in response to higher oil prices--the overall Lower 48, North Sea and the world--all occurred when the respective regions were about 50% depleted, based on the HL plots.
Come on WT, cut to the chase! :-)
Make your prediction for 2011!!! (EIA C & C)
What are your linearizations telling you?
One thing I like about Deffeyes is that he gave us what he thought was the straight dope. He made a simple verifiable prediction.
Deffeyes prediction was based on annual production (between 2004 and 2008, most likely in 2005), and based on annual data, his 2005 pick has so far been correct, even without considering the fact that he was only modeling conventional production. And given the Russian and (very recent) Saudi data, I expect 2008 to also come in below the 2005 C+C rate.
Regarding 2011, I expect it also to be below the 2005 rate, but that is not the real story. The real story is the accelerating decline in net oil exports.
What about 2008 with respect to 2007?
WT -I have been an infrequent reader of Drumbeats of late - I'm sure you have explained this logic before (probably n>50), but could you illustrate what you mean here -'what we would have produced at the 5/05 rate'? We know what we produced then, and we know what we produced now (subject to revision) - what else is there?
Let's freeze a moment in time: May, 2005. Based on EIA data, the world produced 74.3 mbpd (C+C), at a WTI price of about $50.
Subsequent months would be below 74.3, at 74.3, or above 74.3.
So, what happened?
If we take the difference between 74.3 mbpd and the subsequent data for each month, and then multiply that times 30 days, and then add it together, we get a cumulative shortfall of about 754 mb, through January, 2008, with a current oil price of about $110, an annual rate of increase of about 30%/year since May, 2005, which in the past year has been about 50%/year.
We have seen a vast increase in the money spent on oil, from about $3.7 billion per day in May, 2005 to about $7.0 billion in January, 2008, up to about $8.2 billion per day now. (For the sake of argument, I am just using WTI; I realize that different grades of crude sell for different prices in different locations.)
An interesting thought, note that an extra $3.3 billion per day in January, 2008, produced an increase of about 200,000 bpd, relative to May, 2005, or we were spending about $16,500 per barrel of incremental oil, over the the 5/05 rate in January--$392 per gallon per day ($535 per gallon per day in April).
In any case my point is that even though the market is offering more and more money for oil, the cumulative shortfall between what we would have produced at the 5/05 rate and what we actually produced has stayed the same or increased for 31 of the 32 months after May, 2005.
But of course, IMO, what is really driving the price is a result of importers bidding against each other for declining oil exports.
You'd have to ask CERA, the EIA and USGS about that :)
Kiashu - LOL
George - I agree with your first two predictions wrt All Liquids but most definitely not the 3rd, esp wrt C+C. First of all, when Deffeyes wrote his book, tar sands production was 150,000 barrels per year, and was not included in his peak predictions which were based on conventional oil (meaning May 2005, for now at least, still holds because 700,000+/- more barrels of production in Jan 08 came from tar sands, (which are included in EIA 'crude oil' but not in KD's models), than in May 2005. IOW, you're already behind on that prediction. (see Khebabs top graph in this post)
Deffeyes is a geologist who was a fan of M King Hubbert. His methods are not based on economics and in fact he admitted that prices matter but very little (p 41, Beyond Oil). Furthermore, IF better technology (e.g. horizontal access to wells, with many more oil contacts) allows us to produce more, sooner, then his 50% Qt prediction of November 2005 might still be correct. e.g. the peak date does not coincide with peak production. Production keeps increasing beyond peak date leaving larger post-peak decline rates. Like Hubberts 1970 prediction - we won't know until many years afterwards.
At the risk of being branded a "Deffeysian" (as opposed to a philosopher), I will quote from "Beyond Oil" - p43,
Ken spoke at our conference and I think he is a brilliant and funny man, though his method of calculating peak, as was King Hubberts (and they are different) are both mathematical heuristics that attempt to measure something we don't totally understand. It is very plausible to me that advanced 'extraction' techniques that the world is currently using won't necessarily add to Qt, but widen the time lag between 50%Qt and the date of maximum production (popularly called Peak Oil).
In any case, at the pace of how the world is attempting to consume as much as Canadians, the central point of ALL of this is that a few years isn't really going to matter much in the long run, though in the short run it will still feel like we have a perpetual energy surplus.
The tar sands thingy doesn't get Deffeyes off the hook. He has reiterated his predictions several times and never made that clarification even though he has had ample opportunity via frequent updates and is very aware of the tar sands situation being an oil expert.
So find me quote in Deffeyes corpus where he takes that 'out', and I'll concede you have a point!!
I'm not defending Deffeyes - just saying that its possible, especially with better technology now, to 'borrow' from the right half of Qt.
I'll have to dig his book out, but no one well versed in the methodology that I know thought that he was modeling anything more than conventional crude oil production--not with an URR of 2,000 Gb. If memory serves, his point was that nonconventional production would slow the long term decline in total production.
There is place somewhere either in the books or online where he points to the actual C&C table at the EIA and basically says, "Follow those production figures."
He gives the table reference number. They have changed slightly since, I believe.
I'm sure that he referenced the monthly EIA data, but the key question for Saudi Arabia and the world is will they ever again exceed their respective 2005 annual production rates? IMO, the answer is no, and based on EIA data they have both shown two years of annual production declines relative to 2005, but time will tell.
In any case, IMO what is driving oil prices higher is importers bidding against each other for declining oil exports.
Aseb: Your econobabble disagrees with conventional econobabble. Conventional econobabble artists say that when the oil price increases, alternatives will magically appear (see Roger Connor above). You feel that as the price increases, C+C will magically appear. XOM, Chevron and kin disagree with both of you, they are deciding to buy back stock rather than search for fantasy deposits or spend money locking up all the hydrogen fuel for the flying cars. Maybe you and Roger are right.
No magic. Just taking into consideration the power of incentives.
George,
If it can be claimed that the prognosticators on TOD are disregarding price, then it would certainly be fair to claim your predictions disregard geology.
At some point a peak in world production will occur. If it happens to be January 2008 and declines set in, then production would be lower regardless of price. If production goes lower in 2008, it's likely prices would remain high. In this case, all of your predictions would be incorrect.
Does C&C include tar sands oil?
To put it another way: What is part of C&C and what isn't?
All the oil recovered from the tar sands is included in the EIA's C+C numbers. Of course it is only Crude as there is no condensate recovered from the tar sands.
Crude oil and condensate recovered from natural gas wells is C+C, nothing else. Condensate is a liquid very much like gasoline. In fact some people use it for gasoline but I understand it knocks a lot.
The tar sands oil, once it is recovered from the sands, is included in C+C because it is refined just like crude oil except it takes a lot more cracking. But it is eventually turned into diesel, gasoline and other petroleum products.
Ron Patterson
The numbers can be crunched ad infinitum, but you don't have to be well informed about the data of oil extraction, to know that something's amiss when you pay 3.79 for regular unleaded here in California. I just passed a Shell that had reg. unleaded at 3.97 and diesel at 4.38! Originally we were told gas might go as high as 4 bucks a gallon by Memorial day weekend. With weeks to go and oil selling for $110 a barrel, it might be more like 4.50. OUCH!
Our neighborhood is dead quiet on a Saturday night! It's never quiet on the weekend. I just went to Safeway and it was deserted. Are there that many people staying at home to save money on fuel?
A quick ph. call to the Viceroy of Baku/BP
The February 2006 IPM (release in March 2006) reported a new peak of 74,411 for December 2005. May 2005 was only estimated at 73,980, back then.
The estimates now given for May and December 2005 are 74,298 and 74,268, respectively. That's close, but giving May 2005 the edge.
Maybe January 2008 will not be revised down enough to return the peak to May 2005, but it's too early to state categorically that January 2008 is the new peak.
Read the discussion above. Tar sands are being included and when excluded (as they should be), the May 2005 peak stands.
I note that the usual trolls are back now that there is a single number to crow about. These trolls will crawl rapidly back under the slime where they live as fuel prices remain sticky or even increase again and as production slips again.
By the way, Asebius, did you see the discussion above? May 2005 stands after you take out tar sands, which you should because they are definitely not crude and condensate. Not that I expect you to pay attention to that fact, since getting to trumpet your falsehood gives you more social standing.