When Will Russia (and the World) Decline?
Posted by Stuart Staniford on November 6, 2007 - 1:10am

Year-on-year change in centered moving average of Russian oil production according to three data sources: EIA Table 1.1c, IEA Table 3, and JODI. Black line is an extrapolation of the current trend and is a scenario, not a forecast
Here I just want to update and extend a fairly simple analysis of the situation. But first let me set some context. We have been discussing the plateau in global oil production on this site for the last two years (pretty much since the plateau first began). The latest statistics show the plateau continuing, indeed there is even some hint of decline now in both the IEA and EIA series for total liquid fuel production:

Average daily total liquid production, by month, from EIA (green) and IEA (plum), together with 13 month centered moving averages of each line, recursed once (LHS). WTI spot price (blue - RHS). Click to enlarge. Graphs are not zero-scaled. Source: IEA Oil Market Reports, and EIA International Petroleum Monthly Table 1.4. The IEA line is taken from Table 3 of the tables section at the back of the OMR in the last issue for which the number for that month is given. WTI spot price is from the EIA
- continue,
- end in renewed production climbs, or
- begin declines
I have been of the view for a year or two that peak oil is happening as we speak. The fact that production is plateaued tells us that over the last two years or so, all new capacity brought on has been cancelled out by the forces of entropy and chaos: production declines in existing field production, geopolitical problems, the depradations of hurricanes and other accidents, and any voluntary cuts made by OPEC (I am with Jim Hamilton in being deeply sceptical that any voluntary cutting is actually going on). Thus future lists of new projects must be balanced against estimates of the future forces of chaos, and our ability to enumerate those with any precision is extremely poor.
I find it more instructive to look at trends in particular countries. If we look back before the plateau, during the period 2001-2004 when production was increasing robustly as the world economy came out of a slump following the Internet stock crash, we can examine the key declining countries and key increasing countries:
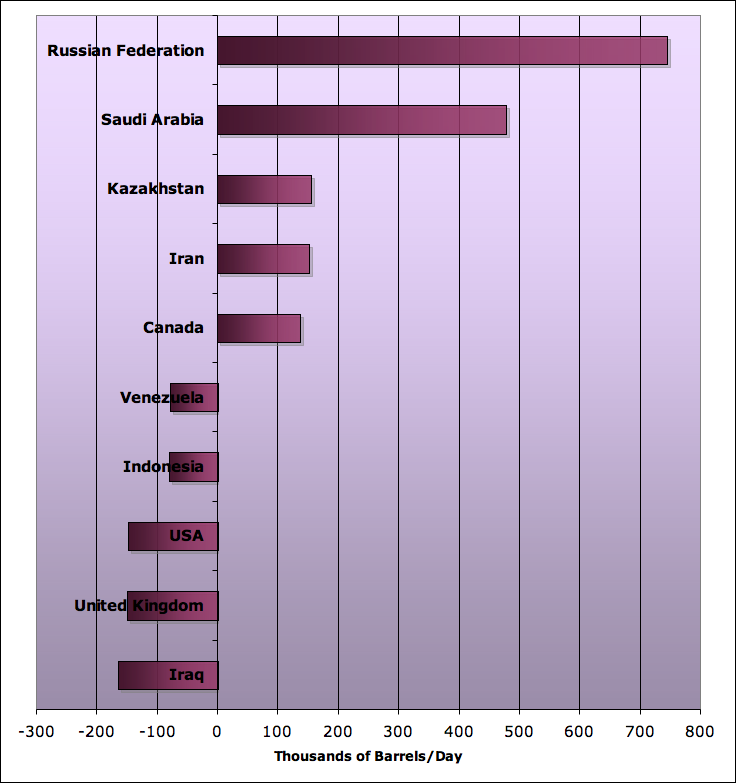
Average annual increase/decrease in daily oil production for top five increasing and decreasing countries 2001-2004. Source: BP (includes NGLs).
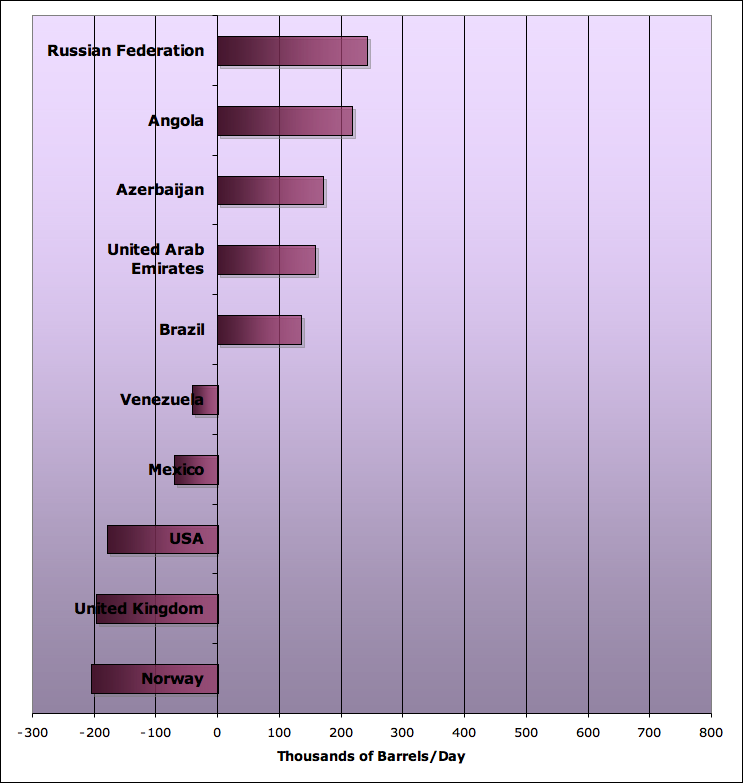
Average annual increase/decrease in daily oil production for top five increasing and decreasing countries 2004-2006. Source: BP (includes NGLs).
Let us now focus more closely on Russian statistics. The next graph shows the monthly production statistics from three different sources, together with counts of rigs operating in the country. This is from 1997-2007 so it encompasses the entire period of the Russian revival in which Russia's oil industry first got its infrastructure working again following the collapse of the Soviet Union, and then began applying the expertise of Western service countries to boost declining production (particularly in the fairly mature West Siberian fields that counted for more than half of Russian production during late Soviet times).
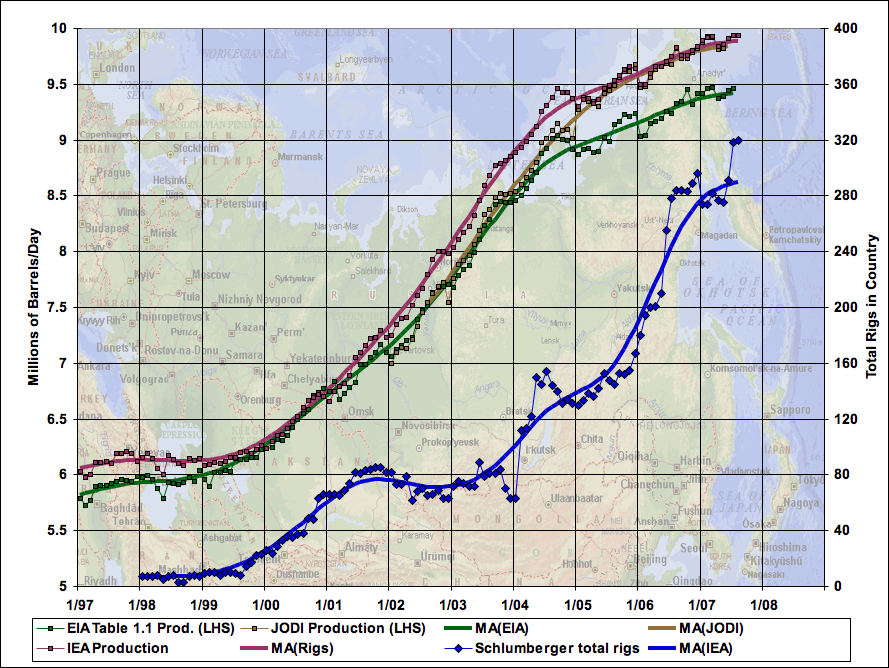
Monthly Russian oil production according to three data sources: EIA Table 1.1c, IEA Table 3, and JODI. Solid smooth lines are 13 month centered moving averages, recursed once (note last 13 months rely on an incomplete window). Graph is not zero-scaled. Rig data are from Schlumberger data and include both oil and gas rigs.
Before we go any further I want to stress an important caveat here. Baker Hughes does not produce figures for Russia, which means we only have the Schlumberger counts, which do not separate out oil and gas rigs. It's also unclear how accurate counts in Russia might have been especially during the chaotic years of the 1990s. For the purposes of this analysis we shall make the simplifying assumption that the number of oil rigs is roughly proportional to the total number of rigs, and that the counts are accurate enough to be useful. However, this caveat has to be borne in mind in considering the strength of evidence for the conclusions of this post.
After noting that production has been increasing, the second observation is that the rate of increase is falling steadily. In particular, if we take the year on year change in the moving averages, we get the following picture:
Year-on-year change in centered moving average of Russian oil production according to three data sources: EIA Table 1.1c, IEA Table 3, and JODI. Black line is an extrapolation of the current trend and is a scenario, not a forecast
If we take into account the rig count picture, things look more serious. This next graph shows how much increase in production occurred for each rig in the country (expressed in thousands of barrels per day increase, per year, per rig).

Rate of increase in Russian oil production per rig in country. Production is 13 month centered moving average, recursed once, of IEA Table 3 production estimates. Rig data are from Schlumberger data and include both oil and gas rigs.
This suggests either that the opportunities for new drilling projects are much poorer than during the height of the revival, or that the base production is declining faster so that it's harder for new projects to increase overall top line production. Probably some of both. Either way, it tends to the view that Russia cannot increase production much further, even if the rig count goes up a lot more.
And if Russia were to begin declining next year, it's likely we would see the world as a whole move out of plateau, and into unmistakable decline.
Contact
- Content: editors at theoildrum dot com
- Tech support: support at theoildrum dot com
License

This work is licensed under a Creative Commons Attribution-Share Alike 3.0 United States License.
OPEC's declines are not voluntary, therefore
KSA's decline is also not voluntary??
Could we at least agree that KSA's decline is "managed"?
Cheers, Dom
Let's keep the focus on Russia for this thread :-)
Thanks for a summary!
With the above ground uncertainty currently being what it is, it seems easy to side with Sadad Al-Husseini's 85ish Mbpd currently being the peak.
I wonder if Libya's Shokri Ghanem's / Margerie's 100 Mbpd max prediction is also a reference to crude + condensates or some other combined category? I can't find the original exact discussion on this.
It'll be interesting to see what Fatih Birol and his team make out all of this in their EIA November revision of USGS and other reserve figures, and thus, production estimates.
They were sitting in the front row in the same conferences as the gentlemen giving the forecasts above and have already given signals that revisions are due. It'll be interesting to see if they'll be minor concessions or real revisions.
To me, it seems that now even the mainstream estimates for peak are converging to a quite narrow range. The peak estimate range has clearly shrunk from 30-50 years (2005-2050) to 10 years (2012-2020), with most starting to drop near 2012ish or lower for at least a temporal peak, if not final peak. This of course includes most of the UK/US IOC estimates.
I expect to see more widespread downward revisions and more converging of estimates at increasing frequency in near future. At the same time, I hope I'm wrong :)
Also, it looks like the peak will for all practical purposes be a combined above ground + underground factors peak. Not a pure geological peak.
Meaning it might run for a slightly bit longer as an "undulating plateau" than a pure geological peak would, IF the political issues can be solved in time to keep the production steady for a while.
If so, it could be that once the peak timing discussion is at least somewhat settled in the inner sanctums, the length of the undulating plateau (& final decline rate) will be the next battle frontier.
IHS: "The plateau will stretch out to 2040"
ASPO: "Fairly short plateau, 6+/-3 years"
etc.
Yes, thanks for a very nice summary Stuart. Your efforts are greatly aprreciated. With all the talk about Saudi Arabia, we tend to forget that Russia is equally as important.
Picture is getting clearer and clearer thanks to your work and that of other contributors to this site.
Ken
I agree. Very helpful article. Thank you.
I read somewhere some months earlier, that a russian minister had said, that Russia would stop exporting oil about year 2010. Anybody with more knowledge about that?
If this is right, then West Texas ELM surely would make the big impact, he claims.
Following is the Russian commentary portion from our draft of the final written report on Brown/Khebab Net Oil Exports by the top five:
"And if Russia were to begin declining next year, it's likely we would see the world as a whole move out of plateau, and into unmistakable decline."
I think Russia is already in decline. Numbers
from Russia come late. And they will be unable to comply with their contractial NG obligations to Europe. Shortly. This is partially due to underinvestment.
The above image is from Jeff Rubin's (CIBC) October 2007 presentation OPEC's Growing Call on itself (PDF).
You probably mean this news which has been circulating for 2 years now:
The latest I could find about that was this IHT article:
Coincidentally, Rosneft is also renegotiating their deal with China after 2010:
There has also been discussion about overstated reserves:
Then again, there's been discussion about Russia capping it's production voluntarily. High prices really is good for Russia (and esp. Putin's cabal):
As for actual export data, exports did fell in 2006 2.4% according to Prime-Tass news agency (article not available on web anymore). Rian reported a 1% fall y-2-y for 2006 exports for Russia.
However, according to Alexander's Gas & Oil Connections, Russia's 1-8/2007 oil exports grew by 4.75% compared to year earlier.
Stuart,
Excellent work, and I think this should help build the case for calling on mitigation efforts to be started now by governments and industry. The probability that we are at at or past peak is not zero.
BTW, The legend on the plot of monthly Russian oil production has the moving averages for IEA production and rigs swapped.
Clint
You're right on the swapped legends. I'll fix it tonight.
I also wanted to congratulate you for having your work on KSA referenced in the EWG's report. I've always enjoyed your objective analysis and was glad to see some credit given to you and TOD.
Clint
The lables for rig count and IEA are swapped in the rig/production chart. It freaked me out seeing such a vast difference in the IEA and EIA figures, which are always reasonably close. Blue is rig count and the dark red/green is production. This is very telling and goes a long way in refuting the standard argument that high prices will cause more drilling and more oil. A similar chart for Saudi Arabia would probably look the same.
That's basically the argument of the piece. A collapse in the marginal return on effort of drilling is probably a symptom of being very close to peak.
Colin Campbell's forecast in 2003 (ASPO newsletter 31):
A short plateau 2007 - 2011, followed by a 3 %ish decline.
As can be seen in Dave Cohen's piece Campbell's assessment of remaining reserves is one of the most pessimistic.
http://digg.com/business_finance/What_do_we_know_about_the_decline_of_Ru...
http://reddit.com/info/5zva3/comments/
thanks for your support!
I recently heard the presentation that is going around called "The Hard Truths: The NPC Study and Outlook for Energy Supply and Demand". As relates to world-wide oil supply, convincing arguemensts are that supply will last for many years. Russian supply may have cycles that result from slow adoption of enhanced recovery technology, but I believe the long term Russian supply is vast.
One approach is to look world-wide at geology that has not been tested but has geographic features like the sites of significant past oil production. That approach leads to potential oil supply for maybe 50 years.
I do find the articles interesting and I feel that geopolitical rather that geology are the predominant uncertainty in near tern oil supply.
High prices leading to reduced oil burning will bring more efficiency in oil use and less emissions.
I agree. I think most people equate Siberia to Saudi Arabia or Texas. Siberia is much larger then all of USA but at the same time the weather is very harsh. I do not think that Siberia is as well explored as Texas or Saudi Arabia, which in turn means that there is potential (but of course no guarantees) that there are additional large oil fields.
Of course, that is what the whalers said when the whales became so difficult to find in the Atlantic. There must be a bunch of whales up in the arctic where we haven't looked yet!!
Better to find the oil (whales) first, plan to use it (them) afterward!!
Ken
I've posted this link a few times and would be interested to know if anyone has an update, or more information from the same source.
Seems there has been exploration in East Siberia. There is a note that there is oil there but much of it in non-anticlinal traps (i.e. diffuse and hard to extract).
http://www.cdi.org/russia/johnson/8399-19.cfm
claassen,
I wish I had your confidence that supplies are sufficient for the next 50 years. Most of the studies I've seen claiming this use a lot of hand-waving compared to the hard analysis arguing for a near-term peak in oil production.
IMO the urgency of the need to begin mitigation cannot be understated.
Clint
First time poster here. I'm not sure if this link has been posted before, but Russian daily energy production numbers can be monitored here: http://www.riatec.ru/en/shownews.php?id=37028&sha=1&sfa=1
Thanks for this BP...and welcome.
Thanks BulletProof, this is a great link. I had no idea Russia would be so transparent in their energy production numbers, yet this link gives daily numbers. If I read it right, it shows they produced 1348.4 tons of oil on October 30, which at 7.3 barrels per ton is about 9.84 million barrels (I'm not sure 7.3 is the best figure to use, though).
Absolutely brilliant link. Perhaps TOD should get a feed off it :=)
Stuart, your comment that you're with "Jim Hamilton in being deeply sceptical that any voluntary cutting is actually going on" is central to the discussion whether the supply/demand balance will tighten in the near future and by how much. If you assume oil producers produce with an eye to maximizing financial return to their oil assets, they will produce in a manner that 1) maximizes total oil produced relative 2) to expected returns for remaining oil in place. These two factors, in my mind, set up a dynamic that disallows predicting with accuracy what any given oil producer will decide as the best production guess going forward. I suspect producers share a real concern about market shifts affecting oil price (people adopting more efficient travel habits, electrification of transport) and about the price at which demand destruction, and economic recession, begin to dig. In my mind, a prudent producer would tentatively tease out these thresholds by withholding producible oil from market, whether by "producible" is meant oil that, if produced, would or would not compromise future production by some degree.
If this analysis is correct, one can expect the production plateau we've seen to continue longer than shorter. My larger point is that discussion about world decline is inevitably uncertain given the dynamic variables at play on the factors I've mentioned.
Why would they be ramping up rig count like crazy if they were saving their reserves for later?
Another beautiful theory rendered nonsense by an ugly little fact.
It might make sense for producers to hold back, but with $96 oil that just does not appear to be happening.
I can think of a reason.
Money in the bank, baby!!!
Reduce the number of rigs available to the competition, oil prices go up, more revenue for the same production.
That's it, I'm buying shares in Rig Reduction Corp. Now, what's their ticker symbol?
About a month ago, I had the pleasure of spending 5 hours with the Chairman Emeritus of the most prestigous petroleum engineering consulting firm in the world as part of the SPE Distinguished Lecturer program. His firm has done reserve/ engineering studies in every major producing area of the world.
He spent a lot of time in Russia over the past 12 years. He told me I wouldn't believe the principal reason for the Russian production increase from 1995 to 2005. They didn't have well tubing that had the tensile strength to run below 1,000'!!! As a result, the bottomhole pumps were set to 1,000' or shallower in all their wells. When they started tubing them deeper and pumping them down, here came the oil.
He said the Russian reservoir engineers in terms of waterflooding etc etc were outstanding. It was never a question of them not knowing what to do.... it was just having the kit to do it.
FF
Edit for time warp
Interesting! If so, that would presumably also account for the relatively low recovery factors seen during the soviet era.
The other limit of my Russian industry knowledge is this. A petroleum engineer I broke out with in Wyoming was deputy director of one major oil company JV in Russia. Lived in Moscow in a compound with 2 kids in junior high "like living in a black and white movie".
I asked him if it was "bird's nests all over the ground compared to working in the US". His response "hell no we were making better wells in New Mexico and Texas with the same money last year".
That's it.. I'm tapped out.
FF
I'm no expert on Russian production, but here was my analysis in January, 2006:
http://www.theoildrum.com/story/2006/1/27/14471/5832
Hubbert Linearization Analysis of the Top Three Net Oil Exporters
Posted by Prof. Goose on January 27, 2006 - 1:47pm
[ED: This is a guest post by westexas...]
My post in the comment section to this January, 2006 article:
And the production boost since. 'New' tech like this is a one time helper... so, its not just lots of extra rigs, its a boost in tech which effect must be fading... gloom.
Yikes.
That would be the kiss of death for low oil cut REDA / submersible production. As I understand it, the key to managing production from those types of wells is having a large enough pump to pump them down, but not so large a pump as to uncover the pump and have it run free / burn itself up. Having a thousand or more feet of standing fluid could dramatically reduce the oil cut.
Russia's very big part in the global peak can not be considered apart from the very large impact of the very large Soviet Union. The Russian production chart isn't a case of a single peak per Hubbert's theory, but what is going to be a twin peak - the first controlled by Soviet thugs and the present second peak controlled by a state run industry that by many opinions including that of Jim Rogers is as inept as ever (a "disaster going on a catastrophe" as Rogers has phrased it). As the production curve shows, their oil industry was pretty dormant in the 30s and 40s, but then was thrown into high gear in the 50s to the early '80s when the Evil Empire went on the war path for world domination. The Soviet economy had little to offer in world trade except a lot of oil. This was their funding for world conquest to the extent that Deffeyes suggested that a more powerful reason for the Soviet collapse than Reagan's arms race was an oil price war OPEC conducted with the less adept Soviet oilfield "managers" - a price war in the middle of an arms race, and they lost badly. I suspect that, during this desperate race with the free world, Soviet oil field management was done more from the point of a rifle than from a geology 101 textbook. This likely produced a lot of reservoir damage from overproduction, although if they were only tubing 1000' deep or less as Fractional Flow says, I don't know how much they would damage reservoirs. Would this mute or amplify overproduction damage? Anyway, they apparently were endangering the world's oil supply to the extent that the U.S. military was monitoring Russia's oil industry pretty closely during the Soviet years. One interesting article is this one written by an Air Force major in Air University Review in 1980. Way back then, he sounded just like Simmons today only talking about Soviet fields and predicting a production collapse by the mid '80s (which, in fact, did happen). He pointed out the big, easily developed fields playing out and the numerous new fields in inaccessible, hard to develope areas with a lot of technical issues. He points out that Russia ambitiously directed over half of their oil exports to Eastern Europe and other parts of the expanding empire, and other geopolitical factors that led to serious overproduction where "...rewards for exceeding goals are given without regard to productivity over the long term ...The consequences are...overproduction of existing fields using low productivity techniques that reduce the total amount of recoverable oil." The major was thus accurately predicting the first Russian peak (a Twilight on the Tundra). But not being a student of Hubbert on the bigger global picture, and narrowly focused on the Soviet run fields, he was concerned about a global oil war developing as soon as the late '80s, with 10 years of cheap oil left.
Stuart,
Just to let you know your graph of the 2004-2006 changes doesn't have KSA. Under the graph you state
So I assume that it's just the wrong graph.
Thanks,
Tim Morrison
Peak oil, global warming, and economic collapse are not the problems, they are the result of the problem. The problem is a collective action problem and an inability to make good long term plans.
What you mention are parts of the problem, but too many people are another bit.
This reminds me of an analyst today saying he would change his sell signal to buy for Citi when they mark down all their securities to the price at which they can be liquidated. The problem is, such a write down would acknowledge they are insolvent, which the pretty talking head might (or might not) have known... at any rate she smoothly moved on. Good planning and working together is good, but not always enough.
Except that we don't have to go bankrupt because of peak oil. We are just choosing to do so.
No - it's just that KSA wasn't in the top five increasers or decliners in that timeframe.
Sorry Stuart, my mistake.
Long term plans? What part of capitalism and representative government is incompatible with long-term plans? Which countries are best at long-term planning? Norway? Sweden? I have more questions than answers, but long-term planning requires some sort of consensus about the direction any government ought to go. This changes fairly frequently in the US. As clunky as our electoral system is, its exercise reflects broad changes in the mood of the electorate. And the electorate as a whole is uninterested in long-term planning. In the US, we can't decide what role we want government to play in health care, transportation, or environmental management. We can't decide whether going to war with Saddam Hussein/Iraq is our long-term best interests (NOT).
rdberg42
As you named Sweden, i can tell you that we have long term planning and emergency plannings from our energy departement and our crisis departement. They are planning for food and energy crisis, but if that will help, i don´t know.
Edit: As i know they are not aware of an imminent Peak Oil. So their implementations of the plans propably will be Ad Hoc i presume.
I am very dubious about any potential for further concerted climbs in daily production of total liquids. However, I am wondering if there might still be a window of opportunity open for some confluence of events to result in a short term spike that could manage to post a new peak?
What I am thinking about is a "one off" thing, not a long term trend. I suspect that the further we go without a new peak being set, the lower the probability that a new peak-setting spike could happen. Yet, given that we are still more or less on a plateau, my guess would be that the probability is at this moment well above zero.
The main reason why this is of any interest is: as long as there is ANY possibility of such a "one off" spike, it would be premature - and damaging to our credibility - to proclaim the peak as already being past tense. "Peak plateau", on the other hand, is probably safe territory.
Which raises the question: What combination of conceivable events (and I do suspect it might take a combination rather than just one) might cause such a one-time spike?
I would agree there's enough noise month-to-month that it's quite feasible for a single month or two to go above the highest so far. However, I'd be very surprised to see overall production go materially above where it is now for an extended basis.
Stuart-
The major question I still have which I'm sure you've pondered at length is
"When does the contraction in World GDP begin?"
Or is it simply a zero sum game... From consumers to producers.
Unfortunately, If I know anything, it isn't about what happens on top of the ground.
FF
FWIW, my thinking on that has been here, here, but also here.
I would think that you could replace one SUV in the West with three Priuses, one in the West, and two in Asia with a significant net increase in world GDP but a net decrease in oil consumption. Goods transportation is a little trickier, but fuel cost is still a very small percentage of the total cost of the item and alternatives are available.
Of course, "Peak Everything" would be a different matter.
Not necessarily if you have to use oil to make & transport those priuses and get somebody to buy those SUVs.
Expensive cars are not replaced with other expensive cars in magic *puff!* manner. They most be sold in an economy that is growing.
That is an interesting question. Certainly, you would think that world GDP is going to take a hit. Peak oil will be a reduction in productivity as more and more effort is required to produce the same good: a barrel of the black stuff. This is kind of like the normal process of technological advancement going in reverse. War does a similar thing by destroying productive assets and disabling and killing productive people.
But global oil production is such a small percentage of world GDP at the moment (low single digits by my back of the envelope calculation) that it isn't clear to me at least that the global economy actually starts contracting because the price of oil goes to $300. The cost of oil isn't going to double every year forever (at least in real dollars); I would guess we get a very sharp spike in prices which then causes mitigation that is implemented over time, e.g. as the vehicle fleet is retired. So, there is a direct hit right away and then less of a hit over time.
And why should there necessarily be an economic collapse? In the 70's the price of oil went up 40 fold and yet the global economy continued to grow, so price alone can't do it. Even more impressive, global oil output since 1980 has been about 1% per year, and yet the world economy has grown tremendously in that time. A gradual decline might not really be that bad.
Ben Bernanke has said that another Great Depression is unacceptable, so the printing presses will run sufficiently to keep people in the US employed doing something. All the debt issues can really be wiped away by a good inflation and that is probably what will happen.
There will certainly be a massive wealth transfer to the oil producers from the bigger consumers. But if we can keep the system going while people adopt new technology, the bean counters in the government can say, "Gee, this $20,000 hybrid vehicle uses technology that a few years ago would have cost $30,000, so even with $300 oil we have a deflationary price environment and economic growth is still strong." : )
This is at least my hope for the future. Living standards in the West are going to go down, but for the average Chinese and Indian, not so clear. Net net, maybe an increase in world GDP. Of course, as a Westerner you may not care so much about the net net part.
I would agree with you, and would not be worried about the economy, if it were just a question of rising prices.
I think damage to the economy is more likely to result from a long-term decline in the amount of energy units available for use.
The economy is a balloon balanced on the head of the energy pin. For example, in a recent article on China in The Atlantic, James Fallows provided interesting data on the degree to which the American service economy rides on energy and labor provided by China. Essentially, most of the earnings from products made in China go to the concept people in America who design and sell the product. While concept/service jobs will certainly shift to new opportunities as the oil decline unfolds, and while we can certainly wring a good bit of economic organization out of increases in energy efficiency, I think there's a limit to the possible gains. After a certain point, I don't see how you can avoid a disproportionate decline in the service/concept economy as the energy prop at the base keeps shrinking.
So, to put this in one line: My outlook is the economy holds up until we can no longer overcome the decline rate with greater energy efficiency, and growth depends on sufficient growth in efficiency to overcome the decline rate at a growing rate.
Then the question, is does it hold up long enough for us to switch to another energy base and if not how much of a decline is there before we do and can resume growth? Of course, many here think that there is no conceivable alternative energy base so there is no direction but down after that. I do not believe that.
Sterling,
The net production decline in the United States suggets that the world production declines can be held to 2% per year, which can be replaced with Alan Drake's Electrification Of Transportation program and the actual joules can be replaced with electricity generated from sustainable sources-solar, wind and nuclear.
One benefit seldom thought about is the actual revenue is going to 100% domestic sources, so the GDP multiplier effect will go to domestic companies rather than foreign national companies.
This is a huge opportunity rather than a catastrophe. Sustainable sources of energy are almost non-polluting and will solve our climate change problems and will provide increased employment in good-paying jobs. It will measureably increase the security of the country, importing 68% of our oil endangers the USA.
We need to get started now!
Bob Ebersole
Except we are oil importers. I'd agree 100% with you if we did this back in the 1970's.
Next if you look at the amount of investment in the US per barrel and extrapolate that to world I think its obvious that the world will not invest in oil production at the same rate as in the US. Not even close.
So yes what your saying was true in 1970 but that was forty years ago. We would have had to use basically all the money we spend on imports for the last 40 years to build a real low oil use society. In retrospect Jimmy Carter was our last hope.
Memmel,
At the ASPO conference someone suggested that we need a celebrity to advance the cause like Al Gore did for the environment. I think that Carter may be that person. He was president, won a Nobel prize, spends his free time building houses for Habitat for Humanity, and energy is one of his issues. Having already launched an energy initiative in the USA he knows what works and doesn't work. He has a movie coming out soon that will put him in the limelight for a while. Last, and by far the most important thing, he is the polar opposite of George Bush.
Now, how do we recruit him?
Tim Morrison
Gore/Carter 2008?
or maybe Carter/Gore 2012?
Gore/Carter 2008?
or maybe Carter/Gore 2012?
Then only God will be able to save the world..
Now, how do we recruit him?
I have a contact (recent) who is close enough to Carter that Carter wrote him a letter of recommendation to get his US work visa. (He also got another letter from another Nobel Peace Prize winner, not Gore). The US immigration Service decided to let him in.
Best Hopes,
Alan Drake
How about Carter and Bartlett go out on a media awareness tour for PO?
Bob, "This is a huge opportunity rather than a catastrophe. Sustainable sources of energy are almost non-polluting and will solve our climate change problems and will provide increased employment in good-paying jobs. It will measureably increase the security of the country, importing 68% of our oil endangers the USA.
We need to get started now!"
You know I just can't find any way to disagree with that statement. :-) Despite what you might think of me personally.
Cheers.
The US decline rate was held at 2% through a massive campaign of drilling and an explosion in the number of rigs and wells drilled. It is not reasonable to assume that such a fate awaits the world unless or until authoritarian regimes allow more open market access to their oil resources. And no, I am not arguing for the IOCs. Iran could do better by allowing private Iranian corporations to compete against the state run oil company. KSA could as well with private Saudi oil companies.
But to automatically assume that global decline rate can be held back to the US decline rate when there is zero evidence of a global drilling buildup like that which occurred in the US is not reasonable at all.
"The greatest shortcoming of the human race is our inability to understand the exponential function." -- Dr. Albert Bartlett
Into the Grey Zone
Several comments on your "facts".
Oil did not go up 40 fold in the 1970's. It went from around $6 per barrel (OPEC price) to less than $30 by 1980, although it did top out at around $32/bbl in late 1981 or early 1982. This is a five to six fold increase, not 40. Also the price of gas in the US went from an average of $0.30 a gallon in 1970 to $1.25 per gallon (1980). So this was again a four fold increase, not 40 fold. I know these figures because my father was in the petroleum marketing business at the time.
The US economy was in the toilet by 1982 with nearly 15% unemployment. I know this figure because I was unemplpoyed for nearly six months during this period (mechanical engr by trade) and watched the reported unemployment figures every week, hoping that the job market would improve. During the early 1980's many US factories closed and companies went bancrupt. A lot of industrial production left the country along with good paying jobs.
So to say that the US economy weathered these 1970's oil price increases (much smaller by my measure) just fine is simply ignoring history.
Mark in St Louis, USA
In Ohio we were getting $2,80/bl ca. 1970,
one month in 1980 we got $38, until the Windfall-Profits tax hit, sending us back to ca. $30.
I don't think that national unemployment topped 11% in 1982,
but this is all from memorty..
If you take "the 70's" to mean the entire period from 1965 to 1982, I believe that prices rose from $2 a barrel to a peak of $40 during the Iran-Iraq war. The latter was just a spike, but I believe the base was pretty low in the 60's. Factor of 20 not 40, my mistake. In any event, it was a pretty steep increase. And the question was not would the West suffer, indeed that was my conclusion. Rather, the question was would world GDP continue to increase during the price rise and there is no doubt that it did.
Part of what happened during the period CLZ09 addresses is that the price rise prompted increases in efficiency.
What makes the calculations trickier is that we need to see increases in efficiency worldwide, not just in the U.S., unless the U.S. can increase efficiency at an improbable rate. And places like China and India can be expected to try to increase consumption at the same time as they are working to increase efficiency, because productive consumption of oil generates wealth, and they know that, and they mean to attain a higher standard of living for their people.
There's been a lot of interesting data posted at TOD regarding the rate at which we and other countries (like Germany) are increasing production of wind and solar power, which is a way of attaining increased efficiency. I believe it was also here that I saw data on the likely limits on the rate of improvement in car/truck fuel efficiency due to the likely rate of turnover for existing vehicles. I believe there's also data out there on the rate at which we can improve transport fuel efficiency by switching from trucks to trains and water transport.
Henry Groppe, Bakhtiari and others have stated in various places that they felt increases in efficiency could mitigate problems from decline for a few years. Unfortunately, Groppe felt that the West had already achieved most of the easiest efficiency improvements.
It would be useful to gather the data and put together some better numbers on the probability of beating the decline rate.
Fuel consumption and travel data for passenger cars and motorcycles from the US Dept of Transportation: http://www.bts.gov/publications/national_transportation_statistics/2002/...
Summary: We had greater fuel efficiency but drove more miles per vehicle. Still, the extra miles driven did not wipe out the efficiency gain, though the efficiency gain we saw from 1975 to 1985 for cars/motorcycles would not be enough by itself to solve our upcoming efficiency problem.
Here is the updated stats for 2005
US car VMT (vehicle miles travelled)
2005 was a record year but it shows signs of slowing.
This is offset by growth of SUVs that are listed here:
US SUV VMT
Average mpg is 16 falling from 17 in the mid 1990s.
Looks like the Prius has had very little effect on total fuel consumption. Perhaps we need to wait a few more decades for the battery people to perform miracle or we perhaps we should stop trying to fix 19th century technology and design something new: Batteryless electric vehicles
TOD numbers on rail vs. trucks: http://www.theoildrum.com/node/2970/238225
A U.S. Federal Railroad Administration study showed railways were 4.5 times as efficient as truck transport:
http://www.fra.dot.gov/us/content/977 and http://www.info.tdri.or.th/library/quarterly/text/s93_4.htm
EIA not very optimistic about solar/wind/geothermal:
EIA sees a small increase in nuclear: "Across the five main AEO2007 cases, nuclear generation grows from 780 billion kilowatthours in 2005 to between 799 and 1,010 billion kilowatthours in 2030 (Figure 58)."
Link: http://www.eia.doe.gov/oiaf/aeo/electricity.html
The EIA reference case is, by definition, the status quo.
Further, EIA projections are notoriously unreliable, especially for renewables.
The UK's projections on wind, wave and solar: http://www.telegraph.co.uk/money/main.jhtml?xml=/money/2007/05/24/ccrene...
Energy efficiency in Germany, 1991-2004: http://www.odyssee-indicators.org/Publication/country%20profiles%20PDF/r...
Another view of G8 and G5 energy efficiency prospects: http://assets.panda.org/downloads/wwf25may2007makingenergyefficiencyhapp...
China has 5-year plan of reducing energy consumption by 4% a year, but misses its first-year target (Beijing, however, reported makes the target): http://www.scidev.net/content/news/eng/china-misses-energy-efficiency-ta...
More on the China situation: http://www.nytimes.com/2007/10/24/business/worldbusiness/24power.html
A big part of the damage to the economy was a decision by the Fed to dramatically reduce inflation by raising interest rates. That inflation was only partly caused by oil prices - much of it was caused by Vietnam spending, and the decision by the Fed in 1972 to accomodate that spending with an increased money supply.
People keep bringing this up, but I have already heard criticism that the peak in oil has been predicted many times in the past and was always wrong. It seems to be a standard argument used by deniers, so I'm wondering how important it really is.
I heard an interesting analogy once where some people were continuously filling some container and were warned it was going to burst. It didn't burst, so they kept on filling it, until finally (of course) it did burst. I can't remember where I heard it though.
I for one can certainly tolerate some variation in the dates of the predictions for peak, hopefully this means the decline rate will be manageable.
Policymakers hopefully are capable of seeing past a temporary rise in production when a new project comes on line.
Clint
So. What is the longest time, previous to the current one, that the record global maximum production of oil held?
Once we've gone 50% longer, and definitely at 2x longer it will be very safe to put forth the idea to the masses.
Make sure to count only crude+condensate, since that's what Peak Oil is about. It is not about ethanol or natural gas or coal to liquids.
Thanks for responding. You indicate that the accuracy of predictions for timing of the peak is important and care is warranted to maintain or improve our credibility. I can understand where you are coming from since the accusations have already been made that we are just "Chicken Littles". The point I was trying to make is that this accusation will be made (is being made) anyway by those who wish to continue businees as usual.
Taking this line of thinking a little bit further, perhaps we should focus more on when declines will reach unacceptable levels rather than calling a "peak". It seems to me that Stuart is going this direction as well, unless I'm mistaken.
FWIW, I am under the impression that we are on a plateau and production will not change appreciably in the next 5 yrs or so. We have this competition between above-ground factors, declines, and new production coming on line. It's anybody's guess whether production increases or decreases in this timeframe.
But what seems certain to me is that after the last megaproject comes on line we will start to see an irreversible decline begin. I think this is something that most of us can agree on. Westexas' ELM is another concern that can be used to create a sense of urgency.
So what I'm saying is that we should side-step this issue. The real fight is proving to policymakers that reserve growth and unconventional oil will not be sufficient once conventional oil production begins to decline in earnest.
Clint
Stuart, good stuff. In particular I like the bar charts that frame the problem particularly well. If global production is to rise significantly from here - where will it come from? And bearing in mind that that 4.5% decline eats the first 3.8 mmbpd of new capacity every year.
I agree that Russian production looks strained and is unlikely to rise significantly from here. So that leaves Saudi. I still believe that Saudi can and will raise their game. Two issues here, however:
1. Quite a bit of the new capacity coming on is NGL and NGL in Saudi seems to contain a lot of ethane.
2. I suspect that the Saudis may choose to not push their reservoirs to the max - what would be the point?
Your global plateau chart is begining to develop unwelcome signals:
Production is drifting lower
Recent high price suggests strong demand
And global inventories are falling
So recent lower production seems not to be a function of weak demand.
Euan-
Looking at the Exponential decline equation
Np= (qi-qf)/D
If we take D as 8%/year like that Saudi prince said was their "no activity" decline ....
And consider that their making 3.5 billion barrels per year more or less suggests they are tied to a reserve base of some 44 billion barrels.
And this is something I thought I'd never say- that makes the HL intriguing.
Then contrast with the fact that they claim I believe 260 billion total proven with 130 billion in development (PDP).
It should be no great feat to make 3 billion barrels a year from a 130 billion barrel pool.
The volumetrics is telling everyone something but the performance is saying something else entirely.
The exponential no work decline is the exponential no work decline.. and it is my experience that it does point you at a target.
FF
SA is already downplaying their ability to ever produce 5B/y, which should also be no problem if current pool is 130B, plus another 260B just waiting in the wings... if they can't produce 5B/y at any point in the future, maybe they won't be able to produce 3 for much longer.
Wonder where those 260B are hiding...
Well, but probably that 8% a year is not uniform, but is really 16% a year on half the assets in production (eg North Uthmaniyah, parts of ADS, etc), 0% on the other half (eg Haradh), and a bunch of assets that have been very lightly utilized so far (Khurais, etc) (Or some similar partition - this is just a rough illustration).
In reality, it never is but it tends to all come out in the wash. I'm 100% certain what you're saying is true though. We know 60 billion barrels (1/2 nearly of the PDP) is Ghawar though, so take a 16% decline on the 1.5 billion barrels per year.... that's a 10 billion barrel pool and pretty soon you need another shovel to dig with.
FF
PS- I gave you 50 responses re: Russia to get here but still pardon my indiscretion.
FF
FF - I'm unsure what a "no activity" decline rate tells us. This is the UK, all fields developed up to 1999, not showing fields developed since. The underlying decline rate is 13% - but that is not no activity cos there was lots of drilling going on in the fields shown. If we add in the new fields, decline drops to 7.6%.
http://www.theoildrum.com/story/2006/11/19/135819/75
This shows a summary of the Saudi reserves forecasts that I presented at ASPO Houston. You see that they range from 40 to 155 Gbs (if you have good eye site, click chart to enlarge), excluding the Armaco forecast. My own estimates here are minimums, and so lean toward the Campbell end of the spectrum.
In Houston, Walter Youngqvist gave me a copy of a paper he wrote with Richard Duncan in 1999. They show a peak in Saudi production in 2011 (like I do) but also forecast a peak in global production in 2006/7. This has really grabbed my attention. I'm writing a post on this.
All the best, Euan
With regard to your UK Offshore plot...it's worth noting that the first peak in 1985 was done with 32 operating fields. When production declined in 1986 it was "still" with 32 fields.
By the time the decline was arrested in 1992, the number of operating fields was up to 55 and by the 1999 peak the number of operating fields was 136. By the end of 2006 (with the decline in production), the number of operating fields was 171 (out of a total 205 drilled, some already depleted and shutdown).
It looks like the Brent field will "go away" after 2007 or maybe early 2008 (Piper, Fulmar, Thistle, and Dunlin also look like they are on their final legs).
We are getting less and less from more and more holes in the ground.
Euan-
To me the "no activity decline rate" tells you what PDP --proven developed producing reserves are. Everything else isn't.
FF
Thats the type of number I came up with trying to come up with a "no activity" decline rate.
It could still be a bit high since basic technical advances are still causing inflation. No activity with MRC wells is different from no activity with vertical wells.
In either case your no activity number and mine are fairly close and less than even HL predicts.
Your forecast shows the sa 07 decline continuing in 08 on account of reduced oil even as ngl grows a bit... then more later as both oil/ngl rise. Where did this forecast come from? Seems to conflict with sa promises to boost prod in nov, which I thought meant until further notice.
JK
I had this post on Saudi oil reserves and forecasts back in August:
http://www.theoildrum.com/node/2910
This was based on C+C+NGL. I've since redone the forecast using C+C only - shown below.
The charts are datumed on 31 Dec 2006. So the drop you see is for 2007, building slightly into 2008.
The funny red sliver is a charting problem.
Thanks, i remember teh chart now. What I meant was, what is the basis for reduced oil output in 08? I see 9M/bd end 07, what happens throughout the year obviously important as we slide into recession.
This is a conceptual capacity forecast - built on the work we did on Ghawar, switching Abqaiq on and off to meet demand (conceptually), building on new projects etc.
So my guess would be, heading into a recession, that the Saudis will cut production to match demand, and let their reservoirs and staff have a rest - at what level they choose to support the oil price is anyone's guess. 60 euros maybe:-?
Hello SS,
Thxs for the keypost! I recall some earlier postings that global warming has shortened the frozen days across Canada and Alaska: thus reducing the time to move heavy equipment, then drill, or run pipelines, etc, across the tundra.
Could this also be happening in Russia? Even if they had more rigs and other equipment: the time period to get work done is shortening--aka, the Law of Receding Frozen Tundra?
Bob Shaw in Phx,Az Are Humans Smarter than Yeast?
"Thxs for the keypost! I recall some earlier postings that global warming has shortened the frozen days across Canada and Alaska: thus reducing the time to move heavy equipment, then drill, or run pipelines, etc, across the tundra."
Just another positive feedback loop, Bob.
I guess you are now living with your mam..? Good for you
Edit: Good for her!
I my opinion this paper is illustrating the technical inflation of URR in this case via increased rig count and probably better drilling practices. For methods like HL that are symmetric about the peak and use production data to estimate URR this will tend to inflate the predicted URR.
Drilling more wells does not increase URR but simply the rate of depletion. So the peak in production can be seen more a a result of the decreasing effect of drilling more wells combined with the intrinsic geologic depletion. HL URR includes both effects equally while technical boosts actually result in increased decline rates in time and a lower real URR. A large percentage of the boost in Russian production can be attributed to simply drilling wells faster and the real URR should be calculated by correcting for the non-linear drilling campaign.
Have you had a chance to look at the thesis by Aram Mäkivierikko titled Russian Oil: a Depletion Rate Model estimate of the future of Russian oil production and export.
According to the abstract:
This analysis would seem to offer further evidence that at most a small increase in production is likely, and that decline in the near future is quite possible. It is interesting that according to his paper (page 45), the reserves of the ten largest oil companies in Russia are only 82Gb. These reserves are thus near the bottom of the range (70 to 120 Gb) Aram is analyzing. If these reserves are close to right, decline in the near future would seem likely.
This is a link to the actual thesis. It is a very slow-to-load PDF.
http://www.tsl.uu.se/uhdsg/Publications/Aram_Thesis.pdf
I skimmed it, but the error bar on the conclusion seems to be enormous (because the input numbers have large uncertainties). I'm suggesting that looking at the rig counts pins the situation down a lot tighter.
there should be a lag between adding a rig and boosting production, say three months, maybe longer in cold climates. Also, if rigs are being used to explore for new fields, the lag would be years.
How strong is the correlation between rigs and production, and what lag generates the best correlation?
Russia seems to be kicking out foreign firms, if so we may see less effort in finding/developing new fields, bringing peak forward but stretching the tail (actually, other things are helping in this regard, from chavez to iraq war to possible war expansion.)
Have you tried this indicator (Rate of increase in oil production per rig) on other countries and is it an indicator of an impending production decline?
One problem with the rig count is that the amount of exploratory rigs versus reservoir maintenance/enhancement rigs is not available. It is also somewhat related to prices.
August 2007 Crude Oil only on a global basis tanked. Yikes.
www.gregor.us
IPM just out, around 15:45 New York Time:
http://www.eia.doe.gov/ipm/supply.html
Russia not looking so hot either.
The killer fact: August 2007 production at 72.5 Mb/Day compares to the all time high of May 2005 production above 74 Mb/Day, when Oil was exactly half the price it is today.
The symmetry is uncanny. 48.00 vs 96.00
Holy Moly.
Gregor
Stuart,
A few days back Total's CEO, Christophe de Margerie, said that:
This at least partially contradicts the common assumption among peak oilers that the best prospects are always drilled first, then the next best, until we get to the dregs. But it is something that an economist could predict would occur once perception changes and the resource is regarded as scarce and finite with no good substitutes. (i.e. if the value of a resource is likely to increase in the future, it makes sense to defer development)
And it would seem to open the door to the possibility that the marginal return on drilling activity could improve in the future. Some of those rigs could now be picking at 3rd rate prospects but will, in the future, have a chance to have a go at 1st or 2nd rate fields.
Now that biofuels are an obvious bust and reserve growth stinks worldwide despite high prices, what are the odds the Russians are nihilists right out of Dostoevsky?? :-)
I would be curious about what 1st or 2nd class fields are being held back (apart perhaps from ANWR). Any specifics offered? It still just seems like speculation/excuses to me. Unless, it really just means they will produce 1st class fields conservatively to maximize long-term production rather than overproducing for quick profit.
peakearl,
I suspect that this has been the case in Venezuela where the "havy oil" bitumen fields were offered up to multinational oil companies and the great offshore blocks were leased to PDVSA, the Venezuelan national oil company. I don't know enough about foreign geology to prove this though. And, I also think the same has occured in Russia and Siberia.
And, in both Venezuela and Russia, multinationals are being forced to sell their production now that it has become profitable to the multinationals. This is not new behavior on the part of National Oil Companies, its how ARAMCO was formed, by a forced sale of producing assets. Bob Ebersole
Another way of putting this is that I can't avoid thinking that Hubbert's work is flawed since there is no variable or constant that represents Hubbert himself.
Now and in the future, we have to distinguish between declines caused by geology and those due to new beliefs about depletion. (deferred production because the resource is now believed to be finite and scarce and without good substitutes, and likely to be more valuable in the future)
Can we do this without knowing the pattern of development within oil provinces?
And yet it's this pattern of development which will determine the shape of the world's production going forward.
It's been known forever that individual metal mines and districts deplete and eventually run out of ore, and that prices fluctuate, and that gold prices, for example, can rise suddenly. Yet I can't think offhand of any example of a rich deposit, once discovered, being left fallow, as it were, when economic conditions allowed it to be placed into production. (Lower grade or deeper deposits, on the other hand, may be left fallow for decades, until prices rise enough to make them profitable.) It's theoretically possible, of course, but examples don't come to mind. Consequently, average ore grades and ore-to-waste ratios (for open pit mines) have decreased with time, as the nearest-to-surface, richest ores were mined first. Hubbert linearization, as I understand it, depends on this sort of "diminishing returns" assumption.
Put differently, human lifetimes are short, and everyone wants to get theirs while they can, because they may die tomorrow. In a free enterprise system, you want to increase the value of your own stockholdings, or year-end bonuses, or whatever. In a totalitarian system, you want to employ as many miners as possible, or maximize your ability to buy foreign wheat, or enrich your Swiss bank account, or whatever. Energy is hardly unique in this regard. People, corporations, and governments tend not to leave money lying inside the ground, any more than they tend to leave it lying on top of the ground, unclaimed.
Family ties or impending death may change the Hubbert equation, owing to a desire to pass wealth on to offspring or charities (forms of individual immortality). The Guggenheims and the Rockefellers notwithstanding, world production is unlikely to be affected appreciably by such motives. (Neither family left undeveloped mines or wells behind.)
Promising sites where drilling and production are expressly forbidden by treaty or law (e.g., Antarctica, national parks) are probably also negligible in terms of worldwide production statistics, with metals in the deep seabed perhaps providing an exception. When there are none left elsewhere, they might be put into production (provided that there is still a market and the means).
I was tempted to reply with the famous Gregory Bateson story about the New College at Oxford oak trees
http://www.pulsethebook.com/index.php/index.php?tag=gregory-bateson
but while googling, came across this 'debunking' of the story's basic premise:
http://books.google.com/books?id=Jmn1GgMGFRAC&pg=PA40&lpg=PA40&dq=gregor...
so, yeah, I'm inclined to agree that valuable resources are 'mined' as soon as is practicable and not left intentionally for future use.
(geez, it was such a good story too.....) :-<
A few points, though:
1) What we are talking about here is a vital scarce resource that is finite and that has no substitutes. On top of this, it is perceived to be in depletion. As far as I know this is a rather uncommon situation. Where else has it occurred in the modern world?
The only thing remotely comparable that comes to my mind is land. The existence of the US system of national and state parks and it's vast reserves of public lands etc is all inexplicable and incomprehensible until one looks at the history and sees how attitudes changed remarkably once it became clear that land was a limited resource.
Almost 90% of my home province of Ontario is held by the government as public land. It has been thus for a 150 years. Why wasn't it auctioned off a century and a half ago?
There was considerably less at stake with those conservation efforts than is at stake now.
2) I don't see how the history of oil production is any kind of deterministic guide to the future when the situation now is unprecedented and perceived to be such. In fact, the very public failure of biofuels has become obvious only in the last year or two. That changes things.
3) The profit motive, just plain good business, can play a big role. You wanna sell now for $90 or in 2012 for $300??
4) The time horizon for this sort of planning is well within what many people operate. Can't explain the existence of high school graduates, let alone doctors and physicists otherwise.
Land is perhaps not the best comparison, because it's not depletable (at least in theory), and its usage can always change, given sufficient pressure on the government. Also, why should a government ever auction it off, if it can raise taxes instead to obtain revenue? In any case, I was talking about metals, which have always been recognized as depletable (although some can be recycled, unlike energy). We all agree that oil is unique - we are arguing more about human nature, perhaps.
If I fear that oil will be largely replaced by, say, electric power, or that a global recession is in the offing, why wouldn't I sell now for $90 instead of waiting 5 years? Energy prices, as well as metal prices, have been highly cyclical in the past (mainly depending on economic cycles), and giant price swings may well become more common in the future, as the system becomes more tightly wound and unstable. In other words, what is the NPV of leaving that oil in the ground, if I can sell it now to buy something I badly need (even if that need is simply to avoid domestic social unrest)? That need is one basis of the ELM concept, as I understand it.
Long term planning is based on the implicit assumption that the future world will closely resemble the past world. Government planning may well become more crisis-oriented (very short term) in the future. Individual planning likewise. For example, if I have been saving for many years for my retirement, and now find that I may never be able to afford to retire (and may die) because of peak oil, should this encourage me to take the money out slowly as an annuity over my expected long lifetime, or to demand a reduced upfront payout right now? Or if I am now a senior majoring in economics, should I spend the next 5 years at a very expensive graduate school (e.g., Harvard or Chicago) to get a Ph.D. in economics, or should I ... (you fill in the blank)?
I think that represents a bit of failure of imagination. There might not be good direct substitutes but there will be other ways to do transportation. I think that electricity based is the most likely since we have abundant potential sources of generation in nuclear, wind and solar.
There might not be good direct substitutes but there will be other ways to do transportation. I think that electricity based is the most likely since we have abundant potential sources of generation in nuclear, wind and solar.
The aircraft disagree.
I guess large ships could go back to dirty coal. Who is going to enforce environmental regulations on international waters with no inspectors for thousands of kilometers?
I agree, "no good direct substitutes" is better.
I do believe that one reason producers don't hold back more production for the future than they do is that they have a healthy fear our ingenuity.
That argument is often advanced, but it doesn't work. If the economic logic is true, then many producers would stop or delay production. This would cause the current price to skyrocket up to $300. So now the remaining producers benefit, while the idle producers sit on their hands. Any CEO who did this would be fired immediately.
Businesses work on cash flow, if they have no money coming in, they go bust. Additionally, businesses benefit from volume of scale, therefore it is better to overproduce as costs/volume reduce, so the profit margin improves. As no one can predict the future exactly, it would be an incredible risk not to sell at $90. Most businesses do not like taking big risks, certainly not ones run by accountants.
Businesses need to make profits now, because investors want a short term return.
So there are a whole bunch of reasons why businesses (primary producers) operate to take profit now, rather than gamble on a hypothetical price the future. Obviously there is a whole industry of speculators who do gamble on the future, but they are specialised in the high return/high risk market. They do not manufacture or produce actual products though.
The only way it can be done is to have a 100% monopoly on the market, and have complete of control prices. The only product I know of like this is diamonds, where de Beers run a near-complete monopoly. de Beers sit on a huge stockpile of diamonds, which they restrict supply of to maintain a high price. Diamonds are compact to store, and don't go off, which makes it feasible to do.
In the normal case, what we expect to see is that resources are exploited as fast as possible and then abandoned, which is exactly what happens in practice (99% of cases).
See my post below technical progress also plays a large role especially for marginal deposits/fields. Across all types of resource extraction from coal mining to oil to gold we have made tremendous progress in our ability to profitably extract deposits. And to a lesser extent increase the total yield.
HL implicitly includes a LOT of stuff by its nature. Thats not the problem the problem is it assumes a guassian like decline pattern for all its inputs. This is not true for things like technical progress which tend to grow close to exponential then flatline with no slow decline. I think investments follow the same pattern the increase increase then stop. So at least two of the critical inputs into HL are not even close to guassian. Discovey geology and probably the overall drilling program are guassian.
Its these non-guassian inputs that scare me.
Marginal deposits are perhaps more common in mining than in oil. Over the past 100 years, there have been two major improvements in metal mining technology that have allowed ever lower grades to be processed at a profit - 1) so-called selective flotation used to concentrate ground-up sulfides in mills and 2) heap or in situ leaching with various reagents and technologies (depending on the metal). Most of the other changes (as in agriculture) have involved the substitution of giant machines running on cheap fossil fuels for expensive human labor.
If an underground mine runs completely out of ore, its production may indeed tail off gradually - this commonly indicates that contract miners are undertaking the dangerous task of "robbing pillars" of high-grade ore that have been holding the up the roof (compare last summer's room and pillar coal mine disaster in Utah). An open pit mine can close suddenly with plenty of good ore left in the ground - it is just that the so-called stripping ratio has rendered it uneconomic (too many tons of surrounding waste must be removed to get at an additional ton of ore in the bottom of the pit). If metal prices increase faster than energy prices, the mine may later reopen. If energy prices increase faster than or at the same rate as metal prices, the remaining ore will remain forever in the ground. In this regard, a huge spike in energy prices might force the temporary closure of every major open pit mine in the world (unless perhaps they were mining coal or uranium), at least until they could raise their prices in response. Operations depending on hand-mining and hand-sorting of ore, such as still practiced in many parts of the world, should remain relatively unaffected by energy costs.
Individual metal mines may close suddenly for plenty of other reasons - strikes, floods, ground collapse, underground fires, etc. After a while, it generally is too expensive and dangerous to reopen them, unless metal prices really increase drastically.
This reinforces my opinion that the technical/financial curves for resource utilization often have nothing to do with a gaussian. Often they are shark fin type curves or other shapes. A guassian is not the correct approximation.
In almost all cases the important point is that production effectively goes to zero when technical or finiancial incentives or the end of technical progress no longer make reasonable to extract. Certainly mines reopen but the point is that using this information under the assumption that past performance is a good predictor of future performance is tenuous at best at worst it results in massive over prediction of the final outcome especially as these factors become on favorable.
Underneath the covers the reason that decline far more rapidly than exponentials is because they suffer feedback.
To my knowledge no one has attempted to correct our production forecasts for these effects and as you can see they can dramatically effect the results.
My attempts to get a order of magnitude answer leads me to believe they are responsible for at least 50% of the oil extracted since about 1980 or so when oil extraction technology improved dramatically. Even if I'm way wrong and its only say 10% it still must be accounted for and URR estimates corrected downwards by a fairly large margin and future decline rates adjusted.
Memmel, you are truly an original thinker, and I appreciate your posts.
I see no reason to disagree, although the "drop off a cliff" pattern of individual mines or districts might not be reflected in the sum for all districts, except in the case of worldwide price crashes (demand drop) or production cost (energy cost) increases. Peak metals (in the near term, at least) likely wouldn't mean we're running short of metals - only that energy costs had made them an expensive luxury, because the cheapest ores had always been mined first. Not all geologists would necessarily agree about not running short of metals, and the pattern would probably depend on the metal (see the discussion for uranium in the Deffeyes book, Beyond Oil, p. 140-146).
Your excellent point about oil extraction technology increasing the slope of the drop off, and decreasing the post-peak URR was earlier made by Colin Campbell, I believe, who used the rapid decline of the North Sea fields as an example.
To date at least the pattern of development has tended towards maximizing production even in KSA which has deployed the latest technology. KAS does seem to generally manage per well production in a conservative manner but that does not mean they don't use the latest well technology which increases extraction ability.
Lets say a modern well can produce oil at 5 times the rate of one in the 1970's running said well at say 70% of capacity does not change the fact its 500% times more efficient than older wells.
These are not real numbers but you see the point. My best guess it that our extraction efficiency has at least doubled if not tripled since the 1970's.
I define extraction efficiency as the rate you can produce a reservoir under a given set of constraints. Obviously some reservoirs where basically un-producible in the past but thats and outlying condition.
I'd love to see a comparison of similar reservoirs developed say from 1960-1980 and one from 1980-current. I dunno where this data is.
thanks Stuart.
I have also felt for sometime that the future of our plateau depended more on Russia than anyone else.
As you show, Russia was still the largest contributor to production growth even in the 2004-06 graph. I do not think we need Russian production to decline for the plateau to end - simply going into flat production will probably be enough.
When we lose that 200kb/d increment from Russia that we've had each of the last two years, we lose the biggest chunk on the positive side of the balance sheet.
On a total liquids basis, OPEC would need to achieve and hold +200kb/d for us to reach previous global production levels, then they need to gain and hold another +200kb/d every year to replace growth lost in Russia.
On a crude and condensate basis, OPEC would need to achieve and hold +600kb/d for us just to regain previous global production levels (which thus requires even more than their November announcements). Then they need to gain and hold that further +200kb/d every year to replace growth lost in Russia. Then, IF all the other recent winners (Angola, Brazil, FSU and Canada) can keep making the same gains, we might just about hold the current plateau.
Sounds like a hard ask to me.
cheers
Phil.
This is what makes me wonder about the true nature of the plateau. If it was just geology how did we manager to plateau in the first place and go through strong growth in the last few decades with no major discoveries.
From a discovery perspective we probably have done a fair job of exploiting them by the end of the 1990's if you look at the discovery curves. The shock model and a few others use shifted discovery I noticed that shifting forward to give a peak production in the 1990's seems to work fairly well. Growth since then seems to be more based on a combination of two factors. The collapse in price at the "peak" and technical advancement. The reason I feel like setting the real geologic peak in the 1990's is this is when prices collapsed and signaled that we had the most oil available ever.
It took a while to burn up all this oil and the real peak was hidden by the price collapse and then the collapse of the Soviet Union. Later as the price increased we also continued to make a lot of progress in oil extraction technology and this allowed use to continue to increase production even though we were probably well past peak.
So it looks to me that the current plateau is more from technology reaching its limits coupled with decline rates becoming so high that they cannot be overcome. If technical advances have flat lined this means that we will effectively see the real underlying geologic decline rates and pretty much nothing we can do about it.
As was point out in this post even a exponential increase in the drilling campaign could do little to offset declines. But the underlying geologic decline rates are not the ones for a system at geologic peak but ones for a system thats well past peak so the curve is not symmetric but heavily distorted with the bulk of the oil extracted on the front side.
So I think your numbers are right but we should be seeing real production decline rates starting to accelerate and technology no longer helps. The probably will double every year say 2% 4% 8% 16% this leads to us starting to lose a increasing amount of production each year something like 500kb say for 2006 1mbpd for 2007 2mbpd for 2008 and 4mbpd for 2009. This means production will probably basically collapse because of external factors in 2011-2012.
This is I think close to the real treadmill we face.
And of course throw export land on top and things move a bit faster.
There were a couple of comments about the decrease in the season when the tundra is sufficiently frozen because of GW. I remember reading about Alaska changing the formula a few years back. The old formula (supposedly) had been pretty ad-hoc, but was perfectly acceptable as the length of season was long enough. Then with GW the season roughly halved, and the forumula was adjusted -allegedly because research was able to better delineate the safe conditions. My gut impression is that Russia probably doesn't allow environmental considerations to have much of an impact on development.
http://www.themoscowtimes.com/stories/2007/11/06/017.html
Tuesday, November 6, 2007. Issue 3779. Page 2.
Putin Warns Russia Has Enemies
By Anna Smolchenko
Staff Writer
Shouldn't the price axis be in Euros? That's how OPEC thinks about effective oil prices, so if we want to measure prices from their point of view, wouldn't that be better?