US Peak Oil Adaptation: Prognosis in a Credit Crunch
Posted by Stuart Staniford on September 2, 2007 - 10:00am
Let's first review the situation to date. I began worrying that we might be essentially at peak oil already back in November 2005. This was the date of Ken Deffeyes' famous prediction based on Hubbert Linearization, but my concern was based as much on the plateauing of the monthly oil production series in spite of high prices. As more evidence emerged, I firmed in my view that peak oil is probably about now.
A couple more years of data have not changed the picture much:
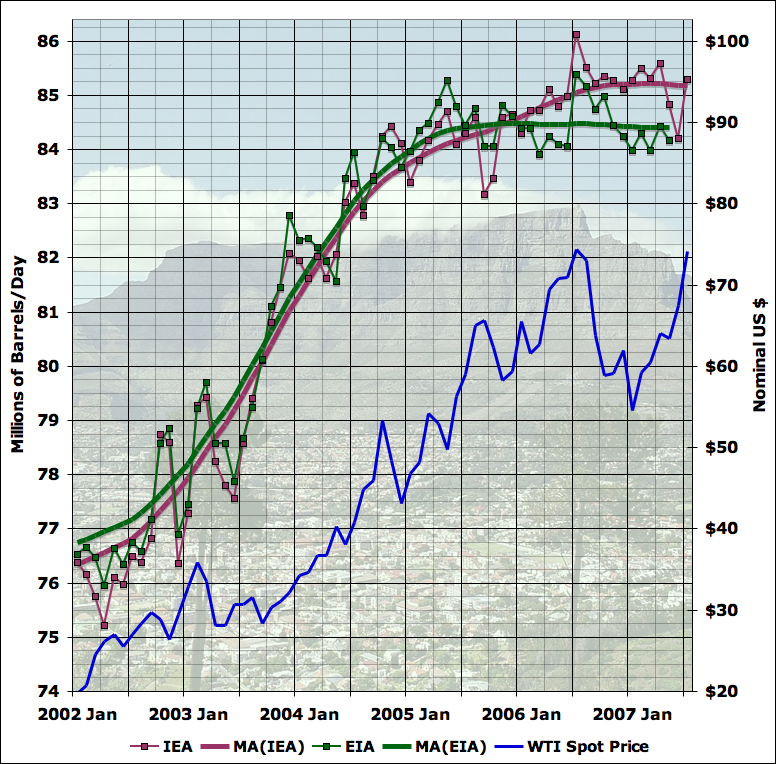
The EIA data for total liquid fuels show a plateau since early 2005, while the IEA data increased slowly for a little longer but have shown a plateau for the last year. Looking at narrower definitions of oil produces a broadly similar picture:
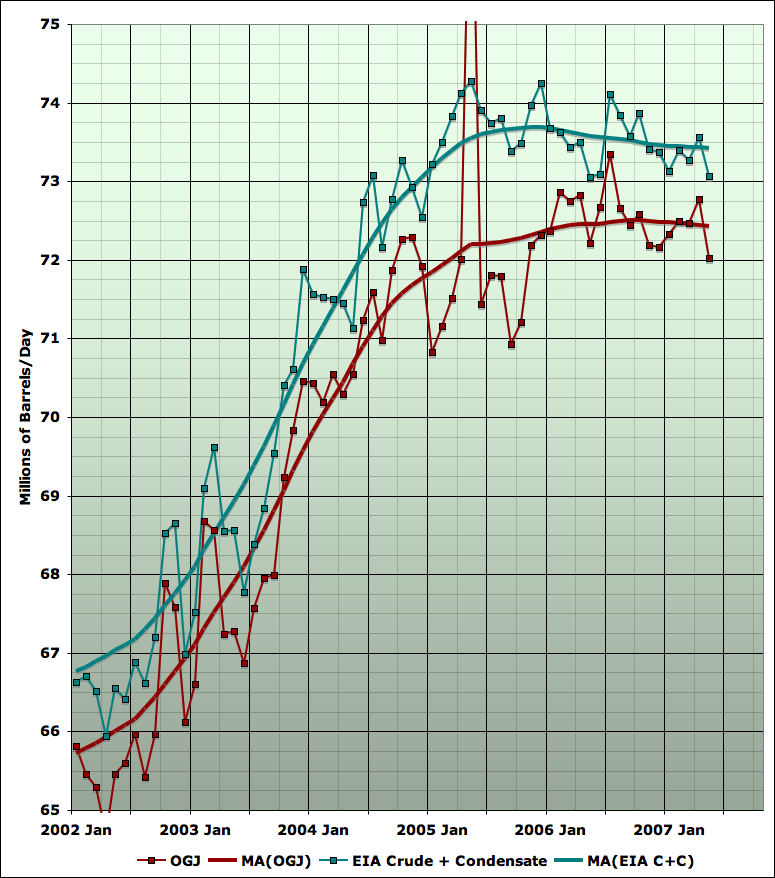
The EIA's crude plus condensate actually shows a very slight decline since a peak in late 2005, while the Oil and Gas Journal series for crude alone has a gradual increase to a plateau in 2006 and 2007. For more background on this plateau debate, see this tutorial post - I used to track this stuff every month but it got boring.
In my view, the immediate cause of this oil supply plateau is that Saudi Arabian oil production stopped increasing, as of late 2004, and then began to decline: at least part of this is likely due to the depleted state of North Ghawar. If this unsourced graph is to be believed, Ghawar production has declined 1mbd (20%) from 2005 to 2007.
In looking at United States adaptation to the situation, I've primarily focussed on usage in road transport, which represents about half of total US oil usage (which in turn is about a quarter of global oil usage). And historically, the transportation sector is the least elastic user of oil in the US.
It's convenient to separate road transport usage of oil into two factors: the total vehicle miles traveled (VMT), and the efficiency with which the vehicle fleet currently uses oil. The recent trends in vehicle miles traveled I've studied in detail in the past, but here's an update:
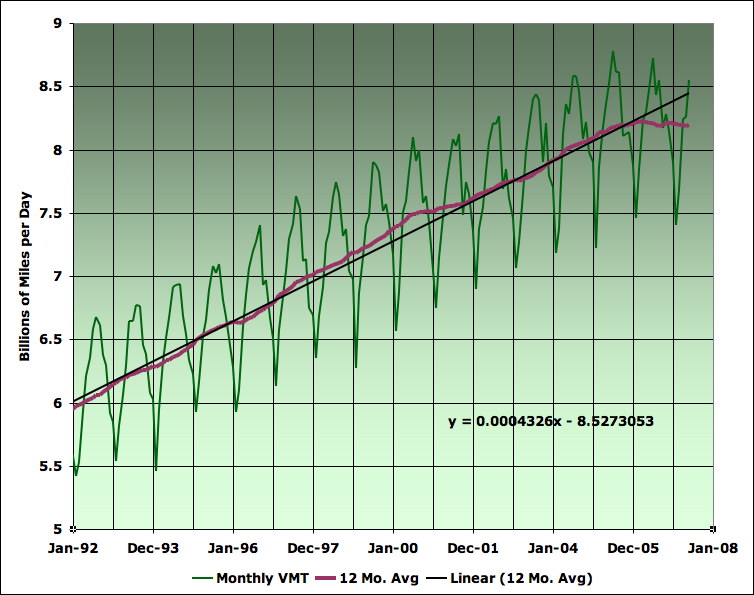
Basically, increases in VMT were fairly steady over the last 15 years until late 2005, when VMT flattened out and began to decline slightly (broadly coincident with the plateauing of global oil supply). This isn't altogether good news. Historically, there's a decent correlation between changes in US miles travelled and overall economic growth:
On this basis, I suggested in 2005 that the (then) drop in VMT growth would presage a drop in economic growth, and refined this at the start of 2006 to a prediction that the US economy would enter recession in 2007 (a prediction based on my perceptions of the bursting of the housing market bubble also). I may have gotten the timing at bit wrong, but basically that still looks close, and we may get there by the end of 2007.
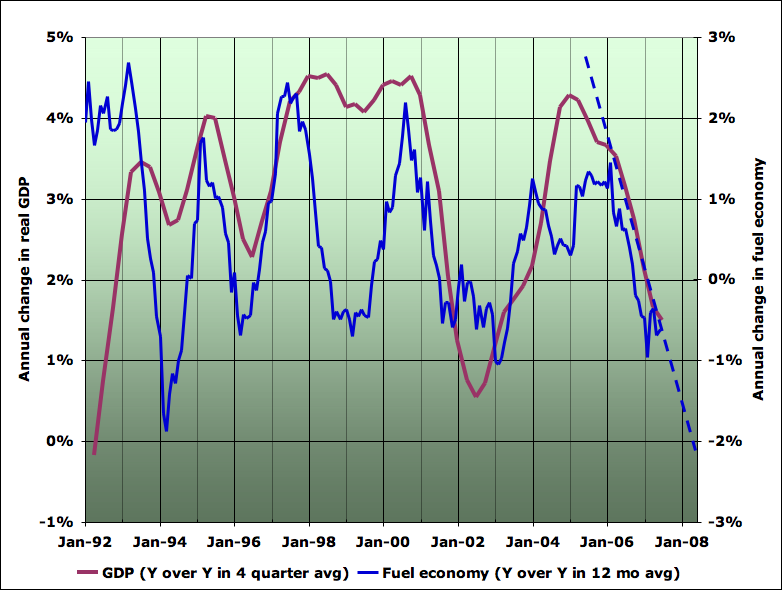
This next graph updates that VMT-GDP connection with the monthly data over the last 15 years (through May 07 in the VMT, and Q2 07 in GDP).
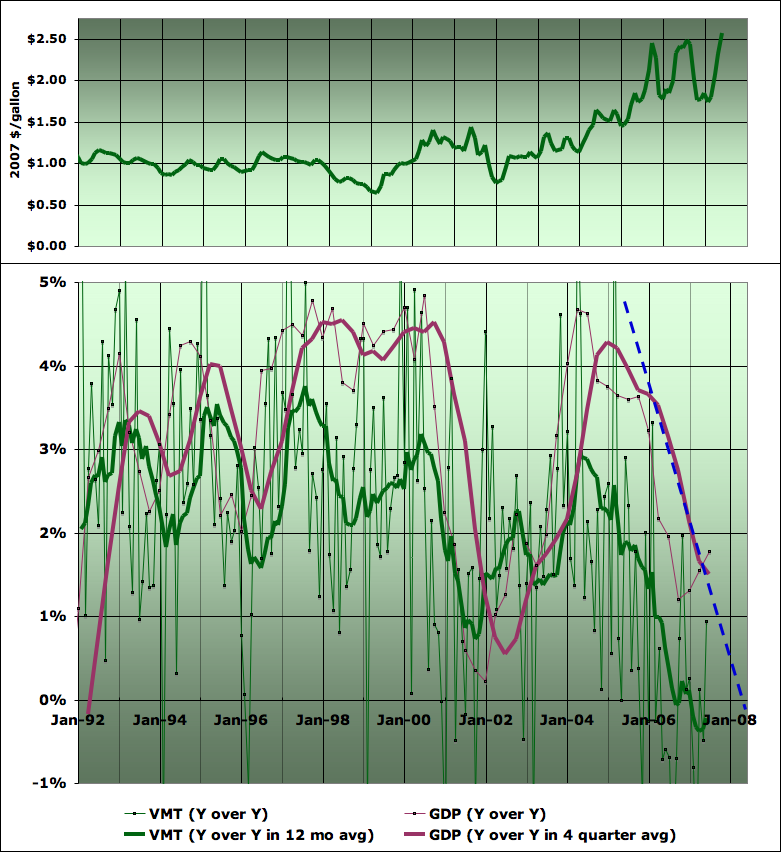
I've also put the increase in gas prices in the top panel for context. However, I think it's important to stress that I'm not suggesting high gas prices are the sole cause of the drop in VMT (and GDP). On the contrary, I think those movements are likely multiply caused by both the oil supply constraint (which required some drop in vehicle usage somewhere), and the housing bubble bursting and resulting economic slowdown (which has been a major control on who has had to do the conserving). More on this in a moment, but let's turn to the other factor in road transportation oil usage - average fuel economy.
The news here is pretty bad - progress is essentially non-existent. I've discussed my methodology in detail before, but essentially I'm dividing the total number of vehicle miles by the amount of gasoline consumed, with an approximate correction for diesel vehicles. So this next graph represents the average fuel economy achieved by the entire gasoline powered fleet on the road (ie not just the fuel economy of new vehicles).

As you can see, fuel economy has been getting very gradually better over the last 15 years, but the trend in the last couple of years is actually getting poorer not better as one might hope. This is in contrast to the reaction to the seventies oil shocks, where, once things got under way, deployed fleet fuel economy improved by several percent per year. People really have not gotten the message yet - in part, they may still be treating the high gas prices as a temporary situation, rather than perceiving it as an important long-term need.
However, I also hypothesize that part of what is going on is as follows. There seems to be a decent rough correlation between fuel economy changes and economic growth:
The recent poor fuel economy growth fits into this pattern. I assume that what is happening is that as the economy slows, people buy fewer cars, and thus are less prone to replace older less efficient vehicles with newer more efficient ones. This is probably particularly true of lower income consumers who are particularly likely to be driving older vehicles (and now struggling to pay their subprime mortgages). This hypothesis should be confirmed more deeply (and I welcome any data or studies anyone is aware of which bear on this point). But for now, let's just keep going, noting the strong possibility that this correlation may continue to hold in the future.
I have not blogged extensively on the US housing bubble and crash. This is not because I haven't considered it very important and followed it closely, but rather because Calculated Risk does such a stellar job. He makes most of the graphs I would tend to make, and I think has generally excellent judgement in interpreting them. Thus up till now I've been largely content to read that blog every day and feel like I know what's going on. To summarize a few salient stats now though, here's new housing starts and completions.
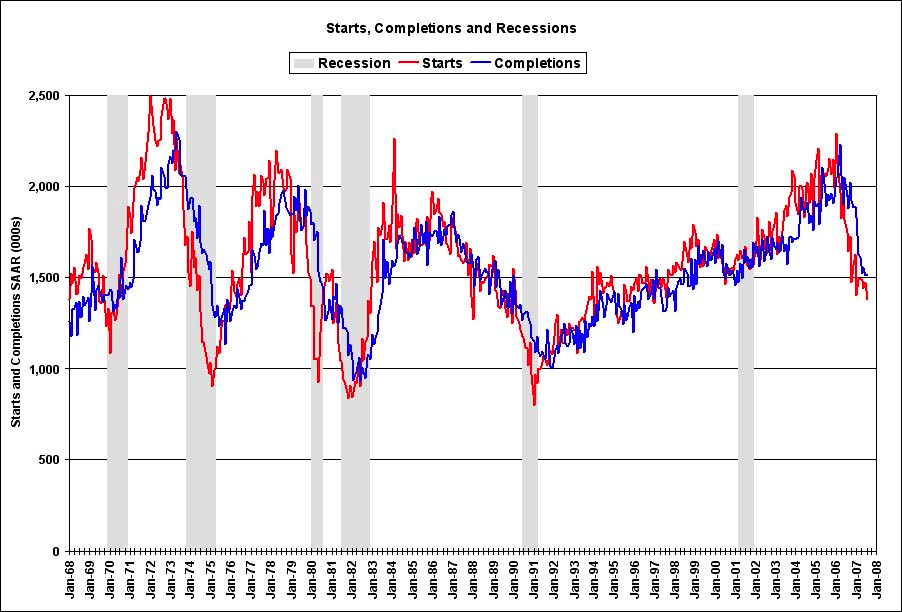
As you can see, new housing starts are a decent leading indicator of recessions, and peaked about the beginning of 2006 and have been falling sharply since. I take this as further evidence for the "recession around the end of 2007" hypothesis.
Prices of existing homes reached a maximum rate of acceleration in mid-to-late 2004 - at a staggering 15-20% in major metro areas - and then began to decelerate sharply:
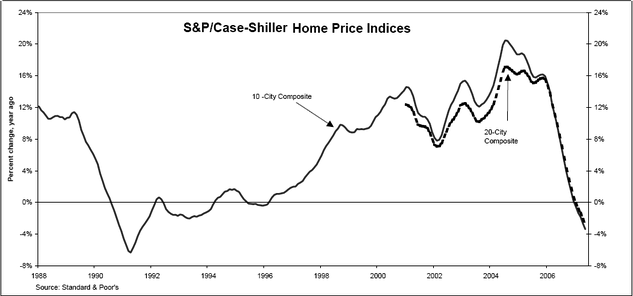
Prices are now falling in this index (which I prefer to median home price indices as it is constructed based on comparing sales of the same house over time, and thus it not subject to problems of the sample changing significantly between up and down markets). For more on the housing bubble, I recommend this nice summary.
The major driver of the extremely high rate of acceleration in house prices was a combination of very low interest rates (engendered by the Federal Reserve attempting to mitigate the effects of the 2000-2002 tech crash) and a near complete collapse in lending standards in recent years, allowing all manner of exotic and imprudent mortgages to be passed off on people who could ill afford them. This has all come to a grinding halt in recent months, and now appears to be giving rise to a massive credit crunch. I refer you to Stoneleigh's excellent primer and Jerome's comments for more details.
So the question of the hour is: how bad is this credit crunch going to be?
I don't claim to have a methodology that I believe in to answer that question. Obviously, the mainstream economic consensus is that there is nothing to worry about. However, the mainstream economic consensus has been retreating one step at a time, which is not confidence-inspiring. As part of my research for this post, I read a sample of the Federal Open Market Committee minutes for the last few years, and it's somewhat like being in a parallel universe. Clearly, it's related to my universe, in that energy prices, housing activity, etc, are discussed. However, the discussion always seems to be about what happened in the last quarter, and projections about the future invariably assume that whatever is wrong now will moderate or not get much worse. Since the trend of events in the housing market has been to get steadily worse, this gives an impression of unreality: the committee invariably seems to fail to anticipate major negative developments. A sample from the March 2007 meeting will give you the idea. This is just after major disruptions in the subprime mortgage sector in February.
Participants reported signs of stabilization in housing demand in most regions of the country. At the national level, sales of new and existing homes, while fluctuating in recent months, did not display declining trends. The inventory of new homes for sale reportedly had fallen further from its recently elevated level. Participants noted, however, that such inventories likely would need to be worked down appreciably more before growth in housing construction would resume. The increase in delinquencies on subprime adjustable-rate mortgage loans and the ensuing increase in interest rates and tightening of credit standards in the subprime mortgage market likely would constrain home purchases by some borrowers, perhaps retarding the recovery in the housing sector. However, there was no sign of spillovers from the subprime market to the overall mortgage market; indeed, interest rates on prime mortgage loans had declined somewhat in recent weeks, along with yields on U.S. Treasury securities. Moreover, home-buying attitudes had improved and continuing job growth could be expected to support home sales.There's not the slightest hint of concern here that within a few months the Federal Reserve would need to be engaged in massive injections of liquidity to stabilize the financial system during a panic.
For another, now famous example, consider this April 2005 statement from then Chairman Greenspan:
“With these advances in technology, lenders have taken advantage of credit-scoring models and other techniques for efficiently extending credit to a broader spectrum of consumers. The widespread adoption of these models has reduced the costs of evaluating the creditworthiness of borrowers, and in competitive markets, cost reductions tend to be passed through to borrowers. Where once more-marginal applicants would simply have been denied credit, lenders are now able to quite efficiently judge the risk posed by individual applicants and to price that risk appropriately. These improvements have led to rapid growth in subprime mortgage lending; indeed, today subprime mortgages account for roughly 10 percent of the number of all mortgages outstanding, up from just 1 or 2 percent in the early 1990s.Oops.
The FOMC comes across to me in their minutes as completely complacent as to the risks of speculative bubbles and the fact that unrestrained credit-creation has caused house prices to get seriously out of sync with incomes. No meeting minutes I read showed any deep discussion about the systemic risks of the kind of risk transference engaged in due to the creation of asset backed securities and CDOs. A search found no mention whatsoever of "peak oil" in any minutes of any Federal Reserve body, or any staff report, though there is regular discussion of "energy prices", treated as an essentially mysterious exogenous factor.
In general, there's an excessive reliance on the assumption that whatever markets are currently doing must be fairly optimal, and a failure to recognize (or at least discuss) that market systems, being collections of fairly imperfect human beings acting under uncertainty, are subject to certain well known pathologies and occasionally get into speculative spirals that can end in very abrupt dislocations. There's no mention of a "housing bubble" in any recent minutes or statements: one has to go back to 2003 to find Alan Greenspan downplaying the idea:
The very large flows of mortgage funds over the past two years have been described by some analysts as possibly symptomatic of an emerging housing bubble, not unlike the stock market bubble whose bursting wreaked considerable distress in recent years. Existing home prices (as measured by the repeat-sales index) rose by 7 percent during 2002, and by a third during the past four years. Such a pace cannot reasonably be expected to be maintained. And recently, price increases have clearly slowed.My confidence is thus low that the FOMC has an adequate understanding of what it is up against, or that its reassurances can be relied on. It will do its best, but it is fundamentally complacent and reactive in its outlook and can be relied on to fail to anticipate new developments, especially negative ones, ahead of time. I'm willing to revise this conclusion with more data - in particular, Fed Reserve chairman Ben Bernanke has left a large trail of very influential academic papers that I'm now digging into, and hope to report further on.It is, of course, possible for home prices to fall as they did in a couple of quarters in 1990. But any analogy to stock market pricing behavior and bubbles is a rather large stretch. First, to sell a home, one almost invariably must move out and in the process confront substantial transaction costs in the form of brokerage fees and taxes. These transaction costs greatly discourage the type of buying and selling frenzy that often characterizes bubbles in financial markets. Second, there is no national housing market in the United States. Local conditions dominate, even though mortgage interest rates are similar throughout the country. Home prices in Portland, Maine, do not arbitrage those in Portland, Oregon. Thus, any bubbles that might emerge would tend to be local, not national, in scope.
Third, there is little indication of a supply overhang in newly constructed homes. The level of overall new home construction, including manufactured homes, appears to be well supported by steady household formation and not dependent on high and variable replacement needs or second-home demand. Census Bureau data suggest that one-third to one-half of new household formations in recent years result directly from immigration.
On the other side, one has a variety of fans of Austrian economics and the gold standard who tend to the view that the expansion of credit due to recent Fed easing has fueled the debt boom and make a contraction now inevitable. On the whole, they appear somewhat more in touch with reality than the FOMC. I read Mike Shedlock pretty regularly as the most quantitative and rational exponent of this viewpoint that I've come across in the blogosphere. He has been predicting a financial meltdown due to the credit bubble for some time, but I've still yet to see something that gave me a solid belief that we can estimate how bad this credit crunch could get.
Let me set aside that concern, and just lay out what has spooked me over the last couple of weeks, which is the whiff of financial panic. The events that caused the Fed and the European Central Bank (the ECB) to have to inject such massive amounts of liquidity into markets to maintain target interest rates were described by Paul Krugman in his Op-Ed Very Scary Things as follows:
Everyone knows now about the explosion in subprime loans, which allowed people without the usual financial qualifications to buy houses, and the eagerness with which investors bought securities backed by these loans. But investors also snapped up high-yield corporate debt, a k a junk bonds, driving the spread between junk bond yields and U.S. Treasuries down to record lows.Clearly, we have a situation in which financial system players have started to lose confidence in each other. The public has not lost confidence in financial institutions, but they are losing confidence in each other. They are probably better informed than we are, suggesting that as the chain of bad debt and overpriced assets continues to unwind, we could see more institutional failures, and more public loss of confidence in the financial system.Then reality hit — not all at once, but in a series of blows. First, the housing bubble popped. Then subprime melted down. Then there was a surge in investor nervousness about junk bonds: two months ago the yield on corporate bonds rated B was only 2.45 percent higher than that on government bonds; now the spread is well over 4 percent.
Investors were rattled recently when the subprime meltdown caused the collapse of two hedge funds operated by Bear Stearns, the investment bank. Since then, markets have been manic-depressive, with triple-digit gains or losses in the Dow Jones industrial average — the rule rather than the exception for the past two weeks.
But yesterday’s announcement by BNP Paribas, a large French bank, that it was suspending the operations of three of its own funds was, if anything, the most ominous news yet. The suspension was necessary, the bank said, because of “the complete evaporation of liquidity in certain market segments” — that is, there are no buyers.
When liquidity dries up, as I said, it can produce a chain reaction of defaults. Financial institution A can’t sell its mortgage-backed securities, so it can’t raise enough cash to make the payment it owes to institution B, which then doesn’t have the cash to pay institution C — and those who do have cash sit on it, because they don’t trust anyone else to repay a loan, which makes things even worse.
And here’s the truly scary thing about liquidity crises: it’s very hard for policy makers to do anything about them.
The Fed normally responds to economic problems by cutting interest rates — and as of yesterday morning the futures markets put the probability of a rate cut by the Fed before the end of next month at almost 100 percent. It can also lend money to banks that are short of cash: yesterday the European Central Bank, the Fed’s trans-Atlantic counterpart, lent banks $130 billion, saying that it would provide unlimited cash if necessary, and the Fed pumped in $24 billion.
But when liquidity dries up, the normal tools of policy lose much of their effectiveness. Reducing the cost of money doesn’t do much for borrowers if nobody is willing to make loans. Ensuring that banks have plenty of cash doesn’t do much if the cash stays in the banks’ vaults.
The last financial panic of major significance in the US was was the Great Depression, which was essentially the result of a large debt fueled bubble that crashed in 1929. This led to a series of bank failures and panics and large-scale public loss of confidence in the financial system. That in turn led to a major contraction in the amount of money in circulation (since so many banks disappeared), and a drop in the velocity of money as people and institutions tried to improve their balance sheets and hold more cash. This didn't happen all at once, but as a rolling collapse over a period of four years. The Fed did more or less what you would expect (drop interest rates fairly rapidly beginning in 1929), which didn't really work. Then they were obliged to raise them again to counteract a run on Federal gold reserves by foreign governments, which greatly exacerbated the domestic difficulties. Prices dropped dramatically, as did real output. The data are chilling:
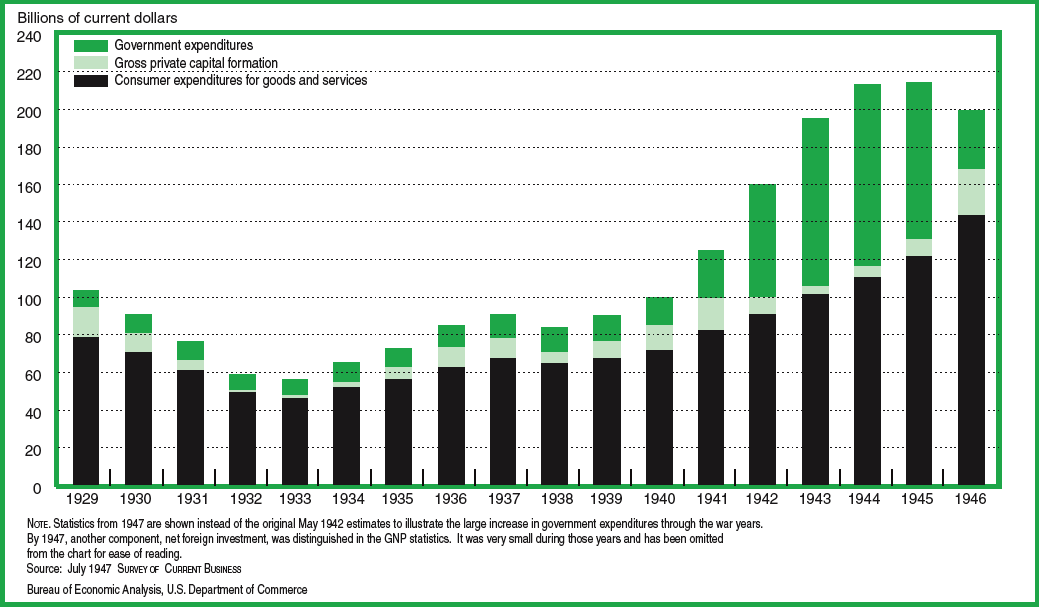
Now, this is probably a worst case for what we might face in the next few years, and there are some reasons to think things will be much milder. But let's just explore it as a worst case. There are two points I want to draw from it. One is obviously to note the sharp contraction in GNP generally from 1929 to 1933. It almost halved in nominal terms, and even in real terms, it dropped by a third. A contraction in GDP of that order of magnitude today would likely produce a very dramatic drop in oil usage (recall the correlation between GDP and VMT growth), which would without doubt collapse energy prices to pre-peak levels for a number of years. In the great depression, the unemployment rate rose from 3% to over 20%. With no income, and likely very restricted ability to borrow, that's a lot of people who wouldn't be doing too much driving.
Furthermore, consider the "Gross Private Capital Formation" element of GNP. That is private investment, and it dropped to almost nothing in 1932 or 1933. Now private investment today includes things like research and development in alternative technologies, venture capital funding of clean-tech startups, installation of wind power or solar power sites, laying down of new railroads, new nuclear power plants, coal-to-liquids plants, development of new oilfields, etc. Recall also the correlation I pointed out between fuel economy changes and economic growth - in a depression, it's a safe bet that average fuel economy of the fleet would simply degrade as few people bought cars and the existing fleet got older and less efficient. In short, whatever your preferred method of mitigating or adapting to peak oil, you can pretty much kiss it goodbye during a major meltdown of the financial system.
This, of course, will not make peak oil go away. Credit crunches and even depressions, as extremely painful as they may be, are inherently temporary. After a suitable time, the offending debt somehow gets written off and offending assets are repriced and the economy resumes growing. However, when this one passes, peak oil will still be there waiting for us. And whatever time we lose in investing in all the things we need to do is an opportunity lost forever.
So, I would really like to get a better handle on how bad this credit crunch is likely to get before it's done.
Contact
- Content: editors at theoildrum dot com
- Tech support: support at theoildrum dot com
License

This work is licensed under a Creative Commons Attribution-Share Alike 3.0 United States License.
As usual, I think that the net export situation is the key factor. Expanding net exports + cheap money resulted in the final real estate boom that we are likely ever to see. I don't think that it is a coincidence that the US Personal Saving Rate has declined as oil prices increased (and as net export declined), since 2005.
Peak Exports suggests, in my opinion, that most US debts will never be paid back to the creditors, or the debts will be repaid with hyperinflated currency, take your pick.
If we assume that the top five net exporters (about half of world net exports in 2006) continue to show about a 5% rate of increase in consumption and if we assume a 5% rate of decline in production, their combined net exports will be down by about 75% within 10 years.
Basically, I think that the decline in net exports will outpace the decline in consumption because of a contracting economy.
I think that the American consumer is facing inflationary food and energy prices and the deflationary effects from increased job competition and because of the real estate slump/crash. All I can say is that I repeatedly tried to warn anyone who would listen of what was coming.
Hubbert linearization, which you are genererally a big believer in, says the top level decline rate would be barely different from zero over the next ten years. It wouldn't project a 5% decline until after 2040. So your model is considerably overstating the situation.
HL is just part A of the calculation.
Net exports are production - domestic demand.
Domestic economies of oil exporters should be expected to boom in a high oil price environment (especially major exporters although Norway just saves their earnings). Also oil exporters typically shield their domestic market from price signals (Norway has the highest gas taxes in the world).
Combined, the impact is strong domestic demand growth, despite weak of negative growth in production.
In 2006, Russia had decent production growth but minimal export growth due to strong internal demand.
I would strongly suggest that Putin cares more for Moscow taxi drivers than he does US SUV drivers. Likewise, Saudi is more concerned about filling the tanks of their many new teenage drivers than filling the tanks of our teenage drivers.
Gas rationing in Iran is an interesting contra example. The statements today by the former oil minister should give a clue as to the internal reasoning.
How many nations look that far ahead and take disciplined steps to do something about it (and gas in Iran is still about 35 cents/gallon) ?
I would not be surprised to see Russian production increase in 2007 and exports fall.
The transition of the UK from exporter to importer was speeded by the Export Land Model. By my "back of the envelope" calcs, they would still be an oil exporter by a 250,000 b/day if they used as much oil as they did in 1996.
Reduced North Sea production has had no apparent effect on domestic consumption growth in Great Britain.
Alan
"HL is just part A of the calculation".
My point is that Jeffrey isn't getting that 5% in production decline from Hubbert Linearization. I don't know where he's getting it - as far as I know, there's no evidence for it. And even if one completely bought the rest of the model (which I don't), that 5% near-term production decline arbitrarily doubles the size of the problem.
As noted down below, I am talking about the decline rate by the top net exporters, not the world.
Based on crude oil production data through 5/07, and if we assume flat production for the rest of 2007, the year over year decline in Saudi crude oil production would be 5.9%, for Norway, 4.8%, versus 5% plus recent increases in consumption (EIA data).
When Russia starts declining, which may be happening now, I suspect that the production decline rate may be in the vicinity of 10% per year.
Stewart, download Rembrandt's latest Oilwatch monthly here and look at chart #11. That has the dramatic decline of net exports Jeffrey's talking about
jim
Jim, your link does not work.
How about this?
(the html style manual has changed recently, and I'm sort of a technopeasant...)
My understanding is the 5% decline is in next exports not production. And this is from his export land model.
I assume a post of it applied to world is forthcoming from WT so we can discuss it in depth later.
Next:
I find it interesting you did not discuss how this monetary environment would effect investment in oil production and exploration and in general the oil and energy industries. I'd say we can expect investments in major projects to decrease significantly. My main concern has become a sort of extension of the export land model where it becomes increasingly profitable to produce less and less oil for two reasons.
1.) Expensive oil makes it expensive to extract.
2.) Monetary problems makes it difficult to invest large amounts of money in projects with a long term payout and a requirement for high prices to be profitable. The reason the price, has to be high goto 1.
3.) Export Land effect where high prices increases internal consumption and money spent on expanding capacity is "lost" to the subsidized internal market thus discouraging extensive investment by the national oil companies.
So the coupling of high oil prices and a weakening economy seems to set off a sort of downward spiral that cannot be easily solved. In my opinion declines in production will steepen significantly as the economy worsens and national oil companies will respond by continued cuts in exports both intentional and as a result of production declines, lower investment levels, and increased internal consumption forcing the oil price to remain high and setting us on this downward path even as the economy weakens.
Overall you seem to get into a paradoxical situation that as oil becomes more expensive less is produced.
Memmel
big oil companies don't borrow for exploration, they are mostly awash in cash. They will sometimes borrow for a fixed asset with a fixed life, like a production platform or to finance a takeover
And, not all oil will be expensive to extract. But the oil coming onstream will be a magnitude more expensive, and also rusting infrastructure on stripper fields.
Bob Ebersole
First your talking trillions to say develop the arctic so I don't think they are awash in cash considering the costs they would need to incur to keep production up. Not even close. Next I think they will have to continue to do serious stock by backs as they report lower and lower reserves. The market has not been kind to oil companies with large hord's of cash and shrinking reserves. The simplest way to solve this problem is to buy other oil companies. Next one would expect profit margins on the refining side to fall soon and even go negative as oil gets expensive. Politically their is a limit to how much refining profit a company can make.
Probably the best example of how I think this will play out is Iran.
Next most of the oil reserves left are in the ME or other regions under the control of National oil companies these are actually the ones I'm more concerned about since these are the onces that will be cash constrained.
And all this expenditure billions and even trillions of dollars if it happened and happened in time would be to keep oil prices low. I think that just like any other technical solutions offered ethanol etc the chances of the oil industry investing trillions to keep oil prices low are slim now. Especially for the National companies.
As far as I can tell to keep production close to what it is now over the next few years if all the giants are in decline is going to take a mind numbing amount of cash with a lot of it borrowed I just don't see this happening. And a lot of these projects need 60+ a barrel to be profitable.
And consider a few hurricanes through the Gulf...
In any case I don't consider the current cash reserves of the majors to be that important.
Oh and about borrowing.
Oil companies are not immune.
http://www.time.com/time/magazine/article/0,9171,917303,00.html
Memmel
of course oil companies aren't immune. Chevron bought Texaco about 5 years ago, who is trying to sell their bonds? I think old bonds like that would be as gilt-edged as they get.
But you're getting awfully far ahead of the curve on Artic Ocean exploration. The countries surrounding the ocean own claims out to 200 miles offshore, and are just now trying to figure out who owns the rest. I don't care if there are 10 Ghawars out there, the production problems out there are likely to be as big as sending a rocket to Titan to send back methane, and just as likely to make money. Maybe our greatgrandchildren will have some oil after all.
Bob Ebersole
Mike, you're also right that the only way they can grow their reserves is buy other companies, especially since they had a thirty year period where the big guys didn't explore in the US. They can also dump an almost infinite amount in tar sands and oil shale. But I suspect in another 10 years they will be like tobacco companies, their only worth being what the dividends are on the stock and with about as much social catchet. The big boys are being set up to take all the social blame for the energy problems, just like the Mexicans are being set up to take the blame for our employment problems. Bob Ebersole
Your making it hard for me to argue with you hmmph :)
I'd like to add that how the National Oil companies react is going to be a big factor. It makes sense that in the presence of economic uncertainties in importing countries and with a lot of oil investment eaten up by internal demand and with prices increasing fairly fast as production drops they will not be very aggressive about increasing production over the next few years.
I'm very concerned in general about how global peak will effect the oil companies and so far its not looking good.
There's probably quite a few small companies that will do very well mopping up the smaller nuggets of remaining oil -thats been discussed here before. Also, any company offering 'magic bullit' recovery methods with also do very well out of a strong desire to increase output.
Nick.
Hi memmel,
To help me clarify what you and Bob are talking about here:
Is there a big difference between "the majors" and the NOCs in the available capital for new projects normally?
And what are the implications of this? So, are you saying that the NOCs don't have as much - or (well, where does the money go? KSA for eg.) - or that they, for eg. KSA will be pressured to keep the revenue flowing? - (towards whomever they are supporting w. the profits now)?
And how does the degree of cooperation among NOCs - (is there any?)- affect the picture? and/or between NOCs and "majors" for that matter?
Thanks, Stuart (belated as it is),
Memmel, ok so...
re: "2.) Monetary problems makes it difficult to invest large amounts of money in projects with a long term payout and a requirement for high prices to be profitable. The reason the price, has to be high goto 1."
1) Would a consistent price rise as opposed to volatility fix this problem?
2) Remember back when you were talking about the normal oil market ceasing to function much after "peak"? (I believe w. the rules already in place for a (de facto was it?) rationing system - question mark?) Anyway...how does the idea about the market no longer being relevent (once decline has "set in") relate to the dynamic you are talking about here? Do the determinants of price change in some fundamental way under such a scenario?
as a person who worked in SA for several years as an engineer I tend to agree with this post. Saudi production is probably as much investment driven as demand driven. This was a problem they had in the 70's. They have little use for dollars which are depreciating and inflation is rampid. Why drop $100bn into an oilfield that's just going to give you $ 150bn in overpriced treasury bonds.
One thing that hurts our markets is that a nano percent of the population understands them. A telephone company with declining sales, declining eps, a 4% dividend paid with borrowed money, an accounting system that classifies a guy who goes from a wire to digital cable a "new customer" and a PE of 27 is not an investment. It's a Ponzi scheme.
Ponzi schemes are always the result of easy money, where all good investments are too expensive. Today, people avoid bonds because they can't afford to own them. Not a good sign.
Peak oil can be traced almost to the month to Fed rate decreases. Supply and demand have been extremely consistent.
Stuart,
As you may recall, the reason that I (accurately in turned out) warned of a net export decline in January, 2006 was because the top exporters (based on HL), especially Saudi Arabia, Russia and Norway, were much more depleted than the world is overall, plus an expectation of a rapid increase in domestic consumption.
For the top three net exporters in 2005, the year over year changes in production, consumption and net exports from 2005 to 2006 are as follows (EIA, Total Liquids):
Saudi Arabia: -3.7% (Prod.); + 5.7% (Cons.); -5.5% (Net Exports)
Russia: +1.6%; +5.6%; -0.2%
Norway: -6.6%; +6.0%; -7.8%
From the point of view of importing countries, global oil production is pretty much irrelevant.
Ah, so when Hubbert Linearization suggests a pessimistic answer (exporters are deeply depleted) you believe it, but when it suggests a more optimistic answer (global declines will be slow), you throw that out. (FWIW I think HL applied to Saudi Arabia is not likely to be very reliable).
I don't believe I ever said that. For the record, I expect the global production decline to probably be low, in the vicinity of 2% per year, and I just made that point in a NPR radio interview this morning with Jason Bradford.
I just think that the global decline rate is utterly irrelevant from the point of view of importing countries. If the US were the sole source of crude oil in the world, net exports would have ceased more than 20 years before world production peaked.
In regard to the Saudi HL plot, two points: (1) The most accurate pre-peak Texas URR estimate came from discounting the "dogleg up" and (2) Saudi Arabia showed, discounting the recent dogleg up, a very stable HL plot, which suggests that Saudi Arabia is somewhere between 60% and 70% depleted.
My bet is on a fast crash in world net oil exports.
BTW, the Texas versus overall Lower 48 model is interesting. The long term Lower 48 decline rate has been about 2% per year, versus the long term decline rate of about 4% per year for Texas. So, the non-Texas Lower 48 decline rate was probably in the vicinity of 1.5% or so. At peak production, Texas accounted for roughly one-third of Lower 48 crude oil production. The Texas decline rate was sharper because it peaked at a later stage of depletion than the overall Lower 48.
Today, the top five net oil exporters account for about one-third of total world liquids production. So, in terms of percentage of production and stage of depletion, one could argue that the top five net exporters are more or less to the world as Texas was to Saudi Arabia.
This brings me back full circle to why I basically, in January, 2006, considered a net export decline to be virtually a mathematical certainty--the top net exporters are more depleted than the world is overall, and then we plug in the rapid rate of increase in domestic consumption.
"...........a mathematical certainty--the top net exporters are more depleted than the world is overall, and......."
This makes a great deal of sense on several levels. Not reassuring mind you, but it has the smell of truth. Reminds me of some National Geographic episodes. Specifically those having to do with sharks and lions feeding habits. Devour what is readily available first, then move on to the more difficult prey.
Rembrandt showed all liquids down -5% in the last Oilwatch Monthly.
http://europe.theoildrum.com/node/2864
If we look back to 2005 to 2006 exports drop -3.5%. If we assume the Saudi drop was voluntary, exports would have still dropped 2%. I "guessed" at HL levels using some charts from Graphoilogy. What it looks like is happening is that many exporters are just entering the rapid decline phase of HL (Mexico, Norway, Saudi Arabia) we should see accelerating changes in these countries. PEMEX is projecting another 300kb drop this year. That is nearly 1% of exports alone.
change
Data from:
http://www.eia.doe.gov/emeu/cabs/topworldtables1_2.htm
HL Estimates taken from:
http://graphoilogy.blogspot.com/2006/09/hubbert-parabola.html
Jon Freise
Analyze Not Fantasize -D. Meadows
As noted above, I agree with Stuart that the most likely scenario for the world decline is a fairly low decline rate. The problem, in my opinion, is that most of this decline will occur in the top exporting countries, and then we plug in the rapid increase in consumption in exporting countries.
In any case, consider the simple fact that the three remaining fields that are still producing one mbpd or more of crude oil are all in top 10 exporting countries and all three of the fields are almost certainly in long term decline.
In my opinion, the rapidly developing Net Export Crisis is the most important issue of our time, and most of the world seems to be oblivious to it.
Following is the concluding portion of my January, 2006 post, and I have shown an excerpt from Stuart's post above--to the effect that the decline in world oil production was largely accounted for by the production decline in the world's largest net oil exporter.
http://www.theoildrum.com/story/2006/1/27/14471/5832
Hubbert Linearization Analysis of the Top Three Net Oil Exporters
Posted by Prof. Goose on January 27, 2006 - 1:47pm
This is a guest post by westexas
Stuart's comments from up top:
Edit:
Regarding the current top 10 net exporters, their rate of increase in consumption from 2000 to 2005 was 3.2% per year. From 2005 to 2006, their rate of increase was 4.6%. If Mexico had maintained its 2004 to 2005 rate of increase in consumption, the top 10 increase from 2005 to 2006 would have been 5.7%. In any case, this overall increase tracks the oil price increase (Brent, EIA). From 2000 to 2005, Brent increased at 12.7% per year. From 2005 to 2006, Brent increased 17.7%.
Top 10 consumption, in one year (from 2005 to 2006), increased by 500,000 bpd (Total Liquids). If Mexico had maintained its rate of increase, the top 10 increase would have been 664,000 bpd.
Mexico is an interesting export case history. Their initial decline in net exports, from 2004 to 2005, was 9.7%. My Export Land Model (ELM) suggests that the net export decline rate should accelerate with time.
If Mexico's consumption from 2005 to 2006 had increased at the same rate that it increased from 2004 to 2005, their net export decline rate from 2005 to 2006 would have been 10.2%, as predicted by the ELM.
However, their consumption fell from 2005 to 2006--presumably because of the falloff in cash transfers back home from Mexican workers in the US (probably because of the decline in housing construction)--and their net export decline was only 1.7% from 2005 to 2006.
Note that Mexico was the only top 10 net exporter in 2006 to show a decline in consumption.
Stuart did not say that he expects a low decline rate. He said that HL suggests a low decline rate. I've seen Stuart in the past mention decline rates from near 0% to as high as 11% in order to examine different cases but I am not sure that I recall Stuart ever "endorsing" a particular decline rate as the most likely one. I do recall Stuart doing some work on what the maximum decline rate would be that the western world could likely adapt to without serious impact. I think he mentioned something like 7% or 8% as an upper bound? (I can't recall for sure as he's written very much here over the last 2.5 years, almost all of it very educational.)
Jeffrey, I know that you favor the HL method for predicting URR but I must remind you that Hubbert himself never ever did any such thing. Deffeyes did this and while Professor Deffeyes is a very intelligent man, I do not think he is of the same caliber as Dr. Hubbert. Specifically, if you read Hubbert's own 1956 paper, all of it, you see that he began with a priori URR estimates. Given these upper and lower bound estimates, he was able to then develop his math to fit his curves into those upper and lower bounds. Once this was done, the forecast for peak date was easily derived. Professor Deffeyes math does not predict a single URR with special accuracy. It assumes that IF a field is produced at maximum production then the URR can be bracketed by the subsequent URR estimates from that math. However, if the field is produced in another manner (as KSA has been), then the line derived from HL becomes fraught with potentially bad assumptions.
Further, note that Hubbert's upper bound forecast ended up being too conservative as we're over 200 GB and still climbing though the end appears to be in sight. Hubbert's going to end up being about 10%-15% too pessimistic even in his most optimistic case. What is interesting there is that this was for the US, which operated under very different conditions than the rest of the world. Inflation of oil figures such as we have seen in the Middle East could not occur in the US and instead we probably had understatement due to SEC rules necessitating that the oil companies be conservative. Note that in forcing this conservative view that the US ends up being in that 10%-15% too pessimistic category.
But then consider the Middle East, where reserves appear to be overstated by 40%-50% in many cases. Clearly the reserves numbers from the Middle East cannot be taken to be as reliable as the US reserve numbers. The force of the SEC's monitoring (not the free market) caused our reserve estimates to dovetail pretty closely to reality. Since no such force is causing the NOC's to moderate their wildly speculative reserve statements in the Middle East, the question becomes exactly how much are they overstated?
And this question is important. The answer to that question, since the Middle East holds a disproportionate amount of the world's oil, will be one of the key drivers of decline.
In my opinion, no one here at TOD has realistically looked at the Middle East as a whole and assessed what the decline rate is going to look like if the 1980s reserve inflations were as badly overstated as they appear. Stuart has hinted at it. Dave Cohen has hinted at it. But no one here seems to want to tackle that very urgent question. And it is indeed urgent. It we are at or within a few years of peak production, the decline rate is very dependent on many unanswered questions. Here's another one that I have never seen discussed by peak oilers - what proof do you have that the production curve for the world must be roughly symmetrical in nature? In other words, people are assuming that the production curve looks like the black curve below but what if it is really like the red curve? Which of you can prove that the red curve is false, especially in light of the wildly inflated reserve numbers from the Middle East, the ever receding "big" fields of Kazakhstan, the overstated "finds" of Jack 2 and China's offshore, both of which have been subsequently amended downwards, etc.?
If I plug the pre-NOC reserve estimates for Middle Eastern nations into a spreadsheet then apply identical reserve growth numbers to those estimates as occurred in the US, the situation is not very pretty.
In short, I think that the HL technique is an interesting additional tool for helping to confirm peak but it does not predict it as Hubbert's methods did. And given that, plus the massive change in global production pattern precipitated by the 1970s oil shock and the subsequent voracious growth, I am not at all sure that the red curve above is wrong. And further, I do endorse your notion of "exportland" because we are seeing it play out in fact right around us. I just question your URR estimates (and those of just about everyone else on this site) because of the wildly inflated numbers from the Middle Eastern NOCs.
By the way, Jeffrey, this is not intended as a personal attack on you or anyone else here. I am simply expressing my reasons for disagreement and my concerns which appear to have never been adequately answered about global production versus actual (versus inflated) reserves. I greatly respect the messages you have been trying to convey because I believe you are spot on about exports and the severity of the crisis facing western civilization (and by extension, the entire world).
P.S. I am going to remind everyone here that in early to mid 2005 we were being assured that by late 2007 we would see huge growth in production because the the mega-projects. This has not occurred and instead global production is down! How many of you that were predicting a 2010 or later peak have amended your forecasts based upon the changes of the last two years? Or are you religiously clinging to an outdated belief because you think your ego is attached to it? Do you believe that the 2008 and 2009 mega-projects will bring us all of what we were supposed to get in 2006 and 2007 plus what was projected for 2008 and 2009?
"The greatest shortcoming of the human race is our inability to understand the exponential function." -- Dr. Albert Bartlett
Into the Grey Zone
I think the red curve is most probable, since secondary and tertiary recovery are happening in conjunction with primary production. (no stripper wells in the North Sea!)
As for 2007 vs. 2010, I found it interesting that after Skrebowski came out with the megaprojects, ASPO changed from 2007 to 2010.
Personally, I thought Dr. Campbell just decided to be conservative, so that he could rest on his laurels, and after all the shit he's be taking for a full decade, he could in the end say "see, I was actually conservative!"
But the megaprojects projected that deep sea would more than counterbalance the declines on land, and that obviously hasn't happened.
Which leads to a question I periodically put out: is anyone monitoring deep sea specifically? It would appear not to easily be lumped in with the standard country by country, region by region tallies.
We're past peak.
In my opinion, yes, we appear to be post-peak. But my question was not about date but the shape of the curve. The area under the curve must represent the total of all oil. The shape of the curve can obviously be changed. Has it changed as I've asked? If it has then the post-peak decline must be severe because the remaining oil is less than many think. If it has not shifted in that manner then the decline may be more manageable. That is the basis of my question - what data do we have that suggests that the production curve is going to be roughly symmetrical?
"The greatest shortcoming of the human race is our inability to understand the exponential function." -- Dr. Albert Bartlett
Into the Grey Zone
If I recall WHT's analyis correctly, convolving a number of curves of widely varying shapes still leads to something resembling the derivative of the logistic curve. Then there are advances like THAI for recovery and upgrading of bitumen; we might still have a steep dropoff, but there are good reasons to believe that we won't.
How this turns out depends partly on geology and technology, but also on what we believe will happen. If we continue with BAU (either because we have been sold a bill of goods by the oil interests, or because we fatalistically believe that nothing we do can avoid an imminent crash) then we will be caught in a crunch. If we push hard to raise efficiency and substitute electricity for oil with PHEV's, EV's and rail, the end of the consumption curve gets stretched out due to lower demand.
what data do we have that suggests that the production curve is going to be roughly symmetrical ?
The Central Limit Theorem.
Take "worst case, a set of varying right angle triangles" (production ramps up to a maximum and then goes immediately to zero) of varying heights, lengths (years of production) and start dates. Add them together and the result approaches symmetry.
Best Hopes for no secular & universal influences on oil production,
Alan
That's a theory. Now what data do we have to support the theory? Yibal certainly throws a curve into that line of thinking. The North Sea doesn't help either. Worse, 60% of global oil production is dominated by 1% of the total oil fields. What happens if we don't have a uniform distribution of triangles but instead are heavily weighted to a small number that dominate the total surface area? You can point to the US but the US was developed before or as these technologies were deployed, unlike the North Sea or Yibal which were developed fully using these technologies and which drastically altered their shape.
There are a host of questions here which are not intuitively obvious (to me at least) precisely because we do appear to have secular and universal influences (the rise and application of new enhanced oil technology for extraction).
My initial assumption was to accept the idea of rough symmetry as you outline, Alan, but two things - the dominance of global production by such a small number of fields and the application of enhanced oil extraction techniques - have caused me to question that assumption. And from what I see of the giant fields that have entered decline - Cantarell, North Sea, Yibal, etc. - the number of small fields needed to offset the steep declines in these fields is not something we can ever hope to attain.
"The greatest shortcoming of the human race is our inability to understand the exponential function." -- Dr. Albert Bartlett
Into the Grey Zone
The Central Limit Theorem applies to independent variables all sampled from the same distribution. This would apply if you were sampling with replacement colored balls from a closed bag, placing the sampled balls back into the bag after each sample.
The variables that we have are all dependent in that energy production today affects energy production tomorrow. Saudi Arabia took 5% of the world's oil offline in the early 70s and economic production everywhere suffered due to ripple effects. This is like the distribution of the sample affecting the distribution of the population with each sampling.
The variables that we have are also not from the same distribution, because as we produce (harvest) energy, we change the environment with every sampling. There are roughly 80 million barrels of oil less in the ground than yesterday. There are X mbpd offline because of weather, accidents, and unrest. Minor technological changes since yesterday affect recovery, exploration, and flow rate. These all affect our ability to produce (harvest) more energy today. This is like sampling, not replacing the balls you took out with each sample, and replacing them instead with an unknown number of balls from an unknown population.
And what we have is a combination of both these scenarios.
The Central Limit Theorem does not prove symmetry in the production curve because it does not apply here.
The problem we face is systemically nonlinear, dynamic, chaotic.
The Central Limit Theorem doesn't require the variables to have the same distribution. It only requires them to be numerous and independent.
RobertInSantaBarbara
I haven`t escaped from reality. I have a daypass.
Incorrect. The sample must come from the same population, therefore the variables have the same distribution. Please do your homework.
Your daypass has been revoked.
Your illustration omits a third possibility - a curve skewed in the opposite direction to your red plot, with a long tail to the right. Is this scenario not also a possibility? Why or why not?
Correction to above post: ". . . one could argue that the top five net exporters are more or less to the world as Texas was to the Lower 48.
westexas,
"I just think that the global decline rate is utterly irrelevant from the point of view of importing countries."
Well.. it is relevant; it is has been the signal for: Go Get it before anybody else does! Start the wars in the middel east!
Roger from the Netherlands
"It wouldn't project a 5% decline until after 2040."
Stuart,
Forgive me, but the graph you linked has different values from your world HL analysis in your story "Hubbert Theory Says Peak is Slow Squeeze".
http://www.theoildrum.com/story/2005/12/5/133418/045
The graph you linked is not showing a peak until 2015 or so? (hard to judge by eye). What article would you recommend as most accurate?
Jon Freise
Analyze Not Fantasize -D. Meadows
Indy
Stuart has mentioned his need for quantitative analysis of the
expected duration of the housing recession.
Fred at iTulip published a chart sourced from Northern Trust in Chicago, which can be used to estimate the duration of this bust. It predicts 5 - 10 years, and does not incorporate the effect of the baby boomers retiring during this period.
Previously, I heard that baby boomer retirement alone was sufficient to trigger a housing slump, because retirees generally shift to smaller houses, apartments, yachts, or motor homes, while selling their big homes.
Together, I believe that the US will as Stuart mentions, consume less oil going forward. But I also agree that demographics in exporting countries as shown by the ELM and demographics in China and India will shift this product from the US to Asia.
What I am saying is the US will lose in this zero sum game, and the winners will be the rising economies of India - China - Asia - Latin America.
to a fixed rate mortgage, but this may be impeded by a continued tightening of lending standards.
see:
http://www.itulip.com/forums/showthread.php?p=12232#post12232
http://www.itulip.com/housingbubblecorrection.htm
INDY
We now need to push for oil fields to be set aside as an energy input into all those projects required to de-carbonize our economy. The worst case scenario is one in which we have a recession, with a weakened financial system, the easy and cheap oil gone, but with our coal fired power plants still chugging along and our ice sheets disintegrating.
Thanks to Stuart for a good explanation of credit crunch and housing bubble for a non-economist. I plan to take economics this semester so I can at least understand the basics when folks talk about markets. The multiple converging crises we face require an interdisciplinary understanding. The geologists, economists, chemists, biologists, physicists, climatologists, agricultural scientists, engineers, ecologists, social scientists all need to bring their data and think together. The specialization of knowledge, while essential, hamstrings us from complete understanding. situation at any time. If our economy tanks, oil depletion and greenhouse gas emissions continue at a lower rate, but contraction squashes innovation and adaptation. Necessity is the mother of invention, but only if you have capital.
Stuart,
Sooner or later the U.S. will experience a recession; my own guess is that it will be later, and my forecast for real GDP growth for the U.S. in the fourth quarter of 2007 is 2.5%. However, to be quite honest, last year I thought there would be a recession in 2007, but I was wrong: Consumer confidence and employment have held up very well.
Confidence is the name of the game. If there is a panic and consumer confidence goes down, then consumption spending goes down and so does the GDP. Right now I do not see panic spreading, and the financial markets are generally healthy, despite weakness in the subprime mortgage market and concerns about the resetting of Adjustable Rate Mortgages.
My own opinion is that Peak Oil will trigger recession through the impact of higher oil prices on the economy. I do not know when this will happen, but my best guess is that gasoline between four and five dollars a gallon would be sufficient to trigger a recession. Higher gasoline and heating oil and diesel prices will have worse effects, and the recession could last many years.
A recession would not be all bad from a Peak Oil standpoint. For one thing, a recession allows resources to be shifted, e.g. from home construction to oil exploration. I think that good investment opportunities in the energy industries will persist, and that there will probably be plenty of funds available to seek profits, e.g. in drilling for more oil. In terms of resource constraints, I worry far more about a shortage of engineers than I do a shortage of funds. Where there is opportunity for great profit, funds will be found, but we cannot replace our aging petroleum engineers by borrowing money.
Over the longer term of the next fifteen years I expect a situation similar to the seventies and early eighties, but worse: stagnation or negative growth in real GDP combined with worse inflation followed by much worse inflation as the Fed uses monetary policy to try to mitigate the effects of Peak Oil. Granted, monetary policy is not a good tool to use against the problems of Peak Oil, but it is all the Fed has. In terms of fiscal policy, I expect both tax cuts and great increases in spending as the U.S. government tries to stimulate a declining economy. Massively increasing government deficits plus easy money means monetization of the deficit, which will be extremely inflationary.
In my opinion, the odds of inflation versus deflation are nine to one. I think the Fed and other central banks have the power and the will to prevent any deflation. We'll know a lot more in a few weeks.
Hmmm. I'm not sure how you can say financial markets are "generally healthy". My understanding is that both the subprime and Alt-A markets have essentially disappeared due to lack of demand in the secondary market. That is 40% of the mortgage market last year no longer exists. And the largest mortgage lender in the country (Countrywide) just exercised all it's credit lines in a single lump.
How is that "healthy"?
Also, employment is historically a coincident or lagging indicator of recessions.
Worse Coutryside spent all that money in a single lump. Enron did that right before they went bankrupt.
Countrywide bankruptcy is a foregone conclusion in the industry - I have a friend at Iowa Realty and they've had them on deathwatch for weeks now.
B of A bought warrants in countryside. They are in too deep and can`t get out. Time to short B of A.
RobertInKyoto
I haven`t escaped from reality. i have a daypass.
Well, BoA bought a new special class of shares that pays a mandatory cash dividend. Several analysts have pointed out that it is logical to assume that BoA shorted the same number of CountryWide common shares. So they get the cash dividend for as long as CountryWide can stay solvent, the shorts hedge their equity if CountryWide is bankrupt, and the terms on the special shares give them some chance of getting a piece of the pie post-bankruptcy. There's no way they're going to lose money on this.
I feel bad because I have no idea what any of this means.
http://money.cnn.com/2007/08/23/magazines/fortune/eavis_countrywide.fort...
B of A bought a convertable bond. They don't have to short the stock to not care about the stock price. They can hang on to the bond. Like all bonds, they will get their interest until the borrower goes bankrupt. Sorry, B of A can easily lose their entire investment. A post-bankruptcy piece of CountrySide is worth nothing.
Countryside's main problem isn't toxic mortgages but toxic management. This is the next Enron and stabilizing their balance sheet doesn't change that.
RobertInSantaBarbara
I haven`t escaped from reality. I have a daypass.
http://money.cnn.com/2007/08/24/magazines/fortune/eavis_citigroup.fortun...
Guess which two bank stocks I'm going to buy puts on. I won't get naked shorts past the wifey.
RobertInSantaBarbara
I haven`t escaped from reality. I have a daypass.
The financial markets are generally healthy compared to what they were during much of the seventies and early nineteen eighties. Recall that only a quarter century ago the prime rate was at twenty percent--now that was a credit crunch!
If you look at the difference in interest rate between top graded corporate bonds and junk bonds you'll see that the difference is at historically low levels. True, this difference has increased in recent weeks, but it has not increased very much--not what you'd find in a panic.
The big barometer of financial confidence is the stock market. It is less than ten percent off recent highs. When the Dow Jones Industrial Average plunges below six thousand, then we'll see panic. So long as the stock market makes strong recoveries to selling pressure (as it has over the past week) I don't think we are in anything like a financial panic. It is hard to claim a financial panic in the absence of a bear market in stocks.
I think the consumer confidence numbers bear even closer watch than do the employment numbers, but one reason that consumer confidence has been so strong is that unemployment has been so low. Just as we'll only be able to see Peak Oil in the rear view mirror, so we'll also only be able to see the next recession one or two quarters after it begins. But so long as consumer spending holds up, we are not going to have a recession.
Your argument is not valid. To say "the stock market has only declined 10%" would always be true 10% into any historical stock market decline of any size. The same argument could have been made at several points in 1930. Obviously, the 10% decline reflects the degree to which the mass of financial investors have absorbed the credit crunch so far. It doesn't tell us anything about how much further it has to run. Most of the news coverage is telling us that no-one really understands which institutions have exposure to problematic assets.
I do not at present see how to do better. But one approach I am interested in pursuing is coming at it from the angle of how much house prices have to decline before the housing market can reequilibriate, given the new (old) mortgage standards (30 year fixed, 10% down or so). Then it's perhaps possible to get some handle on what proportion of household balance sheets might get impossible along the way, which in turn might give some rough idea of what the fundamental valuations of mortgage securities should look like (I realize there are a lot of non-linearities in this problem - it might not even have a unique solution).
If anyone knows of any references relevant to that kind of modeling, I'd appreciate it.
At no point during the nineteen thirties were stock market averages within 10% of the 1929 highs.
The single best indicator of financial confidence in the economy is the movement of major stock averages; I think the second-best indicator is the spread between high grade corporate boands and junk bonds. The data simply do not show a panic at this time.
Is panic in the future possible? Sure it is, and it may happen. My point is that problems in the subprime mortgage area have been fairly well contained, and speculation that they will spread is merely that--speculation. Evidence, as opposed to speculation, shows that there is plenty of liquidity in the market: Consumers are still borrowing more on their credit cards, and the great majority of businesses (which are indeed credit worthty at this time) have no problems in financing their inventories. When credit stops expanding we have a crunch, and we are not there now.
The question of how low home prices would have to fall to be "reasonable" (in terms of incomes) is an interesting and important one. The short answer is that in some markets (parts of California, for example) they could fall a great deal to come into some kind of "equilibrium." As Greenspan correctly stated, real estate markets are local, and it is more useful to look at regional trends rather than national averages. There is no doubt but that falling home prices will have a "poverty effect" and tend to hold consumer spending down. The magnitude of this effect is hard to estimate, though I believe several economists have done so, primarlily in connection with the reverse "wealth effect" of rising home prices.
It is not clear that the sub-prime "problem" has been "contained." In fact it is the concern that the problem extends well beyond subprime that resulted in the recent market frisson (wouldn't want to call it a panic as Don excludes that possibilty).
To understand the problem you need to be clear on the difference between "risk" and "uncertainty."
Risk can be quantified, it can be made known and by by being known one can determine your appetitie for risk and the reward for accepting risk.
But the structure of the CDOs and the other new financial instruments make it impossible to accurately calculate the risk. We are talking about derivatives of derivatives of derivatives packaged and resold, re-packaged and resold so that no one can be certain exactly what they hold and the amount of risk they to which they expose themselves.
This is the reason that no one wishes to trade these securities. No one has any true idea of what the risk exposure may be. And the problem is not contained. The problem cannot be said to be contained until all of these instruments are properly priced. And they cannot be priced to market until they are traded. And nobody wants to trade because no one can be sure of what they are buying or what they are selling. It is a very, very, big problem and it is not, repeat not contained.
They thought that dispersing the holdings would reduce risk by spreading out the ownership, as in the intuitive concept of "safety in numbers". But now they can't find a good paper trail and so it turns into actually more risk?
That is basically correct.
In financial markets 'risk" is something that we can objectively quantify. We can know it and delimit it and therefore we can price it and trade it. But because we are speaking of derivatives of derivatives of derivatives what was thought to be investment grade risk (AAA) is now revealed to be an unknown quantity. No one really knows the value and we cannot mark it to market until we trade it and no one is willing to trade it because no one really understands what it is that they are buying or selling. So the markets are encountering a global liquidity crisis. Making Fed funds available does not alter the underlying problem in fact it may make it worse.
With fractional reserve banking it is possible to take one dollar of capital and generate eight dollars worth of loans. Not all the customers will want their money at the same time so the bank effectively creates money where none existed. This structure works as long as all participants have confidence in it. We trust it.
The creation of derivatives has resulted in something similar such that the total of all outstanding derivatives is eight or ten times total world GDP. This structure works as long as all participants have confidence in it. The current problem is that the financial institutions have themselves lost confidence and are refusing to trade with each other out of fear of what they may be buying and the the fear that the counterparty may not be able to repay money loaned. This is a crises precisely because the banks do not trust each other. Different parties bought what they thought was a rated investment grade instrument (AAA) and they are now realizing that these may have been misrated and are actually a much lower grade security. What they thought was safe capital and carefully priced risk is now turning into huge uncertainty where the value of all instruments is being called into question.
I double checked and you are correct - there was a recovery following the crash, but it was within 1929. However, this doesn't invalidate my general point.
In terms of financial markets being healthy, would you care to comment on recent trends in short term treasuries:
The data point for today is from this FT story, the rest is from the St Louis Fed.
There is no doubt but that short and intermediate term treasuries have been very strong. That is exactly what would be expected to occur from the Fed pumping liquidity into the financial markets. In my opinion the Fed has been successful: The credit crunch has been averted, and the squeeze on liquidity is easing.
When BBB bonds take a tumble, and when the Dow Jones Industrial Average goes down a thousand points over a few days, then we may have a panic and a crunch. As I read the data, we are not there. The Fed did what the Fed is supposed to do--and their actions worked.
I do not know the future. Hurricane Dean or some later hurricane could do real damage to oil and fuel producing capabilities: I can visualize a recession triggered by hurricane-induced oil shortages. But we don't know what damage Hurricane Dean (or future hurricanes) will do to oil output. Similarly, we do not know the financial damage that might occur from from a credit crunch. But to date, neither the hurricane damage nor the credit crunch has happened.
Perhaps my perspective is different from that of many younger people because I've lived through more recessions and more trouble in the financial markets than have most people. In the financial markets what we have seen so far is maybe a tropical storm--but by no means even a Category 1 hurricane.
I'm no Pollyanna. We may have a fast crash, and we may have a slow catabolic squeeze, but for this month and this year I see no reason to push the panic button.
It would be interesting to see various forecasts of U.S. real GDP growth for the fourth quarter: I'm sticking with 2.5%, which is a slackening from the current rate of growth. And the number I'll be looking for is the first revision--not the original "flash" estimate.
"There is no doubt but that short and intermediate term treasuries have been very strong. That is exactly what would be expected to occur from the Fed pumping liquidity into the financial markets."
I don't think the timing of that explanation works right? The major liquidity injections where around Aug 8-10th, whereas this sudden huge drop in treasury yields is late last week, and especially today. Most coverage I've seen interprets this as a flight to quality in the money markets (which is not reassuring to be happening on this scale today). I'll go see if I can find the data on open market operations to be sure.
So now how does this explain the dramatic plunge in treasury yields in the last three or four business days (especially today)?
Financial markets have unpredictable time lags. For example, when the Fed eases money the impact on inflation is somewhere between six months and thirty-six months. The Fed has been buying Treasury securities over the past couple of weeks, sometimes more and sometimes less, but the Fed has been pumping reserves into the system at a goodly rate through routine daily open market operations.
I do not know why there was a sudden one-day change in Treasury bills, but my guess is that it was due to an accumulation of weeks of Fed easing. I do not consider a fall in Treasury Bill or Treasury note (or bond) yield to be an ominous sign. On the contrary, it is a sign of easing credit and easier money to borrow.
For those who want to know when to panic, look at the interest rates on less-than-investment-grade bonds. Now when those bonds spike up to historically high levels (and currently they are relatively low, compared to historical averages), then there is a matter for concern. In other words, junk bonds are a canary in the coal mine. That T-bill yields fall abruptly tells me that there has been a significant easing in credit and money.
"I do not know why there was a sudden one-day change in Treasury bills, "
Well, obviously, it's because some group of folks, apparently not the Fed, must have been trying to buy an awful lot of treasuries, presumably because they suddenly saw treasuries as much more desirable than whatever it was they were holding before. The obvious attribute of short term treasuries is their very low risk of default. So, I'm with the Financial Times:
"Healthy"? I think not.
"Flight to quality," O.K. we do have that. But what I have yet to see is a flight AWAY from junk bonds. When junk bond yields skyrocket, then we'll see panic--and in my opinion not until then.
Also, to the best of my knowledge, there is not one single bank in the U.S. in trouble--not a single one at or near insolvency. In a credit crunch banks get into trouble along with everybody else.
If the financial markets are so unhealthy, then why did most stocks go up today?
Don super doomer Mike here :)
Actually I agree with you about current conditions.
We are just returning to a normal market the fact that a few are already losing a lot of money just shows how distorted the market has become.
As a representative of the super doomer community your right things are not that bad.
Yet :)
I think the real pain will be after January that when we will pass right through a normal economy and head into a deepening recession. So I think normal will be a Indian Summer.
Well but this is my concern (and Krugman's). 30 years ago (or 80 years ago), you got your mortgage from a bank, which kept it on its books as an asset, along with the other loans it was making. So the credit creation process was largely mediated through banks. Today, you get your mortgage from someone like Countrywide (which apparently is "near insolvency"), who sells it into the secondary market as part of an MBS. An institutions like that are going down like flies. So is this not a contraction in the amount of credit being extended?
Most stock investors are still in denial :-)
Or the fed is monkeying around in the futures market. They manipulate interest rates and money supply...why not entertain the fact that they can also extend their reach into the futures markets and manipulate the indicies?
If the market was so sick, why did it go up so much in 1929 before the crash? See? I can ask the inverse silly question too. You are arguing theology again, without any scientific basis for what you say except that it is because you say it is. Circular logic in the extreme. Go argue with Billy Graham, please.
Further, your lack of knowledge is WRONG. Countrywide bank has experienced runs, for god's sake. Citigroup and Bank of America just had reserve lending requirements temporarily lifted by the government. Of course they play this as "normal" but when the hell else did this ever occur on this scale before? In addition, we have GM and Ford telling us they are going to close US plants entirely. We have GM seeing double digit declines in sales for June and July and now offering 0% interest, $0 down, no payments til 2008 loans to buy GM vehicles. We see Ford doing similarly utterly desperate things. Yet because this has all crept up on us slowly, because we are the proverbial frogs in the pot, we've come to accept this as normal? This would have been seen as insane in the era when I grew up, Don. You too, and you know it.
And what about the huge 6.9 billion euro bet against the European exchange falling by 30% by September 30? Or the $500 million in shorts against the S&P 500 falling 30% by the end of September?
How do you answer Justin Oliver at Canaccord Adams?
The Fed has put their finger in the dike but now leaks are springing up elsewhere. Even the big banks do not want to do business with one another. Why? Because no one knows what the real risk is anymore! The Fed is France, fighting the last war. The Fed is standing at the Maginot line while the world economy is doing a blitzkrieg around it. Bernanke is so intent on not repeating 1929 that he's going to get something worse instead. "History does not repeat, but it does rhyme." (Mark Twain)
"The greatest shortcoming of the human race is our inability to understand the exponential function." -- Dr. Albert Bartlett
Into the Grey Zone
I am still betting on the Fed and other central banks to be effective in preventing a credit crunch. Once again, look at the financial markets--stock markets and also the market for junk bonds.
There is no such thing as a "stealth" credit crunch. If and when one comes, we'll know about it quickly and emphatically. That we go on having these discussions is strong evidence to me that in fact (as opposed to supposition) there is no credit crunch. Problems continue in subprime mortgage lending, and neither the President's plan nor actions by Congress will resolve these issues. But banks keep lending money to corporations and individuals, credit card applications keep going out, and there have been some strong economic data from July, especially in the business investment area.
None of my above remarks should be construed to say that a recession is impossible. One of these quarters we will go into a recession, but I'm sticking with my forecast of an annual rate of 2.5% in real GDP for the fourth quarter of 2007. Now I'd be really interested in what other people's guestimates are: if the economy is going to turn down I want to know two things:
1) When?
2) How much?
If indeed there were to be a credit crunch now, then it follows that real GDP would go down quickly (probably in the third quarter, definitely in the fourth), and if it is a serious crunch then we'd be looking at some seriously negative numbers in real GDP growth.
Don, if we were to measure GDP as we measured it in the 1970s, we'd have negative growth. If we were to measure inflation as we measured it in the 1970s, we'd have double digit inflation. You are implicitly accepting what Bernanke and company are saying now and then comparing it to the 1970s. You cannot do that. That's apples and these are oranges. I will remind you that some people have unwound all the government chicanery to create very approximate comparisons between then and now and in every case the results are as I stated above - negative growth and double digit inflation.
You can get back to me when you explain how you can compare the stats of the government today to the stats of the 1970s in some convincing fashion and then draw the sort of conclusion that you are drawing here. And here's a hint: I won't accept any bald assertions. Give me facts, Don, as to why you are accepting the current claims of growth, which when recalculated by 1970s methods are negative. This is not your classroom where you can flunk me for telling you I won't buy your theology. I'm not going to accept being told to run off and Google it. YOU defend your position, not me. You are making a claim that, even if true, cannot be supported by the evidence you are selecting since the two bodies of evidence are not even comparable (due to drastic changes in how the various stats have been defined). I suggest you find better evidence of what you are claiming because what the evidence says does not support those claims if the data is recalculated in a manner comparable to the 1970s.
"The greatest shortcoming of the human race is our inability to understand the exponential function." -- Dr. Albert Bartlett
Into the Grey Zone
The best statistics we have are the official ones. God knows, they are not perfect, but they are the best ones we have.
Now you can deny generally accepted procedures for getting statistics and invent your own or find some set of statistics off a blog some place--fine; you are entitled to do that if you wish.
I will continue to use the official statistics, not because they are perfect, but because they are the best ones we have. An enormous number of talented and honest people work long hours to get the data and compile these statistics. You don't have to accept them, but if you are going to use "fringe" statistics, then your opinions are also "fringe" opinions.
The problems with getting accurate statistics for price-level changes are daunting ones, and I do not claim that anybody has solved this problem once and for all. Indeed, because of quality changes and changes in the basket of goods of what we buy it is theoretically impossible to get a "perfect" index of price-level change. If you want to be taken seriously, you have to use serious numbers, and the official statistics (with all their imperfections and limitations) pass this test. This is not just my assertion but the assertion of mainstream economists in general. Now you may wish to dismiss the discipline of economics as biased or irrelevant--but I notice that Nobel Prizes are still being awarded in that discipline--and a number of prizes have been for those who worked to improve GDP data and related numbers. I do not think those Scandanavian prize givers are chumps.
Don, is this assertion correct? You don't answer. You say the numbers are the best we have but don't answer this claim. Given the standard "government lies" and my experiences, I'd tend to believe Greyzone's claim, not "the best numbers the Government provides. And no, even if "enormous numbers of talented and honest people" work on them, it seems SOP for some hack to change them as he wishes.
My own personal experience is significant inflation and negative growth. Most of what I see as "growth" is destruction: incinerators, cost of congestion, negatives. That might just be this corner of Maine - anecdotal.
cfm in Gray, ME
Of course Don does not answer this claim. All that any one of you needs to do is start reading the annual statistical reports of any type from the 1970s forward. Look at the changes in definitions, in how statistics were collected, changes in formulae, etc. It is all completely documented in wide open text for everyone in the appendices to these reports. They tell you how they changed the definition of unemployment (many times) each year that they did it. They tell you how they've changed the inflation calculations, the GDP calculations, etc. The sum of these changes over 30+ years makes the reports completely not comparable to each other.
Don tries to disparage "some blog" with rhetoric, not fact. Yet never once does he address the fundamental changes in the definitions of the statistics. You cannot compare the 1970s economic data to now. It cannot be done without making adjustments. What Don claims was "bad times" back then would clock in looking very differently using the current definitions.
Finally, Don disparages the likes of John Williams who makes an extensive living consulting to the Fortune 500 doing exactly this - unwinding the stats so that their internal computer models can then be reliably used. He does this without ever presenting one single fact. Instead he relies on the data spewed by the same government that gave you WMDs in Iraq, he relies on innuendo against those who disagree with him, and he appeals to authority (his own and the government's). I'll let you be the judge as to whether you should accept his combination of "evidence" (if anyone even dares call it such).
"The greatest shortcoming of the human race is our inability to understand the exponential function." -- Dr. Albert Bartlett
Into the Grey Zone
You are correct that statistics have changed since the nineteen seventies, and that it is impossible to have reliable direct comparisons between (for example) prices in the nineteen seventies and today. What I assert is that the changes have been made in the interests of improving the accuracy, the validity, and the relevance of the statistics. Your--completely unsubstantiated--assertion is that the changes have been made to lie, to deny what is really going on.
The enterprise of gathering data and compiling it into useful statistics for GDP and related numbers is a huge one that involves thousands of people--many of them civil servants with no political agenda at all. The assertion that somehow the official statistics have been subverted for political reasons is not only false, it is unfounded. Not only is the assertion false, it is demonstrably false, because you would have to have a conspiracy of at least hundreds and probably thousands of people involved to make it work. If you're a conspiracy theorist, fine, then you can come to this conclusion of purposely biased statistics--but that is the only way you can come to this conclusion.
The great usefulness of GDP data is not for comparing the nineteen seventies to 2007 but rather to see which direction "the economy" i.e. real GDP growth is going. The current numbers--with all their imperfections--are valid and accurate enough to determine whether or not the economy is in a recession. The topic of this post is the credit crunch and what impacts it may have on peak oil. The official statistics are accurate and robust enough to determine whether the economy is speeding up or slowing down--and by how much. If there is a true credit crunch, then we can expect to see a recession as shown by the official statistics. We might, of course, go into recession even without a credit crunch over the next few quarters. Or, if I am correct and the credit crunch has been aborted, then we may see several more quarters with no recession.
The main problem with official statistics at the moment is not that they are biased for political reasons; the main problem is that they are expensive to gather, and the enterprise of gathering data and compiling statistics is underfunded because the main constituency for better economic statistics (economists) has little political clout. I do claim that there is no shred of evidence to show that changes in official statistics have been made to obscure what is actually going on in the economy. On the contrary, my belief and that of other mainstream economists is that changes have been made in attempt to get the official statistics closer to reality.
By the way, I have no affiliation with any statistics-gathering organization or individual, and I have no axe to grind in stating my position.
Don,
Through all yours and Stuarts discussion I still end up with the same question about the US economy.
The question is: If the current economic growth has been for a large part the result of a real estate bubble ( previous impetus from the dot com bubble}, where do either of you, Stuart or anyone see anything that would result in growth to compensate for the popping of this current bubble.
About your statement: The assertion that somehow the official statistics have been subverted for political reasons is not only false, it is unfounded.
Those in power seem to have misrepresented economic realities in the current real estate situation. That situation has been quite apparent for years to many crying in the wilderness, so why would they not lie or misrepresent those statistics, that seems a perfectly good way to cover tracks to me.
I am going to quote this in full so that everyone here can see the nature of the beast first hand.
Ref: Employment and Unemployment Reporting
This discussion of the Consumer Price Index discusses how it is universally understating inflation by at least 7% due to statistical methods deliberately chosen.
Don, if you can sit there with a straight face and still claim that government stats are not changed for political reasons, then we are simply going to have to disagree because the evidence demonstrates that you are incorrect.
P.S. I note once again that Don never provides facts, just economic theology. Sorry, Don, but I am not a believer in your religion so you'll have to do more to convince me than appeal to your god.
"The greatest shortcoming of the human race is our inability to understand the exponential function." -- Dr. Albert Bartlett
Into the Grey Zone
I'll say again that any study of economics needs to be grounded in physical sciences, like chemistry, physics, biology, chaos. Otherwise its being based on nothing more substantive than the Daily Horoscope.
Grey Zone,
Your own religion has as one of its tenets that changes to economic statistics are
1. based on political factors and
2. dishonest.
As usual, you have provided not the smallest morsel of evidence to support either of these claims. Are you blaming the Clinton administration for changing the way numbers are gathered to make its own administration look better? It seems that way to me. For the sake of discussion, suppose that is the case, that political pressure from the Clinton administration caused the statistics to be fudged. That would cause a ONE TIME change (e.g. the change in the definition of discouraged workers), but it would not affect reported trends of unemployment in later years.
I do not claim the statistics as gathered today are perfect, but they are among the best macroeconomic data that any country has in the world today. Perhaps the foundation of our disagreement is that I recognize and accept the limitations of existing data, whereas you believe that somehow there are "true" numbers out there that contradict the official ones. By using different definitions you can come up with different results; there is no question about that. But where you come up with a zero is in your assertion that the definitions you pick are somehow better or truer than those made by the Bureau of Labor Statistics and other statistics gathering organizations. You jump to the conclusion--again with no evidence at all--that changes are made only for cynical political motives, and you ignore the possibility that statistics in 2007 present a more accurate picture of the state and trends in the economy than did the statistics of thirty years ago. By implication, you are saying that professional economists and statisticians are either incompetent or dishonest when they use the official statistics instead of the ones you like.
Given your religious beliefs about the nefarious motives of those in power, your conclusion follows, but I hope you realize that it is your religion that you are espousing and nothing else.
Mainstream economics has many flaws. In my opinion, dishonesty is not one of them.
Hey a pox on both your religeons!
Where is the growth to come from?...Where is the beef? Maybe a bubble in gastric bypasses , stomach stapling, personal mobility devices, tents for the dispossessed, tin cups and pencils ?
Quick, quick, guys let me know I'm standing here completely divested!!!
Don, address the appendices of the annual statistical reports by the various agencies of government over the last 30 years and then we can have a discussion. Until you even admit that these changes are done, frequently and sometimes with political motivations to make the stats look good, we cannot have a discussion.
And NO, I do not assert that there is any "true" set of data. What I have said repeatedly is that you cannot compare apples and oranges, yet here are you are in this thread doing exactly that trying to tell us that the 1970s were bad and this is not bad. And when confronted though you leap back to defending the current stats without ever addressing that the comparisons that you made are completely invalid because the data is not comparable in any way, shape or form.
The other point I have made is that you CAN unwind the changes that have been applied and create comparable data sets. You could go the other way too, Don, and apply these changes to the 1970s data. Why don't you collect those 30 years of changes and apply them to the 1970s data, ok? Then we can see whether the recessions of the 1970s would have looked like recessions with today's definitions. We can see whether the credit crunches of the 1970s would have looked like credit crunches with today's definitions.
Mind you, I don't expect you to actually do this. You refuse the work done by those who have gone the other direction and you will have some convenient excuse for not applying the current methodologies to the old data. In short I fully expect more rhetoric from Don Sailorman but never, ever facts or data.
"The greatest shortcoming of the human race is our inability to understand the exponential function." -- Dr. Albert Bartlett
Into the Grey Zone
Grey Zone,
I think that you have lost sight of the big questions that Stuart is asking in this thread:
1) How bad is the credit crunch?
2) If the credit crunch induces a recession, then to what extent will this economic downturn choke off investment needed to mitigate the effects of Peak Oil?
These are the big issues, and I stand by my assertion that the data we have are good enough to arrive at answers. We have good financial data; we know how much borrowing and lending is going on, and at what interest rates. We have good data on nominal total spending and pretty good data on gross private domestic investment. The issues you raise (such as how discouraged workers should be counted or not counted as unemployed) are largely irrelevant to answering Stuart's question.
It is my opinion that this is not the forum on which to get involved in a debate as to the details of the hundreds of ways in which changes have been made to which data are collected, how data is compiled and how it is presented.
And yet you personally assessed this credit crunch by making statistical comparisons to the 1970s, which now that you've been confronted, you wish to forget and simply proclaim that all is well because you say all is well.
I'm not buying it, Don. The issues I raise are central to your comparison because you made the comparison!!! That would mean that I probably should discount your assessment since you've already admitted that the data you compared is no longer comparable. And that throws us back to looking at the data today and trying to draw conclusions solely from that data. And to say that there are many people who disagree with you would be an understatement.
By the way, you never did answer Justin Oliver whom I quoted further up thread about the T-Bill/LIBOR rate discrepancy. That sure looks like tightening lines of credit to me, even amongst the major banks to each other. Of course, you never answered any question in any factual specific manner either, did you?
"The greatest shortcoming of the human race is our inability to understand the exponential function." -- Dr. Albert Bartlett
Into the Grey Zone
If you are correct, then there is a credit crunch which presumably will quickly produce a stock-market decline and a recession. Let us now wait and see: I've made my forecast for fourth-quarter 2007 real GDP of 2.5% annualized rate of growth.
If you have the courage of your convictions, let's have your forecast.
Then let's wait and see who was closer to being right.
Ha! By what benchmark are we supposed to define this bet? By the government's own stats, which you so conveniently cling to even after having your nose rubbed in the fact that the stats are manipulated?
Of course those stats will say things are peachy keen. Those same definitions, if applied in 1973 would have claimed growth then too. Those same definitions if applied in 1979 would have had inflation under 10%.
No, Don, circular arguments are not my cup of tea. Go right ahead though and play theologian to the religion of economics.
"The greatest shortcoming of the human race is our inability to understand the exponential function." -- Dr. Albert Bartlett
Into the Grey Zone
The credit markets may be unhealthy, but the equity markets have been holding up better than one might expect. For example, Berkshire Hathaway (class A) shares just closed at an all-time high of $120,700 per share today. That's up 9.7% for the year. For anyone holding a value-oriented equity portfolio with no leverage, they are probably doing just fine.
What's that 9.7% yield in Canadian Dollars or Euros? And this is if you bought the Berkshire.
RobertInSantaBarbara
I haven`t escaped from reality. I have a daypass.
Remember the 15th of August everyone had to notify a hedgefund (That they were invested in) if they wanted to pull their money out.
Many did, by the end of Sept, you will see many go under.
An incredible time to be an observer.
Sammsara, found this item:
Sept 3 'FINANCIAL NEWS Ltd.'
**(not to sure what that sentence means, several ways to cut it, but I think 1.5 trillion is still a bunch no matter how the author slices it)
http://www.financialnews-us.com/?page=ushome&contentid=2448647302
An incredible time to own a hedge fund.
Don, when you start panicking, that's when I'm really going to start worrying!
Why has no one mentioned the extreme manipulation of the market through the Plunge Protection Team (PPT)?
The Fed is stepping in to prop up a doomed market. That is not a market. That is what many here would call communism. (For the rich.) In fact, I would expect all of the free marketeers to be all the more worried. The Fed and its little fact and chart producers have been choking off reality since Nixon first ordered the consumer price index be cleaned up by removing food and energy. The Repugs have continued hefting the reality axe for years, bringing us such fantasy favorites as hiding the M1 and changing the way the unemployed are counted.
Anyone who would say that the economy is healthy or the credit crunch is contained is as crazy as a poop-house rat.
Are you predicting, along with hyperinflation, strongly negative real interest rates?
That would seem to be good for debtors, including ARM holders...
Rapidly and unexpectedly increasing rates of inflation will transfer wealth from savers to debtors. I expect that in an attempt to mitigate the recessionary (and deflationary) effects of Peak Oil that the Fed will at some point respond with extremely easy money--and monetize the U.S. government deficit, which will be extremely inflationary.
When there is way too much debt in the economy (as there is now in the U.S. economy) the one and only sure way to deal with it is to get rid of a portion of all this debt by accelerating inflation. At some point real interest rates are likely to go negative--as they did for years during the nineteen seventies.
Whether the Fed pushes all the way to hyperinflation is another question--one to which nobody can have the answer at this time. But if it came down to a choice between a nineteen thirties type deflation and a Germany 1923 style hyperinflation, then the Fed would capitulate and allow hyperinflation. This would of course destroy the assets of all insurance companies and most of the assets of pension funds, but at some point the Fed may feel that the destruction of financial assets is a price that must be paid to avoid deflation.
Note that by increasing the rate of U.S. inflation the value of the dollar will go down compared to that of foreign currencies; foreigners who hold dollar assets will be screwed, blued, and tatooed by accelerating double-digit inflation in the U.S. (You didn't really think we were going to pay back the Chinese all the money we owe them, did you?)
"I expect that in an attempt to mitigate the recessionary (and deflationary) effects of Peak Oil that the Fed will at some point respond with extremely easy money--and monetize the U.S. government deficit, which will be extremely inflationary."
Theoretically, the Fed would maintain it's target of 1-2% inflation. I have the impression that they have communicated that in the presence of stagflation that target would be allowed to rise slightly, as it has now, but not a lot. I believe you're suggesting that in the presence of stagflation that the inflation target has a lot more "give" than that.
OK. What do you think of the argument that markets have become more efficient, price-wise, in the last 30 years due to telecom & globalization, so that stagflation is less likely? I.E., that if you have recession or depression that you're likely to have low inflation rates, and the Fed can ease money to reduce recession with less risk of inflation than was historically the case?
Finally, it seems to me that the main cause of recession/depression in the US will be transfer of wealth to ME/Russia, that this is not causing recession/depression currently due to recycling of petrodollars, and that the greatest risk is that ME/Russia will lose their appetite for more debt, and demand higher rates on their t-bills, thus slowing the OECD economy. One could argue that the Saudi's, in particular, foresee depletion ("son will ride camel, etc"), and will be willing to take on quite a bit of US debt - after all, they took on debt in the 70's, and spent all of it in the 80's and 90's when prices crashed.
What do you think?
There is a saying that John Maynard Keynes popularized, and it goes something like this: "If you owe the bank a thousand pounds, the bank owns you. But if you owe the bank a million pounds, you own the bank." In other words, the international creditors of the United States are owed so much money that we "own" them; they are at the mercy of our monetary policies.
Just in response to stagflation I do not expect inflation to go much above six percent per year. Stagnant growth is not the issue, as I see it. Rather, I expect Peak Oil to produce years of negative real economic growth--year after year of severe recession, always tending to lapse into the severe downturn of a deflationary depression. The big point, in my opinion, is that the Fed has the power and the will to knock a deflation dead in its tracks: The power to expand the monetary supply without limit is the power to create inflation without limit. For various reasons, I do not believe that we'll ever get stuck in a liquidity trap, but even if we do, the Fed can escape this trap by monetizing the deficit.
Now the Fed is not going to give up the fight against inflation without a struggle. To let the value of the dollar plummet goes against everything the Fed stands for. If and only if the choice is between deflationary depression and extremely rapid growth in the supply of credit and money do I expect the Fed to captitulate--to give up everything it stands for and to purposely inflate away the value of the dollar to prevent debt-default deflation.
By putting my imagination into overdrive I can conjure up a vision where the Fed never has to increase the rate of inflation much over six percent, but for that to happen many many things would have to turn out just exactly right--low depletion rates in exporting countries, technological breakthroughs, a great shift in real investment to energy supplying and energy conserving industries, implementation of Alan Drake's proposals, fiscal responsibility on the part of the U.S. government. On the other hand, my estimate of the probabilities is worse inflation followed by much worse inflation--and then TSHTF and maybe triple digit inflation or much worse than that.
How we will respond to Peak Oil is not Written. We do not know how Peak Oil will play out, but the most likely scenario I see is one of depression combined with ever worsening inflation. Falling oil output in the years after Peak Oil will be such a drag on the real economy that I think all the stops on fiscal and monetary policy will be pulled out to combat depression. We cannot conjure oil with a magic wand, but with accelerating inflation we can get rid of debts--including the national debt and including debts to foreigners. Getting rid of debt will provide great relief to many Americans, and the political influence of the debtor class is superior to that of the creditor class, according to John Maynard Keynes.
The Fed's primary enemy is a deflation which makes the system unstable. Isn't it possible, with luck, to have falling output, due to PO, without deflation or inflation?
"Falling output" is another name for "recession" or "depression." Theoretically one could have stable prices during a recession, and during some recessions about half a century or more ago we did have approximately stable prices. But in my opinion we have to look first and foremost at what is happening to fiscal policy--taxing and spending and deficits of the U.S. government.
In a recession or depression deficits tend to increase greatly, because tax revenues fall while spending such as unemployment benefits increases. Now, how can huge increases in deficits be financed? In severe cases the only way is through aggressive buying of Treasury bills, notes, and bonds by the Fed; in other words, only by monetization of the deficit can the government continue to sell its securities.
If the U.S. government were to balance its budget (not likely) then there would be no great pressure on the Fed to inflate the supply of money and credit. Because I expect humongous deficits, I also expect rapidly increasing rates of inflation. Thus we have to look at both fiscal and monetary policies--and bear in mind that as surely as water tends to run downhill, politicians tend to spend more and tax less to buy popularity. Erasing debts through increasing inflation may also become increasingly politically acceptable as the burden of consumer and mortgage debt increases. Politicians tend to listen to voters, and many voters are deeply in debt. And as more and more of our debt (U.S. Treasury securities) is held by foreigners, more and more of the cost of inflation to savers is exported overseas.
The problem is not what the hold but getting them to buy even more debt. They are slowly wising up to the subprime problem and backing out of MBS's. I can't see them continuing to buy other US debt under our current conditions without high interest rates.
And this time around we wont see a increase in wages so inflation does not help. Since far more commodities esp oil are imported now then in the 70's inflation will cause a large increase in commodities crippling regular industry.
Your dismissive of a weak dollar but the combination of a weak dollar and low interest rats is simply not going to attract money. I agree with you that attempts to inflate will be made but the US is under a lot more constraints now then ever before.
Next interest rates at not the biggest issue sub prime mortgage holders face the problem is that they are now underwater on their loans and will have to bring cash to the table to refinance tens of thousands of dollars. They simply don't have this kind of money.
To save the day the government would have to offer 1% loans
to the homeowners and they basically can never sell.
Rates mean nothing when your underwater on your loan by 50k and can only afford a teaser rate interest only loan. Way to many borrowers are in the category. Even if the government took on all the loans these people would still be short sale/defaults when other factors forced them to move. Not to mention that we are going to have regular problems from simple job losses soon.
So I don't see a way out of this one outside of the government outright paying off the loans until they where and adjusting them as market values decline.
And last but not least thats existing loans how are you going to get new sales in such a warped market ?
Now way out.
Keynes popularized “...in the long run we will all be dead” too.
www.shadowstats.com
FYI...
From reading "Devil Take the Hindmost--A History of Financial Speculation" by Edward Chancellor, I can say that the Dow almost recovered to pre-crash October 1929 levels by April 1930. Then the bottom fell out.
Massive movement into Short Term Tbills. Listen, Everybody is moving into cash. They don't even trust banks. The crest of the ARM resets coming in 4th quarter and 1st quarter next. 5-600 billion. Those will be foreclosed on..
It's just getting started.
A major fireworks coming in the Commercial Paper area. It Can't seem to roll over, the next 30-60 days many will go under. CASH has stopped moving.
Watch the next 20 days.
Again, watch the next 20 days. Some extreme days coming quickly.
A term that may come back into the common lexicon,
Bank Holiday
Indy
Stuart, such work has been done by the economists at Northern Trust in Chicago. It has been published on iTulip.
Basically the old standards were the house should cost between 4 - 6 times earnings, with the former number the norm, and the larger number only for houses in prime areas, bought by young professionals.
Given an average family income of $ 40,000/ yr. Houses should cost between $ 160,000 - 240,000. Given that the average price now is at the high end of this scale, we can expect over shoot and likely will see prices drop to the low end of this range or below it, before recovery.
Specifically, this implies a >33% decline in home prices over a period of 5-10 years.
This analysis does not include the effect of the pending retirement of the baby boomers, which will put ~ 20,000,000 homes on the market alone.
Adding in that factor, we have a very large problem going forward, given that 70% of GDP is consumer spending.
Stuart, you are an 0ptimist....
INDY
The employment numbers published by the Fed seem pretty bogus with most of the gains coming from a backward looking business birth/death model. This has been blogged for some time. The information on the internet is extensive.
In general most stats collected are lagging indicators of a rescission and by using backward looking corrections they now lag the current situation quite a bit.
The widening mismatch between what the government is reporting and what people are experiencing is simply feeding the fear level. It worked for a bit but I suspect that like the rating agencies we will see the Governments new math discredited soon.
Memmel
Take a read on Mish's take on the employement.
Implode-O-Meter Stats vs. the BLS
http://globaleconomicanalysis.blogspot.com/
The model they use assumes (ie plugs in a number) that firms will be hiring. Not whether they did.
I talked about construction jobs in Fed questions the BLS jobs model http://globaleconomicanalysis.blogspot.com/2007/07/fed-questions-bls-job...
and Employment on Pluto Rises http://globaleconomicanalysis.blogspot.com/2007/07/employment-on-pluto-r...
but now it's high time we start seriously questioning a model that assumes new businesses are actually adding jobs in the financial services sector.
Don would you be willing to talk about the issue of the dollar value. The problem as I see it is if they lower rates now the dollar will drop fueling massive price inflation. And because of globalization wages no longer increase so consumer spending will continue to slow.
I don't know what the Fed will do but I don't think it matters since wages can't increase and consumer spending will decline no matter what this is the root of the problem IMHO. Next I'd think a attempt to drop rates will have to be reversed to save the dollar.
Your thoughts ?
The dollar is overvalued compared to foreign currencies, and greatly overvalued compared to some such as the Chinese yuan. I think that no matter what the Fed does, the dollar will go down--both in terms of domestic purchasing power and also against foreign currencies.
In my opinion, the Fed will not raise interest rates to "defend the dollar."
They will raise interest rates to dampen price inflation.
But a weak dollar would be a primary reason for this price inflation.
In any case the core problem we have in my opinion is no way to increase wages or purchasing power which should continue to decline regardless of the movement of currencies. This is the core problem. And of course a lot of Americans are deep in debt. Thus deflation kills the American consumer because of debt and inflation kill the consumer because of stagnant wages. So I can't see how any monetary policy can solve the problem of a deeply indebted person loosing real purchasing power. The difference this time around is wages are now tied to the global economy since companies can "offshore" to keep profit margins over the short term. In my opinion we achieved globalization twice in the past. Before WWI and before the Great Depression. During both periods world wide trade reached new highs. And shortly afterwards overproduction caused the world economy to falter.
Because of the cold war and the devastation of Europe after World War II we are just now reaching the same level of globalization seen in the 1800 and early 1900 and in the 1920's after WWI. And again we see in my opinion overproduction and wages stagnating coupled with tight commodities markets.
http://www.commodities-now.com/content/market-areas/ags-and-softs/ma-art...
On page 3 of this PDF you can clearly see the rise and fall
of commodity prices. I think this paper is trying to refute
the concept of super cycles but it seems that each time we
had a stable world open to pretty much free trade the economy has burned itself out.
Your opinion ?
I am dubious of the whole concept of business cycles--of whatever duration. The concept of "cycles" implies regularity and predictability. Business fluctuations are not predictable; none of the models can call turning points.
There is one observation by the late economist Joseph Schumpeter that I find very interesting and possibly encouraging. According to him, there is strong evidence that innovations come in "swarms," swarms that appear roughly sixty years apart. Well, sixty years ago there was a helluva swarm of innovations, and we may be due for something similar today. My impression is that the rate of technological advances has been lower in each successive decade after the nineteen fifties. It could be that the next decade will see a swarm of inventions that will help with energy conservation and energy production. Even a surge in technological advances will not get us through Peak Oil without major and prolonged pain--but they could help.
In regard to globalization, I am a follower of John Maynard Keynes. He thought, ". . . most goods should be homespun," and he was not impressed by the static comparative advantage models that suggested more trade is usually a good thing. One thing he was keenly aware of was the costs of change--something soft-pedalled by all too many economists nowadays.
By the way, there is nothing wrong with economics as a discipline. Unfortunately, we have a lot of puny-minded economists these days who have not figured out how to stand on the shoulders of the giants of the past.
To read the works of the nineteenth-century classical English economists and their concerns about energy constraints (i.e. coal) is enlightening. They knew all about limited resources and scarcity and poverty and problems of income distribution. And remember, Malthus was a political economist, which was what economists were called a couple of hundred years ago. (Or maybe he was considred a "moral philosopher" as was Adam Smith. But Malthus is one of the Founding Fathers of economics in any case.)
No, "cycle" implies regularity and repeatability, not predictability.
Life is a cycle. Animals and plants are both created out of the wastes left by previous animals and plants. You can regularly assume that life fosters new life, just as regularly you can assume that every individual living agent dies, yet the individual instances of birth and death are unpredictable. A cycle.
Malthus, lacking an understanding of nonlinearity and feedback, was a blind man leading blind and deaf mutes. A leader and ahead of his time, but certainly we can do better today.
I am becoming more and more dubious, after decades in business, after a BSBA and an MBA in Finance, that economics was ever a science to begin with.
In my opinion, "regularity" and "repeatability" in combination imply predictability.
Economics is not a natural science like physics or chemistry; it is a social science. Insofar as economists use scientific methods, economics becomes a science. Insofar as economists ape the methods of physics in inappropriate ways, economics remains a pseudoscience. With all its shortcomings, there have been significant advances in economics and the study of economic history during the past fifty years. Many big topics of debate (Which matters most? Fiscal policy or monetary policy? What caused the Great Depression?) the disputes have been resolved to the satisfaction of most.
Going to its roots, economics is about scarcity and choices. Properly employed, I know of no discipline that can shed greater light on issues of Peak Oil than economics. Just as economists were of key importance to the U.S. in mobilizing resources to fight World War Two, I think economists will be important in helping this country to meet the challenges of Peak Oil.
Where some economists go wrong is in thinking (naively) that there are good substitutes for cheap oil. There are no good substitutes for cheap oil; we are going to have to make do with highly imperfect substitutes and much more expensive liquid fuels in the future. There is nothing in the discipline of economics, however, that asserts that there are good substitutes for cheap oil or that they will be discovered or that technology or "the market" will provide them. For good reasons economics has been called "the dismal science," because all choices have opportunity costs. The cumulative costs of building our economy on a base of cheap oil are huge--and perhaps not recognized yet by many mainstream economists.
Many economists accept the forecasts of CERA and similar organizations--forecasts based on the notion that there is plenty of oil out there to be discovered and developed, and that Peak is decades away. This acceptance perhaps reflects an undue tendency by many economists to accept "respectable" authorities rather than to question these authorities--but I do not think this failing reflects negatively on the discipline of economics itself. Rather, it reflects badly on the poor education that economists (and others) have received in critical thinking.
Taking issue with regular and repeatable equating to "predictable". Again, life is replete with nonlinear processes that are regular and repeat but are unpredictable.
Meaning, roughly, that you can depend on something happening again, but you won't know exactly when, where, or how.
Weather is another example of a system that is regular and repeats, but is unpredictable. You can count on it precipitating (rain/snow), but exactly when, where, and how much are unknowable.
There was an article on nonlinear dynamics in economics I read fifteen years ago, but can't remember the title. The title was similar to a famous nonlinear dynamics paper called "Period Three Implies Chaos". But two articles I just found might prove helpful in understanding regular, repeatable, unpredictable cycles in economics. From the Quarterly Journal of Economics and Oxford Economic Papers, but you will need access to JSTOR.
Unscrambling Chaos Through Thick and Thin
The Economics of Chaos or the Chaos of Economics
I also recommend "Chaos: The Making of a New Science" by James Gleick. Google it.
The rest of your post I pretty much agree with. Will wonders never cease. ;)
Ahh, here it is, though this is more advanced, also on JSTOR, Period Three Implies Heavy Discounting.
I'd recommend starting with "Period Three Implies Chaos", American Mathematical Monthly, Dec 1975.
". There are no good substitutes for cheap oil"
No, but it seems to me that there are excellent substitutes for 80% of modestly expensive oil, and that seems like enough.
PHEV's become cheaper than ICE's at $1.75/gallon, and they displace 75-99% of light vehicle fuel useage depending on your consumption pattern, with no compromises.
This comment is just a hunch, but a hunch informed by fairly wide general knowledge. I suspect the general meltdown will be in a year or so, rather than immediately because consumer confidence still seems pretty high, and employment levels decent. The Chinese and the petro dollar holders are not going to be willing to write off their investments quite yet, although they are going to try to get out of the US economy as quickly as possible. So They'll help prop this mess up.
In the mean time certain classes of mortgage holders are dead meat. All the no-money-down flippers are stuck, and that's a very large percentage of the subprime. there's widespread hurt in the bottom layers of the finance industry, the mortgage brokers, real estate agents, and bank loan officers are all unemployed whether they know it or not. All the construction contractors will have a bleak Christmas, and bulding supply folks face major declines for quite a few years.
The refinery construction in Saudi Arabia and Russia seems like the Export Land Theory is about to kick in. They are by far the two largest exporters, and I think they covet the $10 to $15 a barrel made by refiners in the OECD nations. Not only will this save them big bucks on their own growing internal consumption, it will provide excellent well paying jobs for their people.
But, I think oil prices will hold in US dollar terms and may even accelerate the trend up. Soon, no one will take US paper overseas because of rampant US inflation, maybe even Canadians and Mexicans. We're importing 68% now, over 14 million barrels a day, and its impossible to switch or make it up. And about 25% or 30% is in products which are refined overseas. So, if you own domestic oil production you should come out a winner. Its not expensive to convert a car to natural gas, so possibly that will go through the roof too, in spite of the current US oversupply.
Bob Ebersole
I keep my ear to the investor chatter to keep abreast of the direction the wind is blowing (have no assets to invest myself) and they seem very spooked, the ones who are close to the trading every day and are privy to the rumors, etc. Last Thursday, they WERE panicked. It was not a matter of "when there is a panic." Panic was happening. Even after the last couple days of neutral trading, the traders expect the market to hit low after low going forwards. Right now it is money being pulled back in from international markets and out of riskier assets. Short term treasury fell like a stone today because money is coming out of many assets and sitting in wait-state at this point whilst the owners get their bearings.
Sub-primes are not "contained" nor is the domino effect on leveraged funds. It is just still not out in public knowledge yet.
Generally, speaking, from my own perspective at the foot of the mountain, the weather feels almost exactly like the Fall of 2000. Business was booming still, but just beginning to shudder a little. Market commentators shrugged off any suggestion of markets ever dropping whilst detached analysts were saying recession coming in 3-6months. What happened? Bang, after the holidays recession and layoffs everywhere. That time I survive three layoffs by the skin of my teeth. I'm not so confident this time: I think the engineering company I work for will go under this time.
Charlie.
Hi Firewalker,
Hope no layoff is in store for you, though it does feel like that 'deja vu all over again' thing. At that time, fall 2000, the calming message which I was assured was the real McCoy, was that the US election that fall would bring great good! Phooey on calming messages, I'll take that out in cash instead this time:)
"We're importing 68% now, over 14 million barrels a day, and its impossible to switch or make it up. "
As I noted a moment ago to DonSailorman, it seems to me that there are excellent substitutes for 80% of oil at modest prices, and that seems like enough.
PHEV's become cheaper than ICE's at $1.75/gallon, and they displace 75-99% of light vehicle fuel useage depending on your consumption pattern, with no compromises.
No, you're mischaracterizing the facts. There are excellent substitutes for 80% of light-duty vehicle motor fuel, which is ~45% of US oil consumption. Heavy-duty vehicle fuel, heating fuel, aircraft fuel, industrial fuel and chemical feedstocks are different matters.
This may sound like nit-picking, but if we are in a decline scenario (or need to slash our requirements for other reasons) the number of available "wedges" and their possible contributions become matters of extreme importance.
I suppose I should have been clearer: PHEV's are just one example of a substitute for oil & gas which wasn't economic during the era of really cheap oil, but which is now more than competitive at current prices.
These include rail & electrification for heavy-duty vehicle fuel; ground & air exchange heat pumps for heating fuel; wind for electrical generation (clearly cost-competitive with oil & gas, and competitive with coal if one includes even a modest accounting for external costs); and biomass for chemical feedstocks (much, much more efficient than biomass for liquid fuels).
There are some process heat and space heating applications for which only electrical resistance heat would be a direct substitute, and of course this isn’t currently cost-competitive, but it is viable.
The only area for which I don’t see a clear, direct substitute is jet fuel, which accounts for about 8% of US fuel useage. There are of course inferior or substantially more expensive and/or less convenient substitutes, such as rail (superior in certain niches), videoconferencing, biofuels or liquid hydrogen. This doesn’t seem like a big concern, as aviation is really for convenience/recreation, not necessities (excepting such niches as disaster relief, for which I'm sure we can provide, and war, which is arguably not a necessity, but for which I imagine we will provide), so the small chance that decent solutions won’t be found in 50 years (or 100, if one includes CTL as a bridge) doesn’t seem too worrying.
removed a double postBob Ebersole
In short, whatever your preferred method of mitigating or adapting to peak oil, you can pretty much kiss it goodbye during a major meltdown of the financial system
I have long thought that the #1 short-term (Years 1 to 5) response to post-Peak Oil would be reduced economic activity with improved fleet fuel economy #2. #1 is the "easiest" way to make demand = supply.
So a severe recession and/or depression was already part of my mental map. Public works and public supported private capital investment are likely to be one of the major responses to a severe recession/depression.
A variety of subsidies and/or tax abatements could still induce the freight railroads to electrify.
Residual freight movements could be still be transferred to railroads by a truck only toll on Interstate highways, so the volume of freight moved on RRs could grow significantly as overall volume dropped by, say, a fifth to even a third. This increased business would induce the RRs to continue to expand capacity.
The CSX proposal to the gov't to help finance (the other 13 proposals were all for more highways)
1) 1,200 miles of grade separation from Washington DC to Miami
2) 4 tracks from DC to Richmond (2 pax, 2 freight)
3) 3 tracks from Richmond to Miami
Two tracks would provide 50 to 70 mph freight service and one would provide 110 mph max (avg 87 mph w/stops) passenger service.
pdf at
http://www.secorridor.fra.dot.gov/docs/csx/CSX_CFP.pdf
This template could be replicated on a variety of other major corridors.
Likewise increasing the federal subsidy to 90+% for Urban Rail could result in a major building boom. See WPA and other New Deal programs.
And wind turbines could also expend greatly with modest gov't support (NG exploration declines and NG will again be short in a few years even with reduced demand).
Best Hopes even during a Depression,
Alan
Why doesn't CSX use their own money? Is Snow still in charge of Treasury? CSX has access to the best, biggest and fastest source of money in the world. Buffet is buying their stock.
CSX is spending $1.5 to $2 billion/year on capital improvements. However, the Amtrak payments for use of the 3rd track will hardly cover the property tax payments for that improvement.
CSX is basically (IMHO) trading a 3rd of their ROW (CSX does not run pax service) for grade separation and occasional use (maintenance bypass) of that 3rd track.
The alternative is more lanes on I-95.
Railroads have long been the mode w/o subsidies. Trucks still do not pay for property taxes on their ROW (a MASSIVE subsidy for them) and pay nothing for using city streets.
And since this would help the nation develop a non-oil transportation system, I am in favor of it (and tolls for all Interstate highway users in lieu of property taxes, and paying for city streets w/gas taxes, not property & sales taxes).
Best Hopes for more rail and less rubber tires,
Alan
If you haven't played Railroad Tycoon, surely you have heard of it. The problem with running passengers on freight tracks is passenger want to get where they are going fast and do a lot of track damage. Freight is heavy and slow. There is fast freight like shipping lettuce to New England, but in general. They should dedicate one or two of those tracks to passengers and just sell it to Amtrak. Then Amtrak can maintain it anyway they want. Amtrak trains on leased rail eventually go no faster than freight trains because that's the grade of maintainance they get. Amtrak combines the cost of an airline ticket with the speed of at best highway travel. The only way Amtrak will make any sense is if Goebels is appointed head of the TSA. Oh wait...
The government has their gonads into everything. Truck pay taxes on diesel fuel unless they are burning home heating oil or deepfry. I haven't studied the tax ins and outs of trucking. What is ROW?
We are all paying for each other's tax subsidies just like we are all selling each other insurance and grooming each other's pets.
robert2734
ROW is right of way, the land that railroad tracks use to run their rails and also the land under highways. Because ROW is a real property interest, railroads pay taxes on it to states, schools and counties that they pass through.. Because public highways are owned by either the Feds or local departments of transportation, trucks don't pay any taxes to the jurisdictions that they pass through.
Alan is saying, and I agree, that this is an immense subsidy to the trucking industry. Yes they pay fuel taxes and license plate fees, but these aren't covering even the repair and maintainence in most states on the highways, the difference is made up by fuel taxes on the rest of us and income taxes. Bob Ebersole
Back in the telecom boom days, someone paid a railroad for the right to string a fiber optic cable along their track. After they spent their billion laying fiber, it was discovered the railroad didn't actually own the land. The railroad only had an easement on which to build track.
Back up to the 19th century. Railroads were granted a zillion acres of land in exchange for laying track. Lumber, coal, copper, silver, farm land ... everything found in the game Silverado. Now they are complaining they have to pay taxes on it.
Owning the land can be a revenue center as well. Run pipelines, fiber optics, microwave links, bicycle paths, lord knows what else along them.
Trucks may not pay taxes where they pass through but they are licensed somewhere. In the current environment, railroads are highly profitable. Buffet know it, I know it. I'm getting in on the game. Buffet is smarter than me; he has already pushed his chips to the center of the table.
>the difference is made up by fuel taxes on the rest of us and income taxes
You forgot to mention sales taxes. My county wants half a percent to build more roads. We don't need more roads here.
We can tax trucks heavier and then pay those dollars back when we go to the store. The money just passes through the truck companies.
We can tax trucks heavier and then pay those dollars back when we go to the store. The money just passes through the truck companies
Not if we ship by rail (perhaps truck "the last mile", but several grocery stores and one Walmart could be served by rail sidings in New Orleans).
Trucks, due to political deals, severely underpay taxes. I pay fuel taxes (for by 5 or 6 gallons/month) and rarely use Interstates or even state highways, just city streets ! So fuel taxes should pay for city streets, including the costs of traffic lights, policing them, etc.
I bought RR over a year before Warren Buffet, although not all the same ones as he (Bill Gates and I own a good % of CN, Bill a bit more than me :-)
Alan
We can`t ship more by rail until we get more rail. Capacity limitted. Only slowly does "fair taxes" on trucking help. By which time trucking is hosed by five dollar diesel anyways.
Rode the bullet to Kyoto. They say it is the fastest train in service. The French have a faster train but they only use it to set speed records.
I`m gonna buy some BNSF, a railroad Buff (and Alan) actually own. If my wife lets me but she allocated a pot of money for me to research.
RobertInKyoto
I haven`t escaped from reality. i have a daypass.
We can`t ship more by rail until we get more rail
US railroads are investing about $10 billion/year of capital investments.
Some notable investments,
A grade separated crossing for N-S over E-W tracks in Kansas City.
BN-SF almost finishing double tracking Los Angeles-Chicago
Union Pacific 3/4s finished double tracking Los Angeles-El Paso.
A $1.5 billion joint effort (including 3 flyover grade separations) to eliminate bottlenecks in Chicago is $300 million along.
We use about 22 million ties/month in the USA now. Most (AFAIK) are concrete which have long term advantages over wood.
I would also look at CN railroad.
Best Hopes,
Alan
Alan,
In my mind I often take a simplified look at capital investments in large infrastructure systems by comparing average annual investments with required replacement cycles. The key question is then do annual investments generate a cycle length greater than or less than the expected life of the asset.
Do you have any feeling for how this type of comparison might work out for our US rail system as a whole? Track, yards, bridges, rolling stock, . . .? Looks like your $10B number works out to just under $60,000/track mile.
Thanks
BCK
RR life is difficult to assess. Tunnels last several centuries, bridges more than 100 years. Modern control systems ?? (30 years ?), concrete ties 50+ years (early ones had some problems), 40 years for rolling stock, but many work past that.
Single customer spurs shut down when the customer goes away, BUT mainline capacity is definitely going up, and deferred maintenance going down.
Hope that helps,
Alan
robert2734 sure RailRoads were given their right of way in exchange for building the RR, as well as about 1/2 of the settled land west of the Mississippi. And they've paid taxes on these lands ever since, about 120 years worth.
Meanwhile, truck's pay nothing to the counties, cities and towns through which they drive.There's nothing right or wrong in this, all Alan and I are saying is even up the tax burdens.You could do the same thing by dropping ad valorem taxes on real estate for RR, our schools, counties ect have to get the money from you and I if they do that, which I am opposed to on my highest principles. I'm not opposed to high taxes, I just want you to pay them not me, which is the 100% American point of view.
If all the trucks driving in your county were there all the time and paid that 1/2 cent sales tax, then it would be fair. But I'd bet that the Walmart truck drivers don't live there, so you are subsidising them with your sales tax, as well as all the other out of county drivers. And make no mistake, heavy vehicles are what tears up your roads. I hope your county commissioners at least got a good bribe for this, I'd hate to think they are just stupid. Bob Ebersole
The RRs also had to carry US Gov't freight at a severe discount as part of the deal.
During WW II, this discount (according to RR accounting) was equal to the original value of the land plus interest in just those 4 years (everything and everybody went by rail since gas & diesel were needed for the war effort, back to the future ?).
They lobbied Congress and the discount was repealed in the 1950s.
Alan
One third of allied bomber tonnage was dropped on transportation targets. Did the German railroads present Hitler with a bill? Tell the RRs they were lucky. They serviced the side with the biggest air force.
RobertInKyoto
I haven`t escaped from reality. i have a daypass.
The county commissioners get a pot of play money to turn the county into their personal sandbox. That's what they live for. Nothing so tacky as bribes. A chance to leave your mark on the county. But not in a good way.
I tend to agree with you regarding cross-country Amtrak (except those cannot fly for medical reasons or chose not to fly for several reasons).
However, for trips of 300 miles and less with decent service, passenger rail makes lots of sense. And many smaller towns with minimal or no air service can get rail service. (300 to 500 is more marginal but rail will get a % of the market).
This is especially true of cities with good Urban Rail service. Getting to the rail station is almost always easier and faster than getting to the airport.
BTW: CSX will *NOT* sell 1/3rd their ROW ! That is the crown jewel of the RR ! And an operational nightmare forever to have Amtrak owning one track and CSX two tracks side-by-side.
CSX did sell the last 76 miles of the ROW into Miami to the State of Florida (back when RRs were shrinking), but they kept trackage rights and Florida added a second track. Today, they probably regret that sale though despite the benefits (no property taxes and a second free & high quality track; they want to run more trains and FDOT is creating problems).
Best Hopes,
Alan
They won't sell their ROW at market price but they'll whine about paying property taxes on it. Whatever.
All towns have air service if you got a pilot's license and a million bucks for a cessna. Mini-jets are approaching a million bucks.
Amtrak doesn't make sense for 300 mile trips when they are slower and more expensive than cars. Amtrak has to be faster, better, cheaper than cars or they are a jobs program.
Amtrak has to be faster OR better OR cheaper than driving to get a decent market share.
Note that the cheaper adjusts with the price of oil.
Philadelphia-Boston is about 300 miles. I could not understand why anyone would drive or fly from Philly to Boston.
Alan
Have you ever taken Amtrak from Philadephia to Boston? Next time you'll fly or drive. The Northeast corridor may be the one piece of Amtrak that pays it way. You are right, but Amtrak isn't any of those three right now.
Alan, trucking is totally f--ked by peak oil. You can afford to be gracious in victory.
Gates and Buffet probably decided to control the railroads over the bridge table. "Three no trump. So what industry do you think we should take over next? Your lead."
Railroad Tycoon, one of the best game ever!
The point is that if demand were to fall faster than supply, then oil (and other fossil fuel) prices would drop. Furthermore, that drop would likely be large, since energy demand is very inelastic in the short term. Therefore, alternatives would become uneconomic again (if they are economic now). Therefore, anyone investing in them would lose their shirt. In an atmosphere of general pessimism, investment collapses anyway (almost completely during the great depression).
I do agree with you that public sector investment should and likely would increase in that scenario (deficits as far as the eye can see).
I don't believe that for a second. Where would they get the money for that increase? As housing prices fall, and in many counties they already have by 10-20%, so do property taxes. A credit crunch will lead to increasing unemployment, more tax drains. Many levels of government will be severely strapped for money to even do basic investments, or mere maintenance.
So where would the money come from for that public sector investment increase? Even if printing presses speed up, it would first be to just stand still in financial terms. And the US dollar would keep tanking, something that can't go on indefinitely either.
The printing press will soon be folded up and stashed in the attic, it's been overheated for a decade. It'll soon explode if it doesn't get some rest.
A true credit crunch at this point in time in the US would mean the evaporation of trillions of dollars, not some kind of shift to other investments. Residential real estate "values" alone could lose $4-8 trillion, and since they were used to securitize at least ten times that "value", well, the math is easy. It will simply disappear.
Assertions of a healthy economy with lots of consumer confidence are just very silly. It's all been borrowed and leveraged. The only confidence that we see comes from people who have no idea what's going on. "Living in the hologram".
Well, that is about to change. The new reality for everyone lies in this: Fannie Mae to skip August debt offering. Fannie is the "only game left in town" for mortgage lending and securitizing. And even they don't want it.
Thanks for that link!
Can you indicate what is the basis for your estimates of "$4-8 trillion" and "at least ten times".
Here's a few relevant links to quantify the market's debts, risks, and future prospects
Mike Shedlock putting some numbers on who's holding the bag
http://globaleconomicanalysis.blogspot.com/2007/07/whos-holding-bag.html
ARM monthly reset chart, ongoing onslaught, peaking in March 2008 at 110USD billions.
http://www.dailykos.com/storyonly/2007/8/16/132353/154
Video of Peter Schiff, putting his money where his mouth is
http://www.europac.net/Schiff-CNBC-8-9-07_lg.asp
Further analysis is to be found here
http://market-ticker.denninger.net/2007/08/where-weve-ben-and-where-were...
http://market-ticker.denninger.net/2007/08/road-forward-and-big-picture-...
and for online financial discussion of sinking vessels such as Country Wide and other breaking news
http://www.tickerforum.org/cgi-ticker/akcs-www?post=4287
Records
Stuart,
Not much time, and so many files, but here's a quick first indication:
The $4-$8 trillion estimate is a low one, I think, considering the Fed numbers below. There doesn't seem to be much indication that prices will not fall back to the trendline (and then some). In other words, they have about doubled in 7 years, and will fall down by at least as much, and in all likelihood faster and more furious. I don't see any other possibility than for US housing prices to drop by 50-60%. If you look up real estate bubble at Wikipedia, you'll probably be shocked at the number of other countries that suffer from the same. England, Spain, Australia are about to be hit very hard.
The losses resulting from this will be at the very least ten times more, because the mortgage securitization instruments were used as leverage for ever more loans and securities. Enter the derivatives market.
Ten times is a very low estimate. When a hedge fund buys an MBS/CDO from a bank, it will (or, would) take that as collateral to the next bank to borrow ten times as much to buy more CDO's. The bank will use the fund's loan as collateral for.... etc etc. Works like a charm as long as there's growth.
Yes, that is Ponzi. He died in absolute misery, by the way.
For a decent review of derivatives and leverage:
PS: As Mish stated the other day, the very probable bankruptcy at Countrywide comes when only 1.04% of their mortgages are in delinquency. Now, that is leverage.
Well, you look at some of the numbers quoted above and you quickly understand why some folks would want to claim that this problem is "contained." Because if it is not "contained" the negative leverage is going to blow a huge hole in the world economy. But we can always blame that on Bin Laden and the Taliban.
Study the figures above and you also understand why it is that the American way of life is "not-negotiable." It is "not-negotiable" in exactly the same way that Countrywide's toxic paper is not negotiable. It may take four years or longer for all of this to play, out but I think we are looking at the end of the American empire
While I agree with most of your conclusions, IMO property taxes on housing will not fall for some time. Never in some places.
Take CA, most $1m houses are assessed at aprox 200K due to prop 13, while the price will fall quite a bit, perhaps as much as 50% it isn't likely to fall 80% in desirable locations.
Housing is way under assessed in most places.
Of course the flippers and late comers are dead meat and there will be some loss from them, but point is it isn't across the board, and cities / counties had seen huge temporary increases when long term owners sold to take advantage of capital gains tax exemptions on primary residential housing. It just reverts to what it used to be.
The big revenue loss will come from sales taxes, locally this has been observable in a 10% drop over the last year, and property taxes on items such as new vehicles, boats, etc.
The less polite way of putting it would be demand is manipulated in order to eliminate alternative energy competition to oil interests. The goals of big money in suppressing valuations in order to buy back later for cheap temporarily coincide with a desire by oil interests to eliminate competing energy suppliers.
Anyway, you might be interested in some Alternate Data Series from http://www.shadowstats.com/
Reduced investment in drilling for natural gas will shortly (3 years ?) result in demand again equaling reduced supply. The Red Queen takes a breather.
Demand for electricity is also fairly inelastic.
A bridge subsidy (also the 15% or 20% mandate for renewables) could keep the wind turbines growing during that interim period.
And for the same reasons that Public Works will be encouraged, private investment of certain types would be as well. There is enough freight being trucked today that, even at Great Depression levels, railroad freight could grow off of a shift5 from truck to rail. And there are a variety of ways to induce that shift.
Best Hopes,
Alan
Stuart Staniford said: "if demand were to fall faster than supply, then oil (and other fossil fuel) prices would drop. Furthermore, that drop would likely be large, since energy demand is very inelastic in the short term."
I'd take the other side of this contention. I think the reason oil is relatively price inelastic is mainly because demand can't fall that much. Jim Hamilton has some good work on this, and as we see around us, demand hasn't fallen even as oil prices have doubled and tripled.
Further, the only politically viable policy option to a deflationary credit crisis is to do what the Fed is doing in terms of monetary policy, that is, some balance between letting those who took risks pay for them, and providing liquidity to those who are being hurt, but who weren't taking undue risk (for example, residential borrowers with good credit who are seeking to borrow now and having a terrible time because banks can't get the liquidity either, hence the discount rate adjustment and the new borrowing terms).
This bubble was a credit bubble generated by new derivatives, leverage, and poor oversight, not a monetary bubble per se. But some of the "solutions" may be monetary in nature, and hence inflationary. This would tend to push the price of oil up, not down, especially against the USD, which was already losing the confidence of its supporters, as discussion becomes more commonplace among foreign central banks about placing reserves elsewhere.
However, all that said, I do agree with you that the lower the oil price goes, the less likely we are to deal with the Peak Oil problem.
Did you buy RR stock?
If the railroads cannot compete with trucking then they should fold. There was already a weight tax on trucks. If truckers cannot compete against the RR then the truckers might fold.
Some of the old rail routes were torn up and converted to bike trails. Some of the railroads had bottlenecks with existing infrastructure and cannot handle all the trucking load, and trucks don't carry coal long distance.
I have an appointment with my broker and a few dollars to play with and my wife wanted me to research some "green stocks". I'd rather buy a railroad then try to pick winners and losers in the emerging alternate energy market. Twenty five bucks in my pocket everytime someone takes a ride on the Reading.
Just add a 50 cents/mile toll for trucks on Interstates & US Highways, a fuel tax to pay for all city streets and call it a free and fair competition.
May the Best Mode Win,
Alan
Ditto to what Alan says. AT least 50c. Rd. damage increases geometrically with weight, therefore trucks produce more or less all of the road damage,while only paying for some of it. Trucking would already be much less competitive if they paid their fair share. THese arrangemets were all muscled through by the Teamsters in the late 50's-early 60's.
Matt
Not some, but most.
as i type this there are companies that go out, tear up old rail lines and then sell/use the new scrap rail ties to make things such as those metal fence posts.
take a snap shot of all in place rail lines today, and by tomorrow it will be inaccurate because several lines would cease to exist.
From The Nation in Jan 2006 "Green Power":
That sounds like a preferred method; I wonder how well it has been working and if the Germans are following through?
cfm in Gray, ME
We did Merkel a favor. There is no pre 1945 German housing.
RobertInKyoto
I haven`t escaped from reality. i have a daypass.
If the U.S. tanks that is more oil left over for BRIC economies. China seems to be the leader in alternative energy research anyway. It is the third largest economy in the world after U.S. and Germany, possibly bigger if you consider purchasing power parity. The old saying if the U.S. sneezes the world gets a cold isn’t really true anymore in terms of growth, but that is actual productive activities, who knows what will happen as the world system has been poisoned with toxic financial derivatives. Possible the Dow will be booming next year even as average U.S. citizens are “re-priced” into serfs. I blame those behind the Federal Reserves multiple serial bubbles policy for bringing us to this point.
Japan is the world's second largest economy. $4.2 trillion GNP vs. $2.6 trillion for Germany at PPP.
Rob: China is 2.5X the size of Japan at PPP.
Integers aren`t a lattice group. That still doesn`t make China third biggest economy after Germany. I disproved what I came to disprove.
RobertInKyoto
I haven`t escaped from reality. i have a daypass.
You know what? I bet the next dot-com will be alternate energy. A lot of people will lose their shorts and a lot of stuff will get built that makes no economic sense, but a lot of stuff will get built.
Question for Jerome or anyone who knows more about banking than me which is anybody. Why has the spread between prime conforming and prime nonconforming widenned from almost nothing to half a percent in the last two months? Either Fanny Mae is taking risks they are not paid to take or they took risks they weren't paid to take. Or they are the only ones with liquidity. Fanny has access to the Fed so they can print money but so do all the Big Banks. Is Fanny a good short?
This is not the first time I've heard someone suggest the next big bubble will be alternate energy. We're certainly seeing it here in Iowa - sensible wind turbines stand over fields of corn nonsensically destined for ethanol production.
I picked my name on the basis that ethanol was a sacred cow here in need of tipping, but before I could gather my thoughts the rest of the world made a big ol' anti corn ethanol dogpile.
If we only had a sensible feedstock here in Iowa ... and a salvage plan for this corn ethanol production equipment.
Can an ethanol plant be used/converted for any other function?
Vodka production
Best Hopes for SOMETHING to trade to the Russians,
Alan
I would take some of this
http://www.glaciervodka.com/
Good stuff.
Yes and in fact the goal of the DOE is to expand upon the exisiting corn-ethanol infrastructure via the addition of 2nd gen (cellulosic) and 3rd gen (gasification) ETOH production paths.
This is the integrated biorefinery construct as envisioned by NREL who seek to take advantage of the complimentary nature of the above 3 processes.
Vision and implementation, however, are altogether different things as evidenced by the fact that the $ amount of the U.S. budget allocated to NREL's plan is but a pittance compared to the $ amount allocated to the DOD.
So its possible and the problem is political rather than technical. I'll make some noise about this over on DailyKos, but I'm dumb as a stump. Where can I get educated on the process and economics of this stuff?
Join the crowd, but I'm really fascinated by the posts!
You are probably right about the need for a salvage plan for corn-based ethanol plants. There are good reasons to expect that biofuel production facilities will look much like existing pulp mills. The pulp/paper industry has already tackled many of the issues - siting, crop production, harvesting, handling massive amounts of bulk materials, processing, refining, efficient use of derivative products, etc. Some of the newest paper production facilities generate virtually all of their power from pulp by-products. Naturally the paper output itself represents a lot of additional embodied energy.
Hans Noeldner
"Civilization is the presence of enlightened self-restraint"
I'm wondering if sweet sorghum wouldn't be a better feedstock. It can be grown anywhere that corn (maize) can. While I've seen very little about it, I am guessing that the EROI would be intermediate between corn and sugar cane -- maybe around 3-4. That is certainly a lot better than corn ethanol. Still not the answer to all of our problems, but if we are going to have a government-subsidized boondoggle, it ought to at least have a positive EROI.
The existing ethanol plants would need some retrofits, of course. The sorghum canes need to be runt though a press to extract the juice, and then the juice first boiled down (or maybe run through a reverse osmosis unit) to produce a syrup that can then be fermented. The biggest problem is that sorghum does not store like corn, and the entire crop must be processed quickly. I don't know if the economics would work out for that.
Bingo! Time to get on this roller-coaster before it goes down. From todays Drumbeat:
Sure they do!
I'd bet on carbon credits, because that encompasses alternate energy AND traditional energy, because it is a brand spanking new market with room for growth (and manipulation), because it is new means it is poorly overseen for the moment, and because each successive bubble has had to have been bigger than the last. Alternative energy cannot get that big that fast but carbon credits easily can.
"The greatest shortcoming of the human race is our inability to understand the exponential function." -- Dr. Albert Bartlett
Into the Grey Zone
If we don't manage to decouple VMT and employment we're screwed. But what are the chances? Thanks to steady increases in productivity (i.e. more products/services per man-hour of labor) the United States has NEVER managed to maintain employment without increasing resource consumption. Never.
Outsourcing has made our economy far worse - the ocean of Chinese imports does not generate many US jobs for sales clerks and WalMart greeters per unit of energy consumed. All the blather about our GDP being far less energy dependent is utter hogwash - we've merely outsourced most of our manufacturing-level resource consumption (and pollution) to China. Happy happy!
No wonder politicians are loath to promote thrift.
The growth paradigm itself is the problem - the machine cannot stop until it has eaten itself, until it perishes in its own excrement. Our fossil-fueled economies comprise a globe-spanning carrion-eater, the largest scavenger that has ever occupied Earth. The demise of this scavenger is likely to be spectacular.
Maybe the Biblical proscription against interest wasn't such a foolish notion after all. And what would happen if we-the-people decided that decent, honorable, resource-thrifty employment for our fellow citizens was more important than the cheapest salad shooter at Target?
To those who scoff at this I point to the Amish. While they have their unsustainability problems (population growth), their society ensures that no one is useless. Moreover, they don't suffer fat spoiled children, nor does their culture generate teenagers hell-bent on burning up our eardrums along with the climate as they cruise mindlessly up and down the road in thumping fossil-fueled exoskeletons.
Hans Noeldner
"Civilization is the presence of enlightened self-restraint"
nor does their culture generate teenagers hell-bent on burning up our eardrums along with the climate as they cruise mindlessly up and down the road in thumping fossil-fueled exoskeletons.
Ahhh but they do!
http://www.allmovie.com/cg/avg.dll?p=avg&sql=1:260314~T1
Its a lot deeper then one thinks when it comes to interactions of the Amish and us moderns.
Let's pull a quote from Stuart's excellent analysis:
Let's assume for a moment that both of these are true:
1) A recession will occur and oil demand will be reduced
2) PO and exporting nations' own consumption will reduce oil supply
Unless you can quantitatively compare the effects of 1 and 2 with a high confidence, I wouldn't jump to this conclusion quite yet. However, you have definitely thrown at me the possibility that my long position on crude might not go as well as I expect. I bought out-of-the-money options, so they are very leveraged on the upside with little to lose on the downside =)
Perhaps the wisest position is gold. After all, 1 or 2 or both could happen and it would do well. Correct me if I'm wrong; my econ is rusty.
A.J.Wald
I agree - hence all the caveats in my piece. At this point, it's a hypothesis I'm worrying about, not a position I'm confident of.
For me it is inconceivable that such a big roll over as peak oil won´t come without lots of vicious volatility. There is an obvious cross connect to the financial world. The whole concept of credit, (real)interest and repayment requires (real) growth. In the face of a resource constraint plateauing like oil input real growth is limited with the rate of energy efficiency improvements.
A side from a few years after the German reunion, where in east germany the energy gobbling and money loosing steel and other heavy industries were essentially shut down, the best Germany ever managed was about 0,9% energy efficiency increase per year (real GDP/BTU).
So with rather miniscule efficiency gains possible in the "real" economy, a financial bubble might be a logical consequence of easy & cheap credit. Overvalued suburbs built with overvalued mortgages which are refinanced and leveraged with asset backed securities might be the ultimate bubble.
One site I know was fitting charts of 1929 and 1987 on the recent stock market last week. History repeats itself, only different; so not all that useful I think. Which way do we go boss? Correction or contraction? One rule of thumb if it is safe to buy in the market again is to wait for one or more 90% up days –gainers as a percentage of up plus down volume.
Doug Noland’s http://www.prudentbear.com/index.php?option=com_content&view=frontpage&I... "> Credit Bubble Bulletin has talked often how money in the finance sector has become evermore divorced from the real world of production. Who knows, equities may again be booming next year while the average person is screwed into the ground. They may well not be driving as much and main street GDP could be falling at the same time. The conclusion of Jim Sinclair’s http://www.jsmineset.com/home.asp?RQ=EDL,1&sPID=4&linkid=3806 "> Formula might not be preventable.
In a recession, bling demand is likely reduced as well, working against gold. There is also the notion that, as a declining share of the population belongs to generations raised to believe gold holds some ‘magical’ properties as a value store, its price will drop. After all, in terms of the quantity of the stuff having any actual use at today’s prices, it has been vastly overproduced. The only thing propping it up is belief somebody else will take it in trade at some future time.
If SreallyHTF, and no govt is any longer able to maintain enough confidence in paper money for people to use it as currency (IMO unlikely, but….), gold might (for a while, until private issuers of more convenient currency gain trust) return to its position as the most currency like (easiest to transport, most stable, easiest to value/verify in trade etc.) of commodities, but that would require a real Mad Max like world.
Norwegian treasuries, if you can get them, are likely fairly solid in the short/medium term. Norway has stashed away quite a bit of oil revenue over the years, in supposedly ‘safe’ investments. They have enough oil and gas left to have minimal negative exposure to PO, as well as plenty of hydro power. In addition, they are tucked away in a relatively calm corner of the world. One risk factor is devaluation, if the government tries to keep non oil/gas industry costs competitive to avoid unemployment.
As prep for more severe falls off cliffs, guns and ammo tends to rise in relative value as stability declines. Nothing beats a cache of AKs in Mogadishu.
I'm amazed by your fussing so much about the prospect of the US experiencing a recession. Because, since imminent (or past) peak and subsequent relentless decline in oil and gas production is a given, and since GDP growth is inextricably tied (to a different degree in each country) to growth in energy usage, relentless (US & global) GDP decline after PO is then a given. What's the issue of its starting one or two years before?
Being a mild such fan, I agree with the first proposition (the expansion of credit due to recent Fed (+ECB) easing has fueled the debt boom) but not with the second. The contraction is not inevitable out of financial/monetary reasons IF the Fed+ECB are willing to print enough USD+EUR. "Enough" here may mean such a lot as to make those currencies end up looking like confederate money. Also, I emphasize ECB & EUR because an even worse setup is brewing the other side of the Atlantic. The contraction IS inevitable out of PO.
Private investment today includes also lots of things of a scale orders of magnitude greater than those above which not only waste fossil fuels but also leave society in a state of ever greater vulnerability to the unavoidable coming energy decline. Just think suburban and exurban construction.
Conversely, I hypothesize that the latest worsening of fuel economy is due to higher income consumers buying mighty SUVs. If I'm correct, then it's a safe bet that average fuel economy of the fleet would stop degrading as fewer people bought SUVs.
Thanks Beach Boy,
for the basics,
re: "The contraction IS inevitable out of PO."
That was kinda my conclusion. So, my question is: can the contraction be minimized or mitigated or the situation helped?
If so, how? What are you thoughts?
re: "Private investment today includes also lots of things of a scale orders of magnitude greater than those above which not only waste fossil fuels but also leave society in a state of ever greater vulnerability to the unavoidable coming energy decline. Just think suburban and exurban construction."
Good point.
I was just trying think of how to articulate it.
In other words, a concern for sufficient capital for conversion to "alternative energies" (of the kind we assume to be the right kind) presumes that the holders of that capital will make the right decisions, even given the "right" circumstances.
So, it looks like we have several problems.
As an example, take energy sources and energy "production" technologies:
1) What "alternatives" are the best? And in conjunction with what other aspects of mitigation?
2) Who needs to be convinced to do what? What tax/regulatory or other policies need to be in place to encourage so-called "private"/corporate capital to be invested in renewables? (In other words, how to answer the "market will take care of it argument", which appears to be - ? - what Stuart is assuming - (or hoping?). (Please correct me if I'm mistaken.)
In other words, what are those "right" circumstances?
3) How does the multinational corporate entity (and its connection - and/or lack thereof - to regulation, tax and other policies) respond to attempts to steer "its" decisions?
4) What about consumer-driven outcomes, or do these really exist?
re: "Conversely, I hypothesize that the latest worsening of fuel economy is due to higher income consumers buying mighty SUVs."
This seems like something that some quantification could answer, one way or the other. Though, if we assume a widening "rich/poor" gap, it seems hard to predict just how the "really rich" are going to spend.
And, I don't know, from my naive point of view, anything that isn't directed toward the obvious (TOD, a renewable grid and/or distributed energy, ag conversion to organic, etc.)(big etc.) is also an unfortunate waste of the FF resources we still have.
Aniya, I think the responses to your questions have for the most part already been laid out by other much better qualified contributors at TOD, particularly the key ones: "can the contraction be minimized or mitigated or the situation helped?" and 1) about the alternatives.
My own contribution to the topic of alternatives has been trying to raise awareness that, since biodiesel production from soy/sunflower/rapeseed is a net energy gainer (conversely to corn ethanol), it is very likely that an increasingly larger part of world agriculture will be diverted to biodiesel production. I repost that concept at the end in case you didn't see it, and because it reinforces the view that slowing home construction (at least in their present kind) is GOOD.
As for question 2), the ideal case is that all market players should be aware of Hubbert's Peak for fossil fuels and phosphorus, Peak Grains as explained below (which does not even take into account diminishing yields), and Peak Fish, which together make up Peak Food. Having said that, I don't hold much hope for that to happen.
Apart for that, questions 2 and 3) are far beyond my competence!
Your last remark is quite right. I would add that, with the current way resources are being devoted to home construction, the waste is not just unfortunate but outright dangerous, if you take into account that:
- US-wide, the large majority of houses being built follow the suburban and exurban patterns, demanding long-range commuting for their owners for everything, and are oversized and energy-inefficient on top of that. In a world with declining fossil fuels production, they will be just TRAPS.
- on top of that, a lot of the construction is taking place in naturally unlivable places like Las Vegas where very high levels of electrical power consumption per capita are required for air-conditioning just for survival, thus straining the grid. This is critical because grid collapse would bring about societal order collapse.
So, tight credit conditions forcing a stop in home construction in their present form should be viewed as a painful medicine, until a PO-aware president appoints Matt Simmons as Secretary of Energy and James Kunstler as Secretary of Housing and Urban Development ;-)
*** from previous posts
- Once significant biodiesel production capacity has been built, land arbitraging based on farmers' profits per acre will drive the allocation of land to biodiesel crops (soybean, sunflower and rapeseed, SSR for short) or to grain crops.
- From that moment onward, fuel arbitraging will make the price of diesel fuel (however high it goes) set the floor for the price of SSR oils. Land arbitraging in turn will set the floor for the price of wheat and corn.
- There is a food Export Land Model, where food exports will be falling not because rising internal consumption, but because of ever increasing feedstock and land diversion into biofuels production.
- Poor food importing countries, and poor people in general, will be priced out of food.
- The world is NOW at Peak Grains.
- Demographic scenarios of 9 billion people don't stand a chance.
- To minimize future (next decade?) starvation, people should be encouraged to:
Stop building, particularly suburban houses that imply a loss of farmland.
Stop procreating at higher than the replacement rate.
A factor in fueling the housing bubble in addition to low interest rates has been the losses incurred from the last bubble, the Dot.com fleecing. Many investors that lost substantial savings in the collapse vowed to stay away from the market and invest their earnings in something more solid, less risky – a home. Unfortunately this tendency was reinforced by the low interest rates provided by the Federal Reserve. How many times have we heard that the price of housing always increases, but now those that have invested in houses at greatly inflated valuations will see their bubble pop again. However, instead of paying relatively quickly as they did with the Dot.com crash, this time they will be on the hook for 15, 20, or 30 years. It is unlikely that there will be steady growth in home valuations for the foreseeable future. With falling real wages and inflation in energy, food and medical care that will undoubtedly be stratospheric, most family income will be depleted long before the mortgage payment finds its way to those holding the depreciating financial assets.
Our game of musical chairs has been able to add chairs to the game for many years and pay tribute to those who put their stash in play. Some players have hundreds of chairs and some don’t have any at all. The players with many chairs will only lend one to those without a chair if they can be resourceful and not only build themselves a chair with the proceeds but pay back two chairs to the original lender as part of the deal. What happens when those with hundreds of chairs won’t lend any money to those without chairs because there’s no way they can pay it back when energy is declining? Will those without chairs tolerate the ones hoarding hundreds of unoccupied chairs? Currently, some of those that have lent their extra chairs will not be getting them back. Many of those that had hoped to build a chair for themselves will find that a couple of missed payments will result in the lender calling their loan and possibly taking some collateral too.
As wealth (energy) becomes scarce the remaining wealth will become that much more valuable and its owners will be much more circumspect when they lend. Those that can use resources and energy to unlock even more resources and energy will do very well. Those that borrow and lend for consumption (including maladapted housing) will find the foundation upon which their chair is built is made of sand.
jbunt
stuart - good article, but do not panic. In the 1980's, the US wrote off $500 billion from the savings & loan debacle (that would be at least $1 trillion in today's $'s). Assume that we have $5 trillion of troubled mortgages and that it is 50% worthless. Loss of $2.5 trillion. But, 50% of that is foreign held ( unlike the S&L crisis). So, US has to absorb a $1.25 trillion loss. Per capita, and $ adjusted, less than the S&L crisis. And, the economy actually boomed during that period (the mess was being fixed). The few people who absolutely HAVE to change houses will be more affected. But, the rest of us will not.
I’m guessing (I never got past economics 101) that half the funds being foreign held won't be as much as a benefit as you suspect in that this might torpedo any confidence by other countries to underwrite our debt.
What's bothering me was put much better by Krugman in his Op-Ed today:
To a large extent that's what's bothering me too. The psychology of markets is a very interesting phenomenon and is given to generating self-fulfilling prophecies in spirals of positive feedback. It does so on the way up and on the way down, but the way down is more abrupt as it's driven by fear and that's a much sharper emotion than the greed that drives the upswing.
Once the psychology of the market has shifted, events are interpreted through a radically different filter, and that changes people's collective reaction dramatically.
Great post by the way.
Fear is sharper because it's geared to survival, because that's the most important thing of all, because you can't do anything if you're dead.
"This isn't altogether good news. Historically, there's a decent correlation between changes in US miles travelled and overall economic growth:"
I got stuck on this bit...why is the growth of the U.S. economy "good news?"
Well, that's a whole other bag of worms, but I just meant in the narrow sense the recessions tend to be painful (people thrown out of work etc).
Comparatively speaking, a bag of worms is a good thing. We're going to have to start watching our metaphors!
cfm, wanting more worms in the garden.
Because it means growth in the ‘economy’ of more US individuals than a decline does. Since it’s very easy for individuals to achieve the reverse, yet they universally choose not to, one can conclude most/all individuals consider growth good.
I see this is a very real possibility - and why I don't see "peak oil" as a one way bet on high oil prices. The economy (demand) is more dynamic than the geology (supply). A small supply reduction due to geology could negatively impact the economy and create a disproportionately large reduction in demand, depressing prices just when the energy industry would need high prices. Of course reduced oil supply isn’t the only potential negative impact on the economy and the unrelated "credit crunch" might be just as effective.
With a depressed economy, depressed demand and reduced price there won't be the capital in the energy industries to build the necessary infrastructure for the post-peak. Worrying indeed.
Just remember, that price will provide NO warning:
http://biz.yahoo.com/ap/070820/oil_prices.html?.v=22
It didn't in 1970, and it won't this time.
RC
Fine bit of analysis.
The extraction of the smoothed signal from the monthly miles travelled graph is impressive. You would almost think that FHA would report it as yearly data, but I suppose then the trends would be a bit too obvious. And perhaps it would spook too many people?
Bingo! Federal agencies are not necessarily trying to report the entire truth anymore. Rather, they are trying to sustain consumer confidence. This is why people like Dr. James Hansen get muzzled - because their statements might scare people. And it's even worse with core economic data because, as Stuart and others have noted, the economy is almost entirely a self-fulfilling psychological prophecy. Any piece of bad news can set things off in a direction downward while any piece of good news can push upwards and you just never know which way the herd will run today.
"The greatest shortcoming of the human race is our inability to understand the exponential function." -- Dr. Albert Bartlett
Into the Grey Zone
I think we have the makings of a burgeoning analysis "clean-up" industry. People like Stuart can nose around in recent government reports and figure out where we are getting snowed, and publish the real underlying trends.
This is probably very true and a business opportunity for someone with extensive statistics background. John Williams does this for corporations on some sets of statistics but others could do the same. It's a big world out there. And you don't have to accuse the government of lying. Just call it a value added service. ;)
"The greatest shortcoming of the human race is our inability to understand the exponential function." -- Dr. Albert Bartlett
Into the Grey Zone
You could start with Defrauding America.
It's getting harder and harder to keep up with you guys!
The first chart is one of the best. It illustrates another writer who peaked around the time of Hubbert: Harvey OConnor. The book? "Empire of Oil".
If you extrapolate the amount of power held in the oil lobby and the dependency of the economy on oil in 1958 (when the book was written, I think) to now, I'm sure the chart of GDP vs. Fuel economy will come into focus, as will the real estate, roads, and bridge failures.
It's all about the oil money. No matter how you slice the data, the growth of our economy into the behemoth that it is was due entirely to cheap oil. The green revolution of farms, the interstate highways, the airlines, the sky scrapers, the Cold War, the Vietnam war, Iran Contra, Nicaragua, Iraq. We cannot separate the Empire from the oil (the drugs and drug money are just a Vanity thing). If the oil fades, so goes the Empire as we know it. The sad thing is that the PTB won't acknowledge the existence of the Empire so it can be lauded before it's gone.
Things to make you go, "huh".
The notion that big troubles in the U.S. economy would ratchet down oil demand sounds sensible to me. But it's flying in the face of history. At the start of the 1970s, oil was selling for $1.80 a bbl and the U.S. was coming off a pretty nice decade of economic health. Then we entered not one, but two recessions that make our most recent one look like a picnic. By the end of the decade, the survivalist movement was in full bloom and we felt that 20% interest rates and 12% inflation were ushering in the end of the world. Oil had gone from $1.80 to $18 a bbl. Reagan invented the "misery index" in the 1980 election campaigne. Even Ralph, your average town mayor, could have defeated Carter in that race. So how much oil demand was destroyed by these developments? None! Simmons points this out in "Twilight" p58-59 noting that, despite the accepted wisdom that high oil during this time damaged the economy and produced a steep drop in oil demand, it actually increased by 44% during this 1000% price climb. That's a compounded annual rate of global oil demand climb around 4% compared to the 2% rate we're struggling with now in our relatively rosy world. Also consider that back then, we had Saudi Arabia's considerable excess capacity to try to put out the demand fires. They opened the throttle all the way to reservoir damaging levels to the extent that it precipitated two sets of U.S. Congressional hearings in 1974 and 1979 on the overproduction by Aramco (still controlled then by the American oil companies). The question of permanent production damage was reviewed in their response to this huge tide of demand! Now we have no throttle to deal with demand surges. This supply/demand picture was all back when the world would get the flu if the U.S. sneezed. Now oil demand is vastly more controlled by the BRIC nations who aren't shooting themselves in the leg with bad energy policy and bad mortgage policy. The world economy is much more robust in this era and so much less U.S. centric that we could get the flu and BRIC wouldn't even bother to sneeze. "Just let us have your unused oil, please" they may say.
The point is that those seventies oil shocks were caused by oil shocks (the Arab embargo in 73, and the Iranian revolution and Iran/Iraq war in 79 on). But here we have a (so far very mild) oil shock from the plateau and a credit crunch, money-market debacle of hard-to-estimate proportions. If the credit problems turn out to be deeper and bigger than the oil supply problems (in the short term) then oil prices will go down.
In the long term, of course, peak oil has to be the more important factor.
Alan may be able to validate this but I suspect the reason for the growth in oil consumption was due to a move away from rail transport to truck transport. The key driver of this switch would have been the cost of financing rolling inventory during a period when the rails were expensive and extremely inefficent
The main shock was the second one in 79. Global oil demand didn't reach the 79 level again until the early 1990s:
Stuart - an excellent article, and one that highlights the possibility that we may indeed see oil below $40. I have always felt queezy about comments such as 'oil will never see $40 again'. Given a big enough global recession and you would probably see prices below that. Thats why I have always steered clear of forward oil instruments - there is for example absolutely no guarantee that in 2010 oil will be above $70 (sure if demand stayed along the path that it has for the last few years it would but hell if demand contracted sharply it sure as hell would not).
The continued strain imposed by the re-setting of teaser mortgages goes all the way through to March 2008 and beyond. This will impose a constant drain on the health of financial stocks etc. No matter what the Fed does short term we KNOW these teaser mortagages are about there, whole chunks re-setting month after month, eash succeeding tranche imposing a bigger and bigger drag.
I think Stuart's right as far as the theory goes, but in reality, I just can't imagine a scenario where the Fed would allow this to happen. They've been going on in statement after statement about tame core inflation (yes, with mild risk to the upside), and certainly they'd see the deflationary prospects of a major credit collapse as more than enough to offset any inflationary aspect of monetary expansion. Indeed, the very thing Bernanke is most famous for is pronouncing we need never allow deflation again.
So any Fed move to offset these problems would push up oil prices both because of monetary inflation and dollar depreciation.
Plus, the situation is enormously complicated by the fact that oil demand seems so far to be pretty unresponsive to price, there are few viable energy alternatives, and China is booming and sitting on top of over a trillion dollars (inflationary again - buying commodities is certainly on their agenda), with the debt therefor residing with the US. And we all know that the easiest way for govts. to deal with crippling debt is to inflate it away.
I find it very hard to believe the Fed and policy makers will make us take our medicine and not liquidate (read, inflate) this problem away.
I think OPEC has a lot to say about Oil prices both via the cartel and via financial means. China is not the only one that can do some serious dollar dumping and OPEC dumping could easily force China to dump.
As the reserve currency I think that the Fed has less control over the dollar then they like to admit. And a flight from the dollar would cause some serious problems.
So I think $40 dollar oil won't happen simply because of the dollar sliding against other currencies. We can inflate a bit more but their are limits before we see a serious move away from the dollar. Devaluing the dollar has a huge impact on the world.
Great points.
The petro states are also massive dollar reserve holders.
Also, a lower dollar vs. China is very much what much of Congress (and Paulson) are after.
There are just too many pension funds holding too many retirement dollars for the Fed to let them collapse because of some financial legerdemain on the part of young Wall St. hotshots. That plus the political desire to push the dollar down (particularly against the RMB) all are forces that would tend to push oil higher.
OK Brain Children:
Not much mention of China in this post and I wonder why. Think about this: given a rapidly growing wealth-producing economy with 1.3 billion people and a "mature" debt-ridden largely parasitical economy with 0.3 billion, for how long will the leaders of the rapidly growing economy continue to prop up the currency and subsidize exports to the "mature" one? And given the rapidly growing oil consumption of the 1.3 billion-strong economy, for how long will they suffer paying for oil with the weaker currency?
It seems to me we may be near a threshold. At some point it will make sense for China to chuck American markets in the garbage can of history, accept its dollar losses, and in short order proceed to do all the business it wants with itself and those trading partners who have something worth trading for. I cannot see how this could be anything but discontinuous and profoundly disruptive for America.
But no doubt America's financial elites would be able to jump trains in time. Think how cheap estate grunts would become!
Hans Noeldner
"Civilization is the presence of enlightened self-restraint"
Good article!
The question: "So the question of the hour is: how bad is this credit crunch going to be?"
Is interesting for me as a layman too.
I've found the following helpful for myself:
http://www.rgemonitor.com/blog/
posts from the past 2 weeks, esp:
http://www.rgemonitor.com/blog/roubini/209779
http://www.rgemonitor.com/blog/roubini/210283
http://www.rgemonitor.com/blog/roubini/210526
http://www.rgemonitor.com/blog/roubini/211152
http://www.rgemonitor.com/blog/roubini/211387
Although I'm sure most of us here have read them already. Some of the comments are quite interesting as well, even if I can't vouch for their validity.
Several economists (Robert Schiller, Roubini, etc.) are still saying the likelihood for continued and increasing financial turmoil is fairly high.
The ARM reset schedules are also interesting although inconclusive to me:
[fourth image missing, can't seem to locate it now]
I get a feeling from reading from economists' comments nobody really knows with any kind of certainty (what is going to happen). People just guess.
BTW, the link to larger version of 7th image counting from the top is broken:
http://www.theoildrum.com/file/fuel_economy_to_may07.png
Who knows, looking around media that is not controlled as much as in the US found an article stating that despite full page ad's by Countrywide saying things are fine they have started laying off a considerable number of people.
It also mentions 1900 layoffs at Capital One which hasn't been in the limelight so far.
It seems like even in countries with no sub prime exposure there will be some knock on effect due to restriction of credit.
http://www.lanacion.com.ar/economia/nota.asp?nota_id=936356&origen=premium
Yes, that's what I've been reading.
Debt and credit markets are global.
If the crunch is big enough, it will affect all players, regardless of the currency carried.
That's the theory anyway.
To me the remaining question are:
- Inflation or deflation (assets, headline, cpi)?
- Stagnation or depression (above or under zero growth)?
- Which markets (will US tank us all)?
- The size/duration of impact on oil demand?
I'm guessing if interest rates will go down and markets turn more optimistic, inflation it is.
However, if markets turn highly risk averse and refuse to loan/borrow (even regardless of interest rates), then it's more likely deflation, right?
My summary is that the stagflation (in US) callers are starting to gain ground.
Personally I wouldn't know either way, and I'm not sure anybody else really knows either.
I like this post as it ties together some of the stuff that I have been keeping an eye on and pondering the effects of.
I've been reading bits of RGM for 8 months or so now -I first read there that this was a brewing crisis and he was right.
Looking at the graphs the rump of these resets come around Nov-Jan. This has got to be the worst time of year possible to find out your mortgage costs are about to go up by 50%, I expect it will be a miserable Christmas for a great many Americans this year.
This MoneyWeek advertisment (its basically a sales pitch for a subscription) is also good at pulling some of the threads together:
MoneyWeek Advert: The UK in 2010
Nick.
Great work Stuart. Definitely sums up my 'best guess' view of the world. I wrote my own summary of Jerome and Stoneleigh's work:
http://philhart.com/shares_slump_and_credit_crunch
I was trying to link peak oil into the current crisis, because I think it's very much part of the unfolding story. I finished by saying:
These are volatile and chaotic times. Nobody knows the future, but my guess seems pretty close to yours.
cheers
Phil.
WRT your comments on the FOMC minutes:
There appears to be a pervasive bias towards optimism amongst US political and business elites, and indeed amongst the entire population. I believe it to be cultural. It is probably impossible for anyone predisposed toward a more pessimistic outlook to ascend to the heights of governmental or financial policymaking.
It has not been that way in all times and places, of course. There have been cultures that were deeply pessimistic and fatalistic. The present US culture might even be more the exception than the rule.
Of course, we've had a good run with FF over the past few centuries as well. Indeed, American cultural optimism and FF usage might very well be closely linked. This could be an interesting subject for research - I wonder if anyone has run across anything along these lines?
Of course, the optimists are not always right. If they were, contrarian investing would scarcely be possible, would it?
The long run of FF-induced prosperity is now coming to an end. The cultural bias toward optimism that has served America and its elites so well over the past few centuries is now becoming mal-adapted for the new reality of resource constraints and a likely long-term economic decline toward amore sustainable level. There must be huge implications to this. It is likely that elite institutions and the elites that have run them are about to be confounded by their inate optimism. It will almost certainly cause them to make wrong decisions on a fairly consistent and continuous pattern. Eventually, their inevitable failure to adjust to the shifting paradigm will lead to a wholesale changeout as new institutions and elites oriented toward a more realistic/pessimistic paradigm prove to be more accurate and competent for dealing with the changed world.
Interesting times.
I have no hard personal evidence for what I am about to suggest, but have read books such as "Confessions of an Economic Hitman," and am wondering if the published minutes of these meetings are PR jobs to inspire confidence and keep resources flowing into US markets.
These guys might not be fatally optimistic (or nearly stupid), they may be doing a great job of keeping their system going.
A common practice among local city councilors in this town was to all meet for breakfast, talk among themselves and agree on their votes, then hold the public meeting that night. Kept those public meetings short and they got their beauty sleep. The council was called "The Gang of Five." I wonder what was said at breakfast that never made it into the public minutes?
I must be understood first of all that "minutes" are not the same thing as a verbatum transcript. They are only supposed to be a summary of the main points.
Second, one must understand that the minutes say whatever a majority of the members agree that they should say. Everyone in the room could be saying something like "OMG, the market is going to crash tomorrow", and the minutes that they actually adopted would say something like "General concern was expressed about the possible direction of financial markets."
Thirdly, you are right. Not all decisions are made during the course of the meeting. My guess is that the Fed chair has had personal private phone calls or meetings with each member of the FOMC prior to the official meetings. Few people in that sort of position would want to be blindsided, nor to discover that they didn't have the votes to support what they wanted to do.
By the way, your "Gang of Five" example would be illegal under the laws of NC, and probably many other states as well, unless their breakfast meetings were publicized in advance.
Stuart, another good post. Since your Auto Efficiency Wedge post, I've been thinking about the VMT and all that. A couple of comments.
The increase in fuel efficiency that you have previously estimated can be modeled by an 8% per year vehicle replacement starting in 1978, the year of the CAFE standard implementation. As there have been no appreciable improvements in these standards (until recently), you would expect the fuel efficiency to level off after some time, and I think that is the effect in the data. The observation that the fuel efficiency could actually be decreasing could be a result of the phase-out of MTBE and phase-in of 10% ethanol. That is a guess and only a guess.
It is my opinion that the effect of the CAFE improvement is what you should see in the data. It is true that when times get tough, many people will switch to better fuel efficient cars (I have for instance). However, this will be masked by those who don't. The automakers attempt to hit the CAFE standards, but there is no incentive for them to better it. Thus, if better fuel economy cars are selling, that frees the automakers up to put more muscle into other cars, thereby eliminating any effect of the increased purchasing of fuel efficient vehicles. That is my hypothesis, and I offer it up to see if anyone can come up with a way to test this. This hypothesis is consistent with the fuel economy data that you have graphed.
What is interesting about the idea that CAFE standards are the driver of the nation's fuel economy is that there is no price elasticity in it. The demand changes will then be seen in the VMT and not the fuel economy data. I believe that you are seeing that as well. In other words, people buy whatever cars are offered, and they drive as much as they can afford.
If you look at vehicle miles per vehicle, you will see that driving really took off in the mid-1980s but leveled off in the late 1990s, and it is now declining. Interestingly enough, the inflation adjusted driving cost/mile started falling in the early 1980s (lower relative gas prices AND increased fuel economy) and remained steady until about 2000, with large increases seen in the last couple of years--coincident in time with the fall in VMT per capita.
It is hard to see how VMT per capita could increase further from the value in 2002-4. Daily mileage had capped out (you won't drive more than 2 hours to work), public transportation usage had bottomed out, the percentage of women workers plateaued, and there is now more than one vehicle registered for every registered driver. The only thing increasing VMT is apparently the population increase. Thus, in terms of VMT per capita, we can only go down.
How far down can we go? Good question. Effectively if by 2010 we could reverse everything we have done in the last 20 years. With the increase in population since 1980 being that would put us at 30% above the 1980 level, giving a VMT of roughly 2 quad miles traveled, or a 33% reduction from our present VMT of 3 quad miles. To decrease further would require extraordinary lifestyle changes.
The housing debacle should certainly enhance the VMT contraction, I agree. People will abandon their exurbia houses and move closer to their work (if they have it). Will that and the other reductions be enough to mitigate the projected gas supply crunch? Whichever way you look at it, it sure looks ugly.
How far down can we go? [in VMT]
Just checked my mail @ 8 this morning. Mail must have been delivered after I last checked it @ 8:15 last night. Got a hand written letter from Ed Tennyson with an expanded list of Urban Rail that is viable today in the Washington DC area (Ed was involved with planning WMATA decades ago, as well suing GM over destroying streetcar lines. GM lost and paid a $1,000 fine).
I am using DC Metro as an example of what could be done in a major city.
1) Dulles Metro Silver Line into Loudon County - 23 miles $5 billion
2) Purple Light Rail Bethesda to New Carrollton - 15 miles $1.5 billion
3) Columbia Pike - Crystal City to Skyline - 5 miles $200 million
4) Capital Cities Light Rail - Shady Grove to Fredrick - 30 miles $1 billion
5) Centreville Light Rail - Vienna, Mannassas, Dulles - 20 miles $800 million
6) Richmond Hwy Light Rail - Huntington-Metro--Ft. Belvoir-Springfield Metro- 15 miles $500 million
7) VA Beltway Light Rail - Springfield-Tyson's Corner - 12 miles $450 million
8) Anacostia Light Rail - Bollin Field to Minnesota Ave Metro Station - 9 miles $300 million
9) H Street DC Light Rail - Minnesota Ave to New Jersey & Florida Avenues
10) Georgetown Subway (Plan developed by Ed (80%) & I (20%))
Bethesda-Georgetown @ Wisconsin (reroute Red Line for 2 stations and use in section of new subway)- P Street-Union Station -7.5 miles - $1.8 billion
11) Red Light Rail in Baltimore - Charles Center to Social Security (?) - 8 miles $350 million
12) Electrify Railroad - Union Station & Landow(?) to Richmond - 120 miles $750 million
13) Extend Baltimore Light Rail Cromwell to Harundle(?) & Marley - $90 million
14) Wilson Bridge Light Rail - Alexandria to B? Ave Metro Rail Station $500 million
15) Charles Gunty Light Rail - Branch Avenue to La Plata MD - $800 million
Ed also had a list of four projects to avoid, so this is not a "kitchen sink" plan with every possible option included, but one assembled with mature judgment. Raise gas to $9/gallon and those 4 projects might require further scrutiny.
Do the above and what will DC Metro VMT decline to ? Especially in an oil scarce era.
And apply to same approach across the nation.
Best Hopes for fewer VMT,
Alan
Funny postscript - Laurence Aurbach (TOD poster & TOD (Transit Orientated Development) expert) was familiar with the unit of measurement "tennyson" but though this was named for some long dead 19th Century scientist. He was floored to find that Ed is alive (if old) and kicking and that I talk with him :-) I am trying to get Ed to come to ASPO-Houston.
Alan:
Good article on high speed rail at:
http://www.govtech.com/fasttrack
Links to some good maps & photos accompany the article.
Thanks !
I am at variance with most rail advocates in NOT supporting High Speed Rail in the USA.
HSR requires dedicated ROW, to the exclusion of freight (except light duty freight that is no heavier than a rail car full of people & luggage).
I see moving frieght by rail as the higher priority, taking it from truck & air.
I support semi-HSR; passenger service at a max 110 mph seems to be an economic sweet spot (125 mph requires more expensive controls and quality track) mixed with 70 to 100 mph medium and low density freight (veggies, fish, JIT inventory, flowers,) seems a wiser investment to me for the USA. The CSX proposal (described up thread w/link) seems remarkably similar to my concept with some variance.
Building Urban Rail is a FAR higher priority than any HSR plan I have seen proposed.
IMHO (and I am at variance with the vast majority of rail supporters), HSR has sex appeal and a lust & Euro envy factor. But the numbers show that it is NOT the highest and best use of our limited capital.
Electrify our freight RRs, add tracks & capacity (and slow pax service) and build Urban Rail FIRST !
The CSX proposal is a "good deal" worthy of being built. Pax service at max 110 mph and average speed (with stops) of 87 mph DC to Miami. But the real value is in high volume 50 to 70 mph electrified freight service w/o delays.
Rail instead of truck veggies from Florida to the Atlantic Coast, fish likewise, etc.
Best Hopes for Logic vs. Sex Appeal,
Alan
I'm sure you're right that -- what shall we call it, MSR (Medium Speed Rail)? -- is more economically practical in the US right now. Heck, I'd be happy with more ASR (ANY Speed Rail)!
It does get the blood boiling, though, to see all these other places moving forward with HSR -- while we here in what proclaims itself to be "the greatest nation on earth" are stuck with the choice of: 1) long lines waiting to be poked and prodded for the privilege of squeezing into a metal can like a sardine; or 2)taking one's life in one's hands to drive for hours in a little metal box, while others are speeding past at 70+ mph in bigger and heavier metal boxes only inches away.
Between the corporations and the politicians, we in the US have been well and truly "had".
When I play SimCity 2000, I never build any roads. Just hook everything up with rail. Roads decrease property value with pollution and will eventually become parking lots. "I was Born in East LA." springstein
RobertInKyoto
I haven`t escaped from reality. i have a daypass.
Too bad we couldn't have run a few thousand iterations of SimUSA before we had to do it for real. We could have spared ourselves a lot of problems.
I think original Limits to Growth crew ran and reran the model something like thirty times making things better and better and better until finally they found a scenario where most people on the planet survived. [Went looking for reference which someone emailed me yesterday, but I must have deleted it - oops.]
cfm in Gray, ME
Of course we can keep adding Americans and cancel out any per capita improvements. 300 Million,310,320,....
In my opinion we are headed into a worldwide depression which will drastically reduce oil and energy consumption. This is not going to be pretty. We could easily end up with huge glut of oil for many years. This could be a good thing with the right leadership. Unfortunately it will be difficult to sell energy conservation projects to stimulate the economy when there is a glut of energy. The benefit is that there will be excess energy available for conservation projects if we have the foresight to take advantage of it. The congress and white house must be completely replaced to accomplish anything.
2008 is an election year. Why none of you mentioned that is a puzzle to me. The question I have is how much do the FED controllers want the GOP to win the White House and control of Congress? Can they keep things going well enough until Novenber 08 so an "it's the economy stupid" strategy does not put the Dems in total control?
Preceding every major recession/depression America has gone through since 1837 was unregulated hanky panky in a financial market. There was Jim Fisk trying to corner the gold market. There were the Trusts and monopolies in the 1890s. There was excessive borrowing to buy stocks in the 1920s. Deregulation of S&Ls in the 80s set us up for the deficits and recessions of the Papa Bush years. Enron triggered the last recession. Now we have predatory lending practices and free trade setting us up for a big hit. The GOP fired all the cats so now the mice are over running us.
There is hanky panky preceding, postceding, and during every recession. Post hoc ergo prompter hoc.
The S & Ls went bankrupt by the 20% prime rate of the seventies while they had 30 year fixed mortgages on the books at 4%. When my parents paid off their mortgage, their property tax exceeded their fixed monthly payment. The deregulation of the eighties was the government doubling down on their losses instead of just paying off. Which turned a small crises into a large one. The S&L had net worth of zero and below so they have no reason not to make risky bets with the government's money to say nothing of outright fraud.
I'm not sure the feds care who wins the 2008 election and I don't know they can do something about it anyways. I"m sick of seeing kids come home with a flag around them whatever the economy will be doing.
RobertInSantaBarbara
I haven`t escaped from reality. I have a daypass.
I'm sorry if this was already covered upstream.
And Stuart Said:
Perhaps the credit crisis is a key part in a plan for "demand destruction."
After i have read all these great comments, i am somewhat confused as a layman, but i belive WT ELM model seeems logical. And for the matter of a new great depression, i believe that is highly propabel.
So wats´s left for me as an ordinary citicen to do, but to buy gold, and wait for WTSHTF.
Stuart, new car sales haven't fallen in the last 3 years (they've dropped 6% in the last 2 months year over year, which isn't much - it's just a blip). Further, newer cars are used more than older cars, so new cars have a disproportionate effect: 6% of VMT from vehicles less than 6 years old.
Plus, heavy truck sales have plummeted, and all classes of buyers are moving to higher MPG vehicles: for instance, heavy vehicle owners 2 years ago kept their large vehicle 66% of the time, now it's 61% (all classes of vehicle owners show some movement to other classes). Owners of other kinds of vehicles are moving to heavy vehicles much less often. Hybrid sales rose about 50% from last year, and have been rising 55% per year recently.
I suspect the VMT data is badly flawed. The alternative is that useage is moving between existing vehicles, such that less efficient vehicles are getting used more - that makes no sense.
Nick: thanks for your interesting remarks. I agree with you that there have been some modest shifts towards efficiency in the market for new vehicles in the last couple of years. However, I doubt the VMT data is too badly flawed (it seems unlikely it would be flawed in such as way as to correlate with GDP for example).
What I wonder about is whether there's a "retention of the tail" effect that occurs when low-income consumers become economically stressed - old vehicles are kept on the road longer. This needs further investigation.
" I agree with you that there have been some modest shifts towards efficiency in the market for new vehicles in the last couple of years. However, I doubt the VMT data is too badly flawed ...What I wonder about is whether...old vehicles are kept on the road longer."
I figured it out.
VMT is falling faster than fuel consumption. The logical explanation is that those people who are sufficiently sensitive to gas prices to reduce their VMT are also driving higher MPG vehicles, which are cheaper to run, and also tend to be less expensive to buy. So, when these people drive less they also save less, on average, than the average driver. The effect is to make the average VMT-weighted fuel efficiency slightly lower.
Doesn't that seem obvious, in hindsight?
That's an interesting hypothesis - in a way it's kind of the reverse of mine (I tend to assume that older cars have poor fuel economy and are differentially likely to be driven by lower-income consumers), but I guess it's just as plausible that lower-income consumers are driving smaller cars on average, as well as older ones on average. I guess we need more data to constrain our speculations on this point.
oops. "6% of VMT from vehicles less than 6 years old." should be "50% of VMT from vehicles less than 6 years old." Makes a big difference!
"So, I would really like to get a better handle on how bad this credit crunch is likely to get before it's done."
_Stuart Staniford
The new guy at the IMF says 'don't hold your breath.' Hurry though, it's almost time for it to go behind the wall.
I think the following link: FORGET PEAK OIL, PEAK NET WORTH IS THE REAL DANGER is of interest here!
I posted an excerpt from the following story over on the Drumbeat thread. In any case, I suspect that we may begin to see more and more heavily indebted consumers throw up their hands and (at least try to) walk away from their credit card and mortgage debts, ultimately leading to more of a reversion to a cash/barter economy.
http://www.nytimes.com/2007/09/02/business/yourmoney/02village.html?_r=1...
Can the Mortgage Crisis Swallow a Town?
At current rates, analysts expect foreclosure filings to hit a rate approaching heights not seen since the Great Depression.
A note on UK interest rates and mortgages
Before the current crisis began to unfold, it seems UK mortgage lenders were dealing with borrowers who couldn't meet higher repayments resulting from interest rate rises, by simply extedning the period of loan / adjusting the capital and interest mix, even if this meant borrowers never paying off their loans.
Furthermore, I'm reliably told that "a massive" amount of fixed interest mortgages were written 3 years ago and that these are due for renewal before the end of 2007. Those on fixed interest have not been exposed to interest rate rises - yet. They will get hit by a 2 to 3% rise all at once - revert to point 1 made above.
In short, interest rates in the UK seem now to be a pretty blunt instrument when it comes to controlling the spending habit of UK consumers. These consumers have also grown used to rolling up store card and credit card debts and consolidating them within their mortgage - holidays, therefore, may be re-paid over a 30 year period with astonishing amounts of interest paid.
Key for me in understanding how the current credit crisis unfolds is the behavior of the banks now. Will they continue with the slack credit terms of recent years or will they tighten controls - refuse to roll consumer debt into mortgages and impose more realistic time scales for debt repayment. If they do the latter, consumer spending will likely screach to a halt, the economy will enter recession - and if unemployment starts to rise, borrowers will lose their ability to maintain debts, firesales take place and property prices will tumble along with the rest of the economy into an edifice.
I'd say things are balanced on a knife-edge. My feeling is that the real bad news has yet to emerge, and when it does this may inspire caution among the banks leading to the implosion described by Stoneleigh.
Similar situation in Ireland too
I would just like to add that a similar situation as per UK, has happened in Ireland too, with many people buying cars and paying for holidays by re-mortgaging. There has also been massive property prices increases over the last 12 years and as a result many people have used their houses as ATMs based on the fact that the value has gone up.
It is definitely the result of cheap credit and this cheap credit thing is definitely global since no currency can allow itself to depart very far from it in terms of its own interest rates.
Prices this year have finally levelled off. And the same tricks are in place like very long mortgage periods and 100% loans. Neverthless we have a situation where those buying have huge mortgage debits and some of those who bought years ago and should be on their way to clearing their mortgage have actually increased it. Reported figures for inflation are probably inaccurate because the actual costs of living are rising quite fast. IMO, we will probably get out of this knot by inflating ourselves out of it, but since we are in the Euro, it remains to be seen how this works out with the rest of Europe.
Lastly oil usage in Ireland has more than doubled in the past 10 years, as have the number of cars. We are 100% dependent on oil imports.
http://science.reddit.com/info/2l2cd/comments
new reddit submission as of 2 September.
as always your help in spreading around our authors' work is welcome.
The assumption of lack of investment in energy infrastructure is based on private funds being available, which may or may not be there for invesment. However, I suspect that the next bubble will be led with government funding which is unlimited in its ability to "print" money.
The United States is a bubble economy and another bubble must be started to offset the losses in the housing market. Specifically infrastructure and alternative energy already meet the criteria:
-Already showing signs of bubble activity before the recession
-Scalable to employee significant amounts of people
-Able to be accellerated through legislation
There are some pretty smart guys out there predicting this next bubble.
Eric Janzen from iTulip:
So while I do believe that the coming ression will "cool" things down for awhile, do not discount the ability for the Fed and the US Government to kick off the next bubble.
An energy and infrastructure investment bubble sounds like great news!
A lock up of the commercial credit doesn't mean $hit. Even if the private sector does not want to continue to borrow, the US Government can continue to borrow and pump as much money into the economy as it wants.
The Federal Reserve acts as the lender of "last resort" and will continue to buy the T-Bills as long as the US Government will pump them out. Does not matter what the private sector is doing.
Believe it or not... there are still many more rounds to this game before it is over.
I think the biggest surprise to everyone will be that the creation of debt is independent from the growth of energy. Debt can continue to grow for quite a while after energy growth has declined. In a fiat based currency system, debt equals monetary expansion and GDP. Consequently, monetary expansion can occur even after net energy production has stabilized, or even has begun to decline. You may even see an odd event where energy production has declined, but gross GDP has increased as gross debt has also increased. As long as the “chain of payments” is not cut (interest on debt is being paid), the expansion of debt will continue. Doesn’t matter how that debt is paid; even if it is paid through government bailouts and other tools (e.g. Bush’s bailout of sub prime mortgage holders). Bailouts are the equivalent of using inflation to pay the difference and inflation is irrelevant to net energy being created or Peak Oil.
This thing will continue on much longer than anyone will expect. Don’t underestimate the ability for the Fed or other powers to keep this afloat. I’m not saying that eventually there will not be a reckoning day, yes there will. But, it will be delayed much longer than many people are guessing.
Credit crunches happen due to one of a few reasons:
1) The supply of money declines overall.
2) Markets suddenly discover they don't have enough information to measure risk.
3) The return on capital goes way down. So the demanded interest rate rises.
We are experiencing #2 currently. An oil crunch has the potential to cause #3. But I'm not yet convinced it will.
This looks like Stuart's article that was originally posted August 20.
Could I request that when articles are re-posted like this, that they be labeled as such? In the past, I think that TOD editors usually added a note at the top when they re-posted an article.
Two reasons:
1. Correct dating ensures the credibility of the site. When readers go to a site, they are guaranteed that fresh content is really fresh.
2. It helps those of us who monitor the news from thinking they're going crazy. ("Haven't I read this somewhere before?")
Thanks Stuart and TOD editors for all you've been doing.
Bart
Energy Bulletin
exactly correct bart
....I started into reading the post and the comments, and thought, "haven't we already had this argument?" :-), to which I then thought, naw, can't be, this is dated Sept 2....it was like catching a TV show that I had not seen, and thinking, hey, this has promise, and then finding out that the final episode of it was filmed a few years ago! :-)
Of course, all the same holes are still in the arguments that were there the first time.....
1. The export land model I accept as generally a useful one, but only generally.....I am hard put to believe that as Saudi income drops due to declining oil production (which must be happening unless the price of crude oil rises very, very soon by large amount, which of course would either further deepen the recession, or make alternatives all the more competitive and we to assume they will simply keep pouring fuel to their spoilt teenagers without looking for some different way forward as their debts begin to climb?....and some of the huge and wasteful construction in the UAE and Dubai would have to be slowed down somewhat, wouldn't it? It was mentioned in one post that despite British oil production declines, home consumption has not changed appreciably. How long is that sustainable?
2. This is hard to say in a delicate way....we are now essentially calling OPEC and Saudi Arabia both liars and idiots to their face.....(this was always the Saudi complaint against Matt Simmons, by the way, and why they took no interest in his work, at least not that they would admit :-)
First is it the consensus here that the Saudi's are in fact liars, incompetent, one or the other, or both?
DISCLAIMER: I am not defending the Saudi's or OPEC, I have often questioned the, shall we say "openness" of both....and still feel they have a few cards up their sleeve that they will play at exactly the moment it gains them the most possible leverage, and possibly do the West the most harm.
However, if we are taking the very big step of now disclaiming all OPEC and Saudi information for purposes of future conjecture, we might as well admit that, and simply declare them as non-reliable as a supplier and as a source of statistics/information. Nothing personal, just business, right?
3. Likewise, the American oil and gas industry groups, the API (American Petroleum Institute) and the NPC (National Petroleum Council). We have to assume that given their recent pronouncements, that either (a) They know virtually NOTHING about the industries they represtent (b) or are being completely dishonest in every way. That is if we accept the extreme, EXTREME dire prediction of most of the consensus here at TOD. (Westexas, Stuart, Khebab, etc.)
4. Of course, all of this has little effect on what should be the desired goal.....large and yearly reductions of fossil fuel consumption. As I have said before, peak now or peak in 2030 for me does not change the goal. Purely for reasons of national survival, massive crude oil consuption reductions MUST be done. To me, it should be the absolute holy grail of the whole Peak Oil cause. The models and scenarios are a hobby.
I absolutely and completely agree with the view of Westexas,
"From the point of view of importing countries, global oil production is pretty much irrelevant."
Unless another North Sea can be found, and damm soon, thus flooding the world with oil exceeding the consumption of the producting countries, world oil production matters not. IF a massive oil find does occur, and it is not in North America, for the North American continent, it would be the last economic nail in the coffin. I have said before, the only thing worse than if the oil is not "out there" is if it is. We are already bleeding to death, and if oil does not soon get short, money will. I am still betting that we will run out of money long before we run out of oil to import.
We should stay to our goals.....alternatives and a 10% per annum drop in consumption over the next 5 to 10 years. (rough total result to reduce U.S. consumption of crude oil by 50%)
One more little thing.....I can't help but notice what I will name the ultimate "TOD Paradox", loosely stated as follows...."a recession will stop the formation of capital needed to prepare for peak oil, but continued growth is not sustainable." In other words, no growth is deadly, but, growth is deadly. (Try to sell that one to your friends and nieghbors! :-)
Of course, the paradox is viewed as only applying to the U.S., while India and China seem to be viewed as exempt from all economic/energy issues. :-)
How does that work?
RC
ThatsItImout,
Regarding “Unless another North Sea can be found, and damm soon, thus flooding the world with oil exceeding the consumption of the producing countries, world oil production matters not.”, another “North Sea” has been found in the form of non-conventional oil and it is in Alberta. See http://canada.theoildrum.com/node/2907. With regard to the many comments and particularly the technical and EUB permitting concerns expressed, see the powerpoint slides presented this past Wednesday, August 29th, 2007, at the Pareto Securities 14th Annual Oil & Offshore Conference in Oslo, Norway
at http://www.petrobank.com/inv-corporatepresentation.html. With the completion of installation of the sand separators, commercial production will begin on the three pilot wells. The next three wells at Christina Lake will be drilled and a permit application for the first 10,000BPD commercial module will be filed with the EUB this year. It takes 12 months from permit approval to mechanical completion. And front end planning is underway to replicate the 10,000BPD module to 100,000BPD production capacity at Whitesands. With regards to concerns about permitting, it is important to remember that the Government of Canada was/is a partner in the Whitesands Pilot Project, see
http://www.ic.gc.ca/cmb/welcomeic.nsf/261ce500dfcd7259852564820068dc6d
/85256a5d006b972085256fd60065aa54!OpenDocument (copy and paste entire link to open).
Regarding the scope of this technological development, note in slide 16 of the powerpoint, ”International Potential” that 1) confidentiality/technology sharing agreements with Petrobras, PDVSA, Ecopetral, and PetroChina among others are in place, 2) that Petrominerales SA/Columbia, with 1.5 million acres under lease including a heavy oil resource possibly as large as the Faja del Orinoco in Venezuela, has an agreement in place to utilize the THAI technology to produce that heavy oil resource, and, of particular interest, 3) Archon lab facilities is currently assessing third party oil samples. For those of us with downstream experience, that confidentiality/technology sharing agreement partners are submitting samples for lab testing is a sign that others have taken the next step toward third party JV/licensing agreements and third party commercial development. While here on TOD, we appropriately explore and debate the realities of peak oil, I believe we can look to Calgary where, with THAI, IMHO, “another North Sea can be (has been ) found, and damm soon, thus flooding the world with oil exceeding the consumption of the producing countries’.
daveinmarinca
daveinamerica,
I read the orignal THAI (Toe to Heel Air Injection) material that ran on TOD the other day with great interest, and went to the source sites and the petrobank site. It was fascinating enough to me, that I even did a post on my own small private energy group regarding it.
The promise is great. But, as everyone here knows, we have seen about 50 plus "in situ" extraction schemes proposed over the last half decade in the tar sand and heavy oil industry, and so far, none have delivered on the original promise.
This one may be different. If (note, I repeat, IF) it is, we may actually be able to buy some time.
Frankly, given the extreme danger we are in if (note, again, I repeat IF) one accepts these darkest scenarios as anything but hysterical ranting, there should be an emergency "Manhatten Project" going on NOW to free up the non-conventional oil around the world....
If (note, I repeat, IF) one accepts the conjecture of Stuart Staniford, Westexas, and Khebab, again, to name only a few, something like a major breakthrough in unconventional oil production may be the only thing that protects the developed world from a nightmare.
I originally cut my teeth on peak oil by reading Colin Campbell and M. King Hubbert. The TOD gang now so exceed their original warnings that they make the original Peak Oil theorists look like cornucopians!
Even the darkest theories MUST show the world at over a trillion barrels in reserves still remaining, and even if we accept no concept of reserve growth or new discovery, that seems like a pretty good sum of oil.
But, the recent conjectures seem to indicate that the trillion remaining barrels will somehow become almost without exception completely impossible to extract, and envision decline rates that simply picture the oil completely disappearing within only two or three decades. Not peak, mind you, but essentially disappeared, 75% plus gone....
Honestly, I am going to have to go back and see if there is some error in my reading of these scenarios, which can only be described as extreme to the breaking point of credibility, even if you have studied "peak" for years.
I am deeply concerned that I am near the point of having to decide whether any of this is any longer credible to me, or I will have to decide that I have simply allowed myself to be led astray by compelling graphs and admittedly some very strong use of rhetorical persuasion.
"Simply because a model can be built that is internally self consistant, does not mean that such an arrangement actually exists in the real world."
RC
The human brain has a funny way of dealing with unpleasant facts, particularly deductions about the future which are unpleasant. Denial is one mechanism that comes into play with facts that make one feel bad, mad or fearful (or in the case of peak oil, all three!), the limbic and neocortex brains constantly wrestling with new information, struggling to conclude that the facts are wrong. I have been wrestling with the peak conventional oil situation since Simmons publish "Twilight in the Desert". My philosophy is "facts are friendly" and the works of so many outstanding posters on this site supporting the hypothesis of peak conventional oil, along with Powell, Bahktiari, Skrewboski to name a few are incontrovertable. "If....one accepts these darkest scenarios as anything but hysterical ranting, there should be an emergency "Manhatten Project" going on NOW to free up the non-conventional oil around the world...." introduces politics and finance (one in the same) and nothing is more political than the world of energy.....what "should happen" and what actually happens are often different. My background is downstream and I came across THAI nearly three years ago. My first reaction was "holy cats....if this works, this changes the whole global energy game" and I have wrestled with the information coming from Christina Lake ever since. However, slowly, one by one, my technical concerns have been addressed and the business decisions supporting the development of this technology have been outstanding, if not legendary. It is important to understand the mind of the person behind this project and, in this regard, I offer this snapshot of John Wright, PBG.TO CEO
http://www.engineering.ualberta.ca/uofaengineer/article.cfm?article=4031...
A brilliant petroleum engineer, businessman, leader of people and above all, honest, IMHO, he is making this happen. In my thirty years in the downstream profession, I can count on one hand the people I have come across with his unique skillset. I totally appreciate everyone's incredulous reaction to the information presented as I have alternated betweeen awe and doubt over the past few years. However, this company has been very conservative in presenting information to the industry and press, always understating their accomplishments. Whats happening at Christina Lake and in Calgary is real and again, IMHO, is a peak conventional oil game breaker.
Hi Dave,
Thanks for the link.
re: "leader of people and above all, honest,"
I hope this is the case.
My Q is: Will he present a plan for conservation and the imperative to use the gain in time/oil to put in place whatever energy infrastructure - (wind, solar, design, along w. its correlates, eg. ag conversion to organic, etc.) - that will really be all we have once the oil boom is really (really) over?
As far as I can tell, to publicly and in action link the need for conservation (and it's twin, addressing population growth) and the need for renewables - is really the only ethical and honest stance.
I'd be interested in your opinion, though.
Hi Aniya,
Great question. I honestly don't know....however, I do believe that the very same free market system that will enable lower cost THAI produced oil to replace depleted conventional crude oil will ultimately enable the displacement of current carbon based energy sources with solar PV and batteries for BEVs. Kurzweil outlines the future in "The Singularity is Near". As R&D continues to drive down the cost of PV, at some time in the not too distant future, IMHO, PV will be cheaper than conventional carbon based electricity. And battery technology is improving at a comparable rate. I came across this today
http://www.treehugger.com/files/2006/03/eestor_capacito_1.php
as an example....if it works, LiIon and NiMH are history.
I'm just happy that PBG/John Wright has what it takes to push a technology forward that will bridge the gap of peak conventional oil and tide the species over until PV and BEV are economic.
Some of us have been on this for the last year and a half. But even if it's vaporware, there are enough different storage technologies out there which can do the job that we are almost guaranteed a success or three.
Thanks for reassuring me that I am not going crazy.
It's good that TOD reposted Stuart's work though. His deconvolution of the yearly trends from the monthly trends is a classic. A simple analysis yet telling in what it portends!
IMO they just want us to believe that we are in a credit crunch.
We really are in a major earnings crunch.
As long as it just affected the people that produced something they didn't care.
Now when all the smiling vultures that were compensated with percentages of the booty are at the end of the road everyone is worried.
Many of these people surely still have large lines of credit. Point is that they can not afford to use them because their earnings have been cut off as surely as the revenue stream from ever increasing housing values. In turn this brings credit contraction as it is obvious to anyone that they could not service future debt. The underlying reason however is the earnings crunch. The fed can not reverse the earnings crunch no matter how much credit is expanded. They can save the principal crooks, but all the junior crooks are dead meat regardless because of the EARNINGS CRUNCH.
This time you are not talking people that bought an ice cream cone when they felt like celebrating something. This time it is the Versace clad peacocks with 400$ haircuts most engaged in unnecessary conspicuous consumption of all sort of high end items and services under the "easy come easy go" rule. Talk about an "haircut" as a "life experience".
There is nothing left to steal, the effect on the economy is going to be severe, the only ones that might weather it relatively well are the ones that can produce critically needed value with their personal work. The ones that produce nothing other then hot air, both at the top and bottom will get hit hard. They know it, that's why they whine so loudly.
In a free market it would hide Peak Oil for a long time. On the other hand it would be a good excuse to introduce the concept to the sheeple while completely obfuscating the fact that they knew about it all along.
Sekiu, WA August 27-31, 2007
Boston whaler. Two 250 hp outboards, 285 gallon gas tank, 2.7 mpg. About $1,000 to fill up.
Peak oil?
Us peak oilers were using a 2002 Toyota corrola at 39 mpg and 15 hp yamaha outboard on our essential non-gas-wasting 2007 salmon fish [about $50 - 100 per pound]
That's Vancouver Island in the background.
We suspect that this fun may not last for reasons other than old age.
cheers.
Sobolewski took this photo.
Nice sockeye, but next time you are in the neighbourhood pop by for a cuppa, I don't troll myself though, prefer to just drift lazy-like and jig. Except for the moorage, cost of boat, maintenance and all the lost tackle the fish are free that way:)
BACK IN BOOM TIMES....
As the Steve Winwood song says, "Back in the high life again....all the doors that closed one time, will open up again....
http://news.yahoo.com/s/ap/20070902/ap_on_bi_ge/engineering_shortage;_yl...
This is becoming so '70's I am getting ready to start buying bell bottom slacks and prepping an afro....:-)
RC
Isn't this what was supposed to happen as we reached the actual peak of world oil production?
Stuart accurately looks at Vehicle Miles and the drop in GDP as a key factor.
We have lived in a world since 2004 where the price of energy has doubled and tripled. Many people tell us that Peak Oil will only be here when we see stratospheric oil and gasoline prices like $100 a barrel and $8 a gallon.
That's just not going to happen soon. When crude hits $70 and gas hits $3, there are extreme chaotic effects that drive key aspects of the economy down. In the most recent case, energy and food inflation destroyed the ability of marginal subprime homeowners to make their mortgage payments.
We are now in the bust and build phase of the oil production decline. In the bust phase, we reach limits of production and high energy prices destroy one or several key sectors of the economy. The resulting economic downturn will reduce energy demand and energy prices. As soon as we restructure from the current bust, the economy will build again by taking advantage of low energy prices. Energy Demand will build back to the limits of the production curve and the resulting return of high energy prices will destroy another two or three sectors of the economy and we will bust again.
I believe that we will be in this phase of the transition until oil production drops to the point where it can no longer support the build phase and then the terminal decline of the economy will begin in earnest.
Has anyone seen Hari Seldon?
My Favorite Google Reader Stories:
http://www.google.com/reader/shared/01423328269523419567
Rick, while I agree that the price of energy doubling and redoubling sure is a brake on the economy, it is not the whole story. Capitalism seems to be cyclical even when the energy supply is still gowing. I offer a example:
Stuart wrote "The last financial panic of major significance in the US was the Great Depression, which was essentially the result of a large debt-fueled bubble that crashed in 1929." Actually, the 1929 stock market bubble was partially the result of people trying to recoup losses from the popping of the Florida real estate bubble in 1926. Sorta like the recent real estate bubble was partially an attempt to double down from losses in the dotcom bubble bust.
As an aside, the reason the Florida real estate bubble popped in 1926 was.....
wait for it.....
a strong hurricane coming ashore at Miami Beach in 1926.
When these systems get unstable, it is hard to predict what will start the dominoes falling.
Good luck on no strong hurricanes hitting the Southern US in the next couple of decades : (
Errol in Miami