Peak Oil Update - September 2007: Production Forecasts and EIA Oil Production Numbers
Posted by Sam Foucher on September 22, 2007 - 10:15am
An update on the latest production numbers from the EIA along with graphs/charts of different oil production forecasts.
 and various forecasts (2001-2027)")
World oil production (EIA Monthly) for crude oil + NGL. The median forecast is calculated from 13 models that are predicting a peak before 2020 (Bakhiarti, Smith, Staniford, Loglets, Shock model, GBM, ASPO-[70,58,45], Robelius Low/High, HSM). 95% of the predictions sees a production peak between 2008 and 2010 at 77.5 - 85.0 mbpd (The 95% confidence interval is computed using a bootstrap technique). Click to Enlarge.
Executive Summary:
- Broad revision (from 1980 to 2004) by the EIA this month but not significant in amplitude.
- Monthly production peaks are unchanged:
- All
Liquids:
the peak is
still July 2006 at 85.54 mbpd (
 0.11 mbpd), the
year to date average production in 2007 (6
months)
is 84.28 mbpd (
0.02 mbpd), down 0.07 mbpd from 2006 for the same period.
0.11 mbpd), the
year to date average production in 2007 (6
months)
is 84.28 mbpd (
0.02 mbpd), down 0.07 mbpd from 2006 for the same period. - Crude Oil
+ NGL:
the peak date remains May 2005
at 82.09 mbpd (
0.01 mbpd),
the
year to date average production for 2007 (6
months)
is 81.20 mbpd (
 0.04 mbpd), down 0.06 mbpd from 2006.
 - Crude Oil
+ Condensate: the peak date remains May 2005 at 74.30
mbpd (
0.15 mbpd),
the
year to date average production for 2007 (6
months)
is 73.23 mbpd (
0.14 mbpd), down 0.25 mbpd from 2006.
- NGPL:
the peak date is still February 2007 at 8.03 mbpd (
0.21 mbpd),
the
year to date average production for 2007 (6
months)
is 7.97 mbpd (
0.18 mbpd), up 0.19 mbpd from 2006.
- Decline in crude oil + condensate continues: June 2007 estimate for crude oil + condensate is 72.82 mbpd compared to 73.11 mbpd one year ago and 73.92 mbpd two years ago.
- Average forecast: the average forecast for crude oil + NGL based on 13 different projections (Figure above) is showing a kind of production plateau around 81 +/- 4 mbpd with a decline after 2010 +/- 1 year.
- mbpd= Million of barrels per day
- Gb= Billion of barrels (109)
- Tb= Trillion of barrels (1012)
- NGPL= Natural Gas Plant Liquids
- CO= Crude Oil + lease condensate
- NGL= Natural Gas Liquids (lease condensate + NGPL)
- URR= Ultimate Recoverable Resource
EIA Last Update (June)
Data sources for the production numbers:
- Production data from BP Statistical Review of World Energy 2006 (Crude oil + NGL).
- EIA data (monthly and annual productions up to February 2007) for crude oil and lease condensate (noted CO) on which I added the NGPL production (noted CO+NGL).
The All liquids peak is still July 2006 at 85.54 mbpd, the year to date average production value in 2007 (6 months) is down from 2006 for all the categories except for NGPL. The peak date for Crude Oil + Cond. remains May 2005 at 74.30 mbpd (see Table I below).
")
Fig 1.- World production (EIA data). Blue lines and pentagrams are indicating monthly maximum. Monthly data for CO from the EIA. Annual data for NGPL and Other Liquids from 1980 to 2001 have been upsampled to get monthly estimates. Click to Enlarge.
| Category | June 2007 | June 2006 | 12 MA1 | 2007 (6 Months) | 2006 (6 Months) | Share | Peak Date | Peak Value |
|---|---|---|---|---|---|---|---|---|
| All Liquids | 84.50 | 84.21 | 84.65 | 84.28 | 84.35 | 100.00% | 2006-07 | 85.54 |
| Crude Oil + NGL | 80.72 | 80.83 | 81.34 | 81.20 | 81.26 | 95.52% | 2005-05 | 82.09 |
| Other Liquids | 3.78 | 3.38 | 3.30 | 3.08 | 3.08 | 4.48% | 2007-06 | 3.78 |
| NGPL | 7.89 | 7.72 | 7.90 | 7.97 | 7.78 | 9.34% | 2007-02 | 8.03 |
| Crude Oil + Condensate | 72.82 | 73.11 | 73.44 | 73.23 | 73.48 | 86.18% | 2005-05 | 74.30 |
| Canadian Tar Sands2 | 1.47 | 0.99 | 1.31 | 1.42 | 1.06 | 1.74% | 2007-03 | 1.57 |
Revision Pattern
There was a big revision this month for almost the monthly estimates:There was also a mistake in the May production from Canada that briefly went up by almost 1 mbpd! Overall, we can see that production for crude oil and condensate has been revised up around May 2005 and June 2006 but revised down for the first quarter of 2006 and 2007. NGPL production has been revised down for almost all the months since 2003. However, the cumulated amount of revisions do not exceed 0.5 mbpd.Important Changes This Month
In this release of the International Petroleum Monthly there are two major changes:
(1) Petroleum demand data for OECD countries, other than the United States and the U.S. Territories, have been revised for 1990-1994 based on the International Energy Agency's (IEA) annual review of historical OECD petroleum data, the results of which were released in the August 10, 2007 version of the IEA's Monthly Oil Data Service. Revised data are shown in bold italic font.
(2) Petroleum production data for 1980-2005 have been revised to match data in the recently released Petroleum Production Time Series Tables of the International Energy Annual 2005. Revised data are shown in bold italic font..
World petroleum production data for the month of June 2007 and the Second Quarter of 2007; and OECD country petroleum demand, imports, and stocks data for the month of May 2007 have been added.
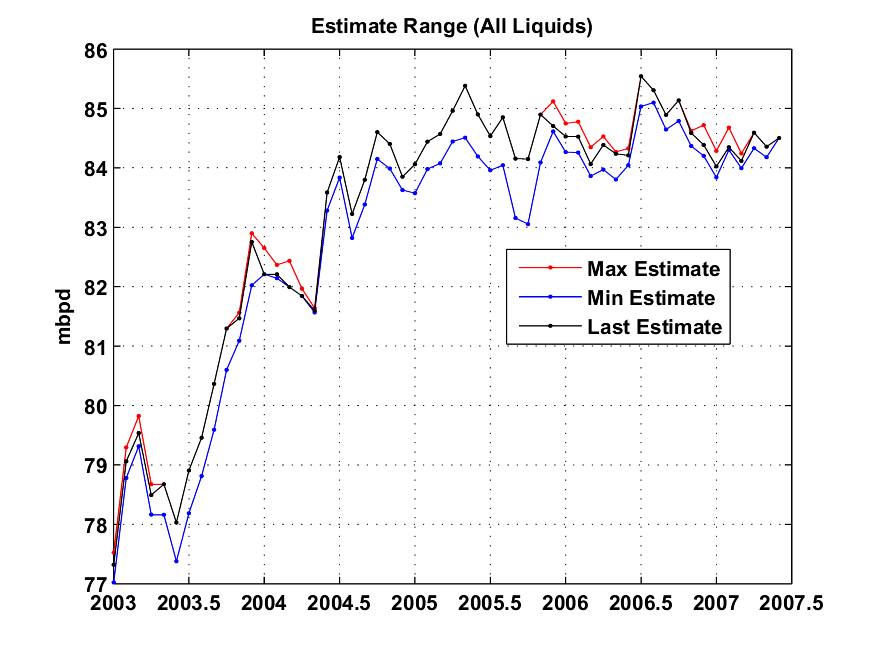


Fig 2.- Range of previous monthly revisions for All Liquids (top), crude oil + condensate (middle) and NGPL (bottom). Click to Enlarge.
The cumulative change in production estimates are shown on Figure 3. The 2005 annual production for all liquids has been revised up by 0.5 mbpd since initial estimate.

Fig 3.- Cumulative change in production numbers since first estimates are issued for each month. Click to Enlarge.
Business as Usual
- EIA's International Energy Outlook 2006, reference case (Table E4, World Oil Production by Region and Country, Reference Case).
- IEA total liquid demand forecast for 2006 and 2007 (Table1.xls).
- IEA World Energy Outlook 2006 : forecasts for All liquids, CO+NGL and Crude Oil (Table 3.2, p. 94).
- IEA World Energy Outlook 2005 : forecast for All liquids (Table 3.5).
- IEA World Energy Outlook 2004 : forecast for All liquids (Table 2.4).
- A simple demographic model based on the observation that the oil produced per capita has been roughly constant for the last 26 years around 4.4496 barrels/capita/year (Crude Oil + NGL). The world population forecast employed is the UN 2004 Revision Population Database (medium variant).
- CERA forecasts for conventional oil (Crude Oil + Condensate?) and all liquids, believed to be productive capacities (i.e. actual production + spare capacity). The numbers have been derived from Figure 1 in Dave's response to CERA.

Fig 4.- Production forecasts assuming no visible peak. Click to Enlarge.
PeakOilers: Bottom-Up Analysis
- Chris Skrebowski's megaprojects database (see discussion here).
- The ASPO forecast from April newsletter (#76): I took the production numbers for 2000, 2005, 2010, 2015 and 2050 and then interpolated the data (spline) for the missing years. I added the previous forecast issued one year and two years ago (newsletter #58 and #46 respectively). There was no revision since August 2006.
- Rembrandt H. E. M. Koppelaar (Oil Supply Analysis 2006 - 2007): "Between 2006 and 2010 nearly 25 mbpd of new production is expected to come on-stream leading to a production (all liquids) level of 93-94 mbpd (91 mbpd for CO+NGL) in 2010 with the incorporation of a decline rate of 4% over present day production".
- Koppelaar Oil Production Outlook 2005-2040 - Foundation Peak Oil Netherlands (November 2005 Edition).
- The WOCAP model from Samsam Bakhtiari (2003). The forecast is for crude oil plus NGL.
- Forecast by Michael Smith (Energy Institute) for CO+NGL, the data have been taken from this chart in this presentation (pdf).
- PhD thesis of Frederik Robelius (2007): Giant Oil Fields - The Highway to Oil: Giant Oil Fields and their Importance for Future Oil Production. The forecasts (low and high) are derived from this chart.
- Forecast by TOD's contributor Ace, details can be found in this post.

Fig 5.- Forecasts by PeakOilers based on bottom-up methodologies. Click to Enlarge.
PeakOilers: Curve Fitting
The following results are based on a linear or non-linear fit of a parametric curve (most often a Logistic curve) directly on the observed production profile:- Professor Kenneth S. Deffeyes forecast (Beyond Oil: The View From Hubbert's Peak): Logistic curve fit applied on crude oil only (plus condensate) with URR= 2013 Gb and peak date around November 24th, 2005.
- Jean Lahèrrere (2005): Peak oil and other peaks, presentation to the CERN meeting, 2005.
- Jean Lahèrrere (2006): When will oil production decline significantly? European Geosciences Union, Vienna, 2006.
- Logistic curves derived from the application of Hubbert Linearization technique by Stuart Staniford (see this post for details).
- Results of the Loglet analysis.
- The Generalized Bass Model (GBM) proposed by Prof. Renato Guseo, I used his most recent paper (GUSEO, R. et al. (2006). World Oil Depletion Models: Price Effects Compared with Strategic or Technological Interventions ; Technological Forecasting and Social Change, (in press).). The GBM is a beautiful model that has been applied in finance and marketing science (see here for some background). The estimation in Guseo's article was based on BP data from 2004 (CO+NGL).
- The so-called shock model proposed by TOD's poster WebHubbleTelescope . You can find a description of his approach on his blog here as well as a review on TOD. The current estimate was done in 2005 based on BP's data (CO+NGL).
- The Hybrid Shock Model is a variant of the shock model described here. The forecast is based on EIA data (up to 2006) for crude oil + condensate, the ASPO backdated disovery curve and assumes no reserve growth and declining new discoveries.

Fig 6.- Forecasts by PeakOilers using curve fitting methodologies. Click to Enlarge.
| Forecast | Date | 2005 | 2006 | 2007 | 2010 | 2015 | Diff2 | Peak Date | Peak Value |
|---|---|---|---|---|---|---|---|---|---|
| All Liquids | |||||||||
| Observed (EIA) | 84.63 | 84.65 | 84.32 | NA | NA | 2006-07 | 85.54 | ||
| IEA (WEO) | 2004 | 82.06 | 83.74 | 85.41 | 90.40 | 98.69 | -1.09 | 2030 | 121.30 |
| IEA (WEO) | 2005 | 84.00 | 85.85 | 87.64 | 92.50 | 99.11 | -3.32 | 2030 | 115.40 |
| Koppelaar | 2005 | 84.06 | 85.78 | 86.61 | 89.21 | 87.98 | -2.29 | 2011 | 89.58 |
| Lahèrrere | 2005 | 83.59 | 84.47 | 85.23 | 86.96 | 87.77 | -0.91 | 2014 | 87.84 |
| EIA (IEO) | 2006 | 82.70 | 84.50 | 86.37 | 91.60 | 98.30 | -2.05 | 2030 | 118.00 |
| IEA (WEO) | 2006 | 83.60 | 85.10 | 86.62 | 91.30 | 99.30 | -2.30 | 2030 | 116.30 |
| CERA1 | 2006 | 87.77 | 89.52 | 91.62 | 97.24 | 104.54 | -7.30 | 2035 | 130.00 |
| Lahèrrere | 2006 | 83.59 | 84.82 | 85.96 | 88.93 | 92.27 | -1.64 | 2018 | 92.99 |
| Smith | 2006 | 85.19 | 87.77 | 90.88 | 98.94 | 98.56 | -6.56 | 2012-05 | 99.83 |
| Crude Oil + NGL | |||||||||
| Observed (EIA) | 81.46 | 81.38 | 81.12 | NA | NA | 2005-05 | 82.09 | ||
| GBM | 2003 | 76.06 | 76.27 | 76.33 | 75.30 | 67.79 | 4.79 | 2007-05 | 76.34 |
| Bakhtiari | 2003 | 80.24 | 80.89 | 80.89 | 77.64 | 69.51 | 0.23 | 2006 | 80.89 |
| ASPO-46 | 2004 | 81.00 | 80.95 | 80.80 | 80.00 | 73.77 | 0.32 | 2005 | 81.00 |
| ASPO-58 | 2005 | 81.00 | 82.03 | 83.10 | 85.00 | 79.18 | -1.98 | 2010 | 85.00 |
| Staniford (High) | 2005 | 77.45 | 77.92 | 78.31 | 79.01 | 78.51 | 2.81 | 2011-10 | 79.08 |
| Staniford (Med) | 2005 | 75.81 | 75.94 | 75.97 | 75.52 | 73.00 | 5.15 | 2007-05 | 75.98 |
| Staniford (Low) | 2005 | 70.46 | 70.13 | 69.71 | 67.92 | 63.40 | 11.41 | 2002-07 | 70.88 |
| IEA (WEO) | 2006 | 80.10 | 81.38 | 82.67 | 86.50 | 92.50 | -1.55 | 2030 | 104.90 |
| Koppelaar | 2006 | 81.76 | 82.31 | 83.68 | 91.00 | NA | -2.56 | 2010 | 91.00 |
| Skrebowski | 2006 | 80.95 | 81.47 | 82.64 | 87.37 | NA | -1.52 | 2010 | 87.97 |
| Smith | 2006 | 80.53 | 82.81 | 85.45 | 91.95 | 88.60 | -4.33 | 2011-02 | 92.31 |
| Loglets | 2006 | 81.12 | 82.14 | 83.02 | 84.65 | 83.26 | -1.90 | 2012-01 | 84.80 |
| ASPO-76 | 2006 | 77.92 | 79.00 | 81.35 | 90.00 | 85.00 | -0.23 | 2010 | 90.00 |
| Robelius Low | 2006 | 81.45 | 82.19 | 82.50 | 81.84 | 72.26 | -1.38 | 2007 | 82.50 |
| Robelius High | 2006 | 81.45 | 84.19 | 86.67 | 93.40 | 92.40 | -5.55 | 2012 | 94.54 |
| Shock Model | 2006 | 80.76 | 80.43 | 80.01 | 78.27 | 73.74 | 1.11 | 2003 | 81.17 |
| Crude Oil + Lease Condensate | |||||||||
| Observed (EIA) | 73.81 | 73.57 | 73.16 | NA | NA | 2005-05 | 74.30 | ||
| ASPO-46 | 2004 | 72.80 | 72.56 | 72.25 | 71.00 | 63.55 | 0.91 | 2005 | 72.80 |
| Deffeyes | 2004 | 69.94 | 69.93 | 69.84 | 69.02 | 65.99 | 3.33 | 2005-12 | 69.95 |
| ASPO-58 | 2005 | 73.00 | 73.80 | 74.65 | 76.00 | 69.50 | -1.48 | 2010 | 76.00 |
| IEA (WEO) | 2006 | 70.80 | 71.78 | 72.77 | 75.70 | 80.30 | 0.40 | 2030 | 89.10 |
| CERA1 | 2006 | 76.49 | 76.89 | 78.60 | 82.29 | 83.83 | -5.44 | 2038 | 97.58 |
| ASPO-76 | 2006 | 71.11 | 72.10 | 73.66 | 78.00 | 72.00 | -0.50 | 2010 | 78.00 |
| HSM | 2007 | NA | 73.56 | 73.53 | 72.82 | 69.53 | -0.37 | 2006 | 73.56 |
| Ace | 2007 | NA | 73.48 | 73.03 | 66.96 | 58.47 | 0.13 | 2006-01 | 73.55 |
Next update probably in December.
Previous Update:
June 2007February 2007
January 2007
December 2006
November 2006
October 2006
September 2006
OilWatch last issue:
Peak Oil Update - September 2007: Production Forecasts and EIA Oil Production Numbers
PDF version
147 comments
Peak Oil Update - September 2007: Production Forecasts and EIA Oil Production Numbers
PDF version
147 comments
Contact
- Content: editors at theoildrum dot com
- Tech support: support at theoildrum dot com
License

This work is licensed under a Creative Commons Attribution-Share Alike 3.0 United States License.
Khebab: What is interesting is that you have 9 forecasts for all liquids listed and not one correctly forecast a decline in all liquids from 2005-2007. This implies that there is a strong optimistic bias in the forecasts.
Or that the other forecasts are merely following trends. If you notice on the lower left hand corner of the graph, there was a period of 3-4 years in which oil production globally was on a similar plateau. Even the ASPO seems to think we will have a tick up in oil production for a peak in the 2010-2012 time frame.
Or that the forecasts are for TOTAL (estimated) cumulative production (integral of the function in the graph), not accurate day-to-day production rate.
Hence, estimates will be 'wrong' for month-to-month estimates, even if they might be dead on accurate about the actual final production in the end.
I doubt some people would be happy with any forcast if it doesn't show an immediate and continual decline nor follow the month to month fluctuations perfectly!! (Sarconal)
Re: Cumulative Production Versus Annual Production Rate
That is the point I made in the June, 2007 article on HL:
In Defense of the Hubbert Linearization Method (June, 2007)
http://graphoilogy.blogspot.com/2007/06/in-defense-of-hubbert-linearizat...
The Russian HL plot did suggest that Russia should be declining soon, which is why I found the following article interesting:
http://www.themoscowtimes.com/stories/2007/07/10/042.html
Tuesday, July 10, 2007. Issue 3695. Page 5.
The Moscow Times: Alfa Report Sees Trouble Looming in Russian Oil Sector
By Anatoly Medetsky
Staff Writer
Nice work and that 13 forecast average for the Crude and condensate is a neat, very intriguing projection.
FF
I think that you will find his net export projections to be even more interesting. He did a low, middle and high case for both production and consumption, resulting in a range of nine estimates for when consumption = production in key exporting countries. It's not a pretty picture--to be delivered at ASPO-USA.
The three key points that we will emphasize are:
(1) Once a region peaks, only a small percentage of post-peak production will be exported (for the ELM, about 10%).
(2) Net Exports decline much more rapidly than overall production declines (-28%/year and -5%/year respectively for the ELM).
(3) A Net Export decline tends to accelerate with time (from an initial year over year decline of -12.5% for ELM to a final year over year decline of -47.5%).
Yes, this, but also hoarding. (I don't like the word with its negative connotation -- squirrels hoard to survive.) The rise in the price of oil will overwhelm the incentives to invest in extraction -- letting it just sit there will give a far better return (putting it in purely financial terms, which I don't like either). This too will amplify the dropoff as well as amplify the likelihood of far wider and bigger war.
We have plenty of use for the remaining oil even if its to expensive to waste driving SUV's. It will still be a valuable commodity for a long time. I doub't it will ever be cheaper than it is today for very long. The time scales of moving off of oil even with major breakdowns are longer than the depletion curve. So outside of total collapse oil will be a expensive item for the foreseeable future.
memmel
These are thoughts that I don't have the maths to quantify. As the Export Land Model kicks in, there will be a rapid distruction of the export capacity because no one can afford to keep up seldom used tankers. They might be used as loating storage tanks, or just scrapped out by the owners.
The same will be true for dock facilities, the chemical plants and rfineries will need a lot more storage if they are open, but many more will be scrapped and the specialty vslves and steels in the process piping recycled for use elsewhere. The field engineers and crews who know how to set up and operate the tanks and pumps will be scattered, perhaps to become people with entirely different job skills like farming or shoe repair. Permanent changes will soon hit the downstream segment of the industry. With changes like these, we might see quick, permanent demand distruction that permanently depressed the price of crude. Stuart Staniford was suggesting that this could happen in his post a couple of weeks ago.
Bob Ebersole
Good points. This is along the same vein of my concern about the oil industry itself in a high price oil environment. Expensive oil will have a negative impact on our ability to pump oil. Your talking about later on.
I'd say overall your probably right. Actually the worst problems are not crude itself but refineries. Its a huge investment to create and maintain a modern petrochemical refinery and the downstream plants. These do not scale well.
Well you just managed to lower my doomer quota a notch. I think your right. However I've been a big fan of micro scale reactors for chemistry but these make more sense with biofuel to plastic/jet fuel etc.
http://en.wikipedia.org/wiki/Microreactor
So believe it or not I'm still optimistic.
Actually on that matter most people think I'm a super doomer I'm actually not. Our current lifestyle is unsustainable and we need to make major changes. In the short term we will have problems but a sane modern lifestyle that is low impact is quite possible and doable. The only sad part is probably at a much lower population level than today.
Even high estimates of sustainable population indicate that billions will probably die so we are looking at more people dying in a short period of time then have ever died in our history even WWII pales in comparison. So on on hand I'm optimistic and think eventually we will live within our plant on the other outside of miracle we are probably facing the darkest period in human history.
So for me the saddest part of our current culture is it has encouraged a unsustainable living pattern throughout the world its not the wealthy man having problems fueling his SUV but the poor farmer who now cannot get goods to market or fertilizer because he became dependent on oil. Everyone is addicted to oil and we will pay the price.
memmel,
we will definitely pay a huge price, but the die-off predictions seem improbable to me except from the threat of war. About 1/5th of the world's population lives in India, Pakistan and Bangladesh on the arable land which is about the same square kilometers as the US east of the Mississippi. But they don't do it in 2,000-5,000 square foot McMansions driving a SUV, the diet is vegetarian mostly with dairy products, and the lifestyles of the poor aren't very long. In China I don't have a comparison of the arable area, but its equivalen. They have a bunch of non-arable areas like Tibet and the central Asian deserts of Inner Mongolia and other northern and western provinces (thats western from a chinese viewpoint) which don't have the water to farm.
I don't know any real way to estimate the wealth of the US, but we have 300 million people on about the same area. It lets us eat a carnivorous diet, have clothes and shoes only limited by our closet space, and closets the size of huts housing whole families in rural Asia. We have free public education through high school, and could be free in the Universties too with our social wealth and with accessable loans and grants. We fall down badly on public health, but its still better and more acessable than over half the world. We are rich, yet many people say our lifestyle is "non-negotiable" and we are threatening the world with resource wars instead of conservation. Bob Ebersole
The lifestyles of the poor aren't likely to be all that short, either, since life expectancy in India is 68 years. Less than the 78 years of the West, but not terrible. (For comparison, China clocks in at 73 years.)
From the links above, China's land is 15% arable, or 1.4m sq km, while India has 49% of its land arable (one of the highest percentages in the world), which gives them 1.45m sq km. So it's within a few percent.
For comparison, the US has 18% arable land, giving it 1.65m sq km, but has a shorter growing season (since it's further from the equator).
Does anyone have a link to the original statement? All I've ever been able to find is people's (angry) responses to it, so I've never been able to determine what the context of the statement was.
My guess is that Cheney was saying Americans' freedom is non-negotiable, not their SUVs, and I'd like to be able to confirm or deny that hypothesis.
I believe it was Bush that stated that the American Way Of Life is non-negotiable.
It was Bush, Sr., not Jr., and it was apparently said at the 1992 Rio Summit in response to discussions about limiting environmental damage (including GHGs).
Ref: http://www.sourcewatch.org/index.php?title=New_World_Order
Note: You can find other references as well but I can find no direct quote for this either. Of course, in 1992 not everything was immediately sucked up into the WWW either. However, the attribution makes much more sense (to me, at least) as it is not as vacuous as the supposed Cheney statement and is precisely the sort of thing I would have expected from Bush Sr. and the conservatives at that point in time.
I can find no credible evidence that Cheney ever made the statement that so many attribute to him. If someone has that evidence, I would be most interested in seeing it. Thanks in advance!
"The greatest shortcoming of the human race is our inability to understand the exponential function." -- Dr. Albert Bartlett
Into the Grey Zone
Ahh, that makes more sense.
Googling for lifestyle+not+negotiable turns up mostly links attributing the phrase to Bush Sr. at the 1992 Rio summit. The Cheney-related attributions are not only less numerous, but none I found gave an indication where or when he is supposed to have said that, making it almost certain that the source you found is correct.
Thanks for digging that up!
I think the Cheney quote that you have in mind may be this one "conservation may be a sign of personal virtue, but it is not a sufficient basis for a sound, comprehensive energy policy".
http://www.time.com/time/nation/article/0,8599,127219,00.html
Yes, but conservation is a silver BB. One more BB than the current energy "policy".
RobertInTucson
I haven't escaped from reality. I have a daypass.
As I recall the non-negotiable lifesyle statement was by George H.W. Bush back in the 80's when he was VP, but I sometimes have a bad memory for things like that. I won't use it again, but the point is a lot of Americans think that they are entitled to a wasteful way of life and that no one has ever had a different life in the US. Population densities can be a lot higher than they are currently without endangering life or health. And although much of the northern United States has severe winters, much of the south can have two crops a year. I was raised in Houston and live in Galveston, and around here we raise tomatos to be planted as sets right now and harvested near Thanksgiving and greens and lettuces grow all winter.
many people seem to lack a hisorical perspective. When I was a young teenager i asked my three surviving grandparents about their lives. My father's father was the eldest of 11 children, and his father ran a hotel by the railroad in Lincoln, Nebraska, had a quarter section of wheat (160 acres) and also was a carpenter. My mother's mother was the youngest of five and her father had a ten acre farm and worked in a shoe factory part time. My father's mother father was the only one in the bunch who very wealth, he had a prosperous business building streets in Omsha. My point is that most people in the US did several things to make a living, and just as Westexa suggests in his ELP idea, they ere all
Interesting that you should mention "seldom used tankers", just the other day I read about the richest man in norway (an owner of oil tankers) and his problems regarding alot of spare capacity in the tanker market. Freight rates are apparantly just about as low as they can go without the freighters losing money. The article says they are hoping for OPEC to increase production so they have something to put in their ships. Even more interesting, tankers are being converted to bulk freight already.
took me 20 min to find the article again on account of me thinking it was on na24.no I had read it, but it turned out to have been on e24.no :), but here it is for those of you who read scandinavian.
I suspect that the oil tanker market is biased by the fact that existing single hull oil tankers must be retired by 2010. So while new conformant double-hull ships are being built to replace existing single-hull ships, there is an excess number of ships to carry the expected oil. After 2010 it should become obvious, assuming a 2005 peak of crude plus condensate, that there is less oil to ship each year and that the less efficient crude carriers will be idle.
"Permanent changes will soon hit the downstream segment of the industry. With changes like these, we might see quick, permanent demand distruction that permanently depressed the price of crude. Stuart Staniford was suggesting that this could happen in his post a couple of weeks ago."
A non linear event. As the Power Laws kick in.
To be preceded by and accompanied with "Shock Doctrine"
(Naomi Klein).
Even today, Klein notes, Chile remains one of the most unequal societies in the world. It's shock therapy miracle shifted "wealth to the top and shock(ed) much of the middle class out of existence."
It's the way it works everywhere and a glimpse of the future: "an urban bubble of frenetic speculation and dubious accounting fueling super-profits and frantic consumerism, ringed by ghostly factories and rotting infrastructure of a development past; roughly half the population (excluded); out-of-control corruption and cronyism; (decimated) nationally owned small and medium-sized businesses; (mass) transfer of (public) wealth (and resources) to private hands (accompanied by) a huge (shift) of private debts into public hands." Inside the Chilean bubble was paradise. Outside was "The Great Depression." Bubble-benefitters reacted with "junkie logic: Where is the next fix?"
Israel attacks Syria's just delivered N Korea
cargo with a message to Iran.
How many times did you see this headline this week:
US Devalues It's Currency
Arkansaw of Samuel L Clemens
Bakhtiari is still looking good.
boy (girl) he sure is.
Thanks
FF
Leanan: I see that- and he forecasts an 11 mpd drop in the next 8 years. Between B+B (Bakhtari and Bernanke) we might see four digit crude oil by 2015.
Of course. That's for sure. Now, which will go faster, the dollar downwards, or the oil upwards? Bets are accepted.
More probably, petrol will be rationed by 09.
And deflation is the worry. Not inflation.
Crude could trade at $45. But a bottle of beer would cost
a dime.
See "The SIV's are worthless fro details."
Arkansaw of Samuel L Clemens
Actually I suspect we are going to see something rather remarkable instead of pure inflation or deflation. My suspicion is that certain products such as oil will continue to cost very much if decline outpaces demand destruction and due to inflationary actions by the US Federal Reserve so long as the dollar remains the world's currency but at the same time many other things will collapse in price. So oil might hit $150 per barrel and gasoline $6.00 per gallon but a $300,000 home might fall to $75,000 or lower.
Those who don't believe housing can fall that far, it already did fall even further once for the US south, especially in and around Texas, during the S&L debacle. I recall driving through Houston before I moved down here in the mid-to-late 1980s and seeing an incredible number of boarded up suburban homes visible from the interstate. It was a surreal sight. And yet at that time other products were still inflating in cost.
That is the future I expect, the "shock and awe" that mcgowanmc noted above that destroyed Chile's middle class and will probably destroy our own.
"The greatest shortcoming of the human race is our inability to understand the exponential function." -- Dr. Albert Bartlett
Into the Grey Zone
Housing consists of a lot of local markets so it is dangerous to offer generalizations. With that disclaimer . . .
The long run house price has been around 3x average family income. The current house price level is around 5x family income. So a 30% drop in prices is needed to get back to the long run average and a $300,000 home becomes a $200,000 home.
Markets tend to overeact going up and down. Gas at $6 will force a lot of folks to relocate, and will drive up prices for all other goods. Throw in a weak job market and the future looks like a world of hurt.
You are presuming business as usual. You are free to make that assumption. I am not, however.
"The greatest shortcoming of the human race is our inability to understand the exponential function." -- Dr. Albert Bartlett
Into the Grey Zone
I'd like to point out that the world creates 10% more goods and services in 2007 than it did in 2005 with approximately the same total liquids consumption.
See this IMF update
Globally the world is coping rather well (including most third world countries).
It's a dead link. Further, we have been discussing the future, not the last two years.
"The greatest shortcoming of the human race is our inability to understand the exponential function." -- Dr. Albert Bartlett
Into the Grey Zone
Sorry about the link in the previous post.
The IMF summary of recent world economic growth
I'm pointing out that world economic system has demonstrated it can grow strongly without increasing oil consumption.
That's also true for the developed world, as Germany demonstrates. Their oil consumption is down almost 10% in the last 10 years (EIA), and their total energy consumption is up less than 1% (EIA), but their real GDP is up something like 15% despite a flat-to-declining population.
Not the strongest growth, but still reasonable year-on-year per capita increases with stable per capita energy use and falling per capita oil use.
I'm pointing out that world economic system has demonstrated it can grow strongly without increasing oil consumption.
Only because it could compensate by producing more natural gas and coal. Peak natural gas is a few years away and peak coal is 2 or 3 decades away.
When oil production falls 10% below its peak, I don't see how natural gas and coal can compensate.
And I can point to 1979-1982 as a period when the world economic system did not grow and in fact contracted while oil supplies contracted. So what is your point?
My point is that there is obviously some boundary on economic growth as oil supply contracts. The fact that we cannot readily quantify that boundary speaks more about the voodoo called economics than it does anything else. Yet the boundary exists. Germany, often held up here as the efficiency wonder of the world, faces the same problem all efficiency gains face - an absolute maximum which cannot be raised. All they can do is use what they have better - 50%, 90%, 99%, 99.99%, etc. I don't know what numbers are actually involved but the absolute maximum economic activity that Germany can generate would be indicated by 100% usage of their existing energy stock (an impossibility but I point it out as the upper bound). To continue to grow after that would require more energy (increases in energy total)
Thus, energy is the key. If fossil fuel supplies contract, we can only get so efficient before further efficiencies lose cost effectiveness. At some point we must replace fossil fuel energy with other forms of energy in order to even maintain stability, nevermind growth. This is why there is so much discussion about nuclear, solar (of all types), biomass, hydrogen, etc., as ways of obtaining or storing energy.
Then on top of the contracting oil supply post-peak (whether now or later, once we peak, we've peaked), we have the further problem of climate change, which is directly entangled with fossil fuels.
So to continue to assume business as usual is your choice but I would caution that we appear to be on the verge of a combination of changes that may render the old business as usual mantra very obsolete. You are quite free to make whatever plans you choose based upon business as usual but I am not.
"The greatest shortcoming of the human race is our inability to understand the exponential function." -- Dr. Albert Bartlett
Into the Grey Zone
Not true.
I've pointed this out before, but see, for example here. World real GDP growth slowed during the oil crises, and I think one of those years might have had real per capita GDP drop, but world real GDP growth for 1979-1982 averaged about 2% per year, and never fell below zero.
I don't agree.
There are obviously problems for economic growth if oil supply contracts too quickly, but there's no evidence that economic growth cannot continue if oil supply declines at a manageable rate.
As you say, the problem is energy supply, and what the infrastructure is set up to use. If current uses of fossil fuels can be replaced - and all evidence suggests that they can, with some difficulty - then economic dislocation is a question of decline rate.
For that, of course, all the old questions about efficiency gains, renewable energy cost effectiveness, and so on come into play.
Pitt - Your capacity for hindsight analysis is impressive. For those on the front lines, would you care to use your obvious considerable abilities to identify how that transition will occur, absent economic parity, or heck, just expanding thinking to economic externalities?
You've assumed from the outset that substitution is ongoing. I did not. My entire point was that, absent substitution, there is a physical upper bound on economic growth as oil supply contracts. Of course, when you begin to substitute that changes things but when purely examining oil, there remains the boundaries described by physics. To get past those boundaries we must substitute, which was my second point. By confusing those two (and given the clarity with which you normally post I can only conclude that you have done this deliberately), you have created a convenient straw man to knock down. Golly gee, Gomer! Yet the physical energy boundaries I described remain and cannot be violated by you or anyone else reading this post.
Further, if you actually go and read the IMF and World Bank websites where they discuss "GDP" they simply measure GDP in dollars. Worse, these are all estimates, provided by governments who have incentive to make the stats look good (a well documented practice we have discussed before on these forums). Now if the absurdity of measuring GDP in dollars (whose value is constantly changing) does not immediately rise to grab your attention, then we're just going to have to agree to disagree here.
Then you come back around and agree with me that the problem is energy supply! So exactly what were we disagreeing about again?
"The greatest shortcoming of the human race is our inability to understand the exponential function." -- Dr. Albert Bartlett
Into the Grey Zone
Of course, because it is.
Making plastics with NGLs is substitution (NGL for oil).
Switching from oil to coal electricity generation is substitution (coal for oil).
People buying smaller cars is substitution (conservation for oil).
Switching to electric heat - industrial or residential - is substitution (coal for oil).
Increased use of public transit is substitution (coal or conservation for oil).
Substitution may not be happening fast enough, or may not be able to scale large enough, but it's certainly happening at nontrivial scale already.
Invoking physics only works when you're dealing with a closed system, and "ignore everything except oil" isn't a valid closed system. It's like looking at the decline of whale oil consumption and concluding that the economy must have collapsed; the effects of substitution cannot be ignored entirely.
Typically in terms of purchasing power parity (PPP), which is much more stable than currency exchange rates. The Euro has gained 50% against the US$ in recent years, but that doesn't mean the average European can buy 50% more, so the per capita GDP in PPP terms has changed much less.
If you're saying the world's major governments - and major non-governmental organizations which are set to watch them - have been lying for decades about GDP growth, I'll have to disagree with you.
And the shadowstats guy - he claims that the purchasing power of the average American has fallen by 40% in the last 15 years, yet the fraction of income spent on different categories of goods is almost exactly the same. That's not what his claim would predict, but it's exactly what the government's claim of flat real income growth for the middle class would predict, leading me to ignore his unrealistic numbers.
Well, a number of things. Primarily, we seem to disagree whether it's useful to examine oil consumption while pretending that substitution can't be and isn't being done, and we seem to disagree whether real PPP GDP growth is a valuable economic statistic or not, and whether such government numbers are trustworthy enough to be useful.
I just took Econ courses in college and the professors even acknowledge the data from the gov't is off. Clinton rigged the BLS numbers when he removed discouraged workers as unemployed. Inflation hasn't been measured correctly since they instituted substitution methodology. I don’t know about you - but steak is steak, not ground beef, so the standard has fallen while inflation has eroded the true value.
The gov't does lie and it's going to take a lot more reading outside econ/finance to figure it out. Perhaps understanding government in general will be a start....I recommend the Politically Incorrect Guide to History as a start.
We havent been growing except on paper....
GreyZone,
Houston in the late 1980's was a "world of hurt". Prices in some neighborhoods headed down permanently, while in others there was scarcely a bobble. The difference was that the residents of some retained their good incomes, while in others the jobs went away permanently because of changes. Here's two specific examples: Alief and West University.
Alief was a suburb built by jobs in working class oilfield industries-the manufacturers of high tech equipment used in oil and gas exploration Stuff like geophones, the acoustic equipment used by seismic crews to record the vibrations that are interpreted by geophysicists to interpret the underground structure of oil and gas fields. For a number of years seismic companies cannabalised existing equipment, then when the market picked up the manufacturers moved overseas. Bye, Bye excellent working-class jobs, hello job as an assistant manager of a telephone room selling some worthless product or another. So the mortgage was walked, and the savings and loan sold the house for cash to a hard working thrifty immigrant family, or to a landlord who moved in any kind of renter to keep up cash flow. Alief went downhill permanently.
West University was a beneficiary of the first wave of gentrification in the Houston area. It was built from around 1930 to 1950 as a middle class suburb, the middle management and professionals at Major Oil Companies were the original residents, people like the geologists working for Gulf, or the design engineers for refineries. The houses were modest by today's McMansion standards, but very nice homes in a stable suburb that is now inner city by location, upper class by residency. Downtown, the Galleria, Rice University and the Texas Medical Center are all within 5 miles. There was scarcely a bobble in prices, and within 3 or 4 years developers were purchasing the more modest homes, tearing them down and erecting million dollar cookie cutter homes. And, with the current downturn its happening again. My parents bought a house in Southhampton, the Houston area next to the east side of West U for $21,500 in 1959. We listed it last week and immediately recieved a huge offer as from a tear down/rebuild contractor.
So yes, I think that cities will be ringed with poor suburbs and the inner city real estate will be very expensive if we go through another bust-boom-bust pattern instead of a die-off or a thoughtful reordering of society, because it doesn't have to be that way. If we would get away from the internal combustion engine for electric trains the suburbs will retain much value, especially if we change US laws to require companies to build their manufacturing in the US intead of subsidising their move overseas to nearly slave labor and tax avoidance of their fair share of the costs of our society (this year's poster child: Haliburton, already incorporated in the Caiman Islands is moving its headquarters to Dubai).
But mostly, if we want to stop population growth, we need to educate people so they can see that its in their own best interest to have only one child. We need to figure out how to make them prosperous enough to help that child be healthy, happy and have a life where both the parents and child are useful. We have to end the gross inequality and poverty that has 1.6 billion people living without access to an electric light, clean water and elementary education on less than $2 a day. If we want to stop climate change we need to get them to leap-frog to renewables and quickly wean ourselves from fossil fuels to renewables, while we help the big oil companies, car companies and coal companies change the core methods for generating electricity and have a place in the world.
This is a very tall order, but if we decide its undoable and don't do anything we're going to die, and not pleasantly and so will our planet and species. Its just that simple.
Bob Ebersole
As far as stopping population growth, it might be worth studying Western Europe; they've already pretty much stopped it. See http://tinyurl.com/2dn3re, especially the "Rate of Natural Increase" and "Population Change 2007-2050 (projected %)".
Also, I remember a quote that I can't seem to dig up again. It's from a UN field worker, who said "the best contraceptive for the Third World is education and empowerment of women".
Here's a hypothesis: in an environment where people (especially women) have reasonable control over their lives and adequate education, and relative stability over a few decades, human nature will lead to self-limiting populations.
How long will the world be able to sustain the people who are already here? Reducing the net birth rate to 0 by 2050 still leaves the world with a population of 9 billion. If the world cannot support its current population for another 50 years (as I strongly believe) then playing with fertility rates may be ethically safe, but is ultimately pointless. Realistic fertility reductions alone will not reduce world population in the short to medium term. Such a reduction is required if we are to arrive at any kind of sustainable balance with the planet and the rest of the species that share it.
In a similar vein, trying to reduce birthrates through Demographic Transition by industrialization is also utterly unrealistic due to the energy requirements. See this analysis.
As usual, I'm not saying we should be the agency of increased mortality, just pointing out that the usual suspects of empowerment/education and Demographic Transition are forlorn hopes when it comes to achieving a sustainable level of human numbers (or, more properly, human activity) on the planet.
And there you have it.
We get these constant "modelings" which
specifically exclude events that bring those models into question.
Blind Spots.
Two reports which negate the vast majority of these models:
My point — and I think Hansen’s point — is that the “when” (i.e. the rate of change) matters a lot! One meter by mid-century would be an unmitigated catastrophe. Sea level rise would have to average 9 inches a decade from now to 2050, implying seas rising over a foot a decade by then — which could continue for centuries. Who could adapt to that?
http://climatefrog.blogspot.com/
And here:
To discover whether mechanization is cost-effective, we must insert a number for hourly wage. If the laborer is self-employed, however, the figure for hourly wage seems purely imaginary: If costs are rising, for example, can the laborers not simply pay themselves less? Only to a certain degree. The laborer’s wage is often as little as it takes to keep body and soul together, but anything less than that subsistence wage would make farming impossible.
The rise in the price of fuel, combined with the hourly wage, then, determines the cut-off point for mechanized labor. When farmers pay themselves a certain amount for 6 hours of work, but the price of fuel is equal to that amount, the 6:1 ratio has been reached, and it would be reasonable for the farmer to give up mechanization.
http://www.countercurrents.org/goodchild220907.htm
Arkansaw of Samuel L Clemens
Yeah, Bakhtiari's WOCAP is the model that convinced me: Peak Oil is past history (2006), IMHO. It'll be interesting to see how close his projection holds over the ensuing years.
-best
Nice to see CERA are still on the money - or not.
Well, they are professionals, after all.
Show Me the Oil!
Yeah looks just like an 'undulating plateau'
Does anyone know where all these new sources of NGL are going to come from. Is someone starting to exploit the frozen methane reserves? does anyone have a response to this ?
Thanks.
I'd say it's all those big LNG projects....
That's how XOM has replaced production the last 4 years.
Bring the gas out of the North Field (Qatar), strip the NGl's, freeze the Methane and sell it to China.
I don't like NGL's mixed with crude and condensate since it is just different stuff (not transport fuel).
FF
Thanks for that FF I have seen an explosive growth in LNG production in the Timor Sea too. Freezing the methane must be a very energy intensive process in Qatar. I doubt that it is sustainable at current levels.
One thing that would be interesting to include in these charts is an indication of the price of crude oil fluctuations as they correlate to production volumes. It helps answer the question of whether these declines are a matter of supply/demand inconsistencies, or whether we're actually hitting some kind of production ceiling. From what I can see there's a clear pattern suggesting we're at a ceiling.
In that chart there are two clear declines in output. One is from roughly 1997-1999, and the other is roughly from 2001-2002 (I don't have the numbers used to generate that chart, so I'm just eyeballing it).
Inflation adjusted oil prices for the first decline:
1996 - 22.40
1997 - 20.39
1998 - 12.66
1999 - 17.78
Inflation adjusted oil prices for the second decline:
2000 - 29.54
2001 - 23.39
2002 - 23.78
2003 - 28.42
Clearly these are cases where we saw a decline in production because supply was higher than demand. Prices reflect that disparity. This makes perfect sense. Given relatively unconstrained supply, invariably, increased prices lead you to produce more to take advantage. Fluctuations happen as demand and supply come in and out of sync. What's telling about our current situation is that, against all precedent, production is flat in spite of prices going up substantialy.
2004 - 54.93
2005 - 47.97
2006 - 58.30
From 2003 to 2004, we saw the cost of oil nearly double and, as a result, production did increase a lot leading to a price decrease of roughly 25%. In 2006 though, the price climbed right back up and yet there's been no indication of producers pumping more to take advantage of the higher price. Now we're up to $80/barrel, a 37% increase over 2006 prices, and yet we see no evidence of increased production.
Bottom line is that, if they could pump more oil out of the ground, they'd be doing it. Since 2003, the price has nearly tripled and yet production is flat. So this suggests one of two things:
1) They cannot produce more oil in spite of the incentives
2) The cost to produce available oil is higher and thus the incentive, even at these prices, is not there
Either is indicative of us being at the peak.
I think there's an alternate explanation beyond your two.
1) They cannot produce more oil in spite of the incentives
Bottlenecks
From 1986 to 1998, oil prices were trending down. The incentives for new production and capital were low, especially when there were still projects and equipment from the heady days of the early '80s around. When oil hit bottom in 1998, it crushed every segment of the oil industry. During the 1998-2002 period, major production projects were not begun because the industry feared a return to $10 oil like in 1998. Absurd, in retrospect, but it was a very real fear. Demand for new equipment or personnel dried up. The five-year lay-off led to a loss of skilled workers in the field and a decline in the amount of capital equipment on hand - rigs, ships, etc - and a loss of ability to make new capital equipment.
Now they are playing catch-up. In the face of high prices and high demand, the bottlenecks have moved back from the well-head to related support industries. Now there are severe constraints on the manufacture of rigs and drilling ships, platforms, pipelines and recovery equipment, and especially in the training of experienced personnel.
The same factors in E&P affected refining. Falling oil prices cut into the margins that refiners could charge. Refinery capacity grew slowly and steadily from 1992 to 1997, and had begun to accellerate in 1998 - but the price crash put that expansion on hold for several years. Refining capacity is now back in line with that '92-97 trend - even though demand has grown substantially faster. There were lots of posts here last year about "Peak Refining". Even though more refineries are being built or expanded, it's perfectly reasonable to assume that oil producers are looking to the market and deciding that accelerating production in the face of limited refining capacity increases is foolish - it would just drive down crude prices, letting refiners capture the market premiums that limited final product supply is creating.
So there's an alternate theory to explain high prices and low production: bottlenecks in equipment and refining that destroy the incentives for greater production.
See this:
Orange = refining
Purple = Production
Pink = Price
1965-2007.
Here's a bigger version.
After the oil embargoes, refineries had substantial excess capacity. That has all vanished, to the point where we now have about as much refining capacity, proportional to production, as we did before the 1973 oil shocks.
Refining is the biggest bottleneck, and it's not growing fast enough to keep up with demand.
I'm not sure this proves its a bottle neck. Look to me we are back where we were before the oil shocks. I guess I don't see a issue either way. I'd note the ability to grow capacity in the past seemed pretty good pre-oil shock. I don't recall high oil price and complaints about capacity before the oil shocks and the spread is lower then than now.
Now I will say I'm not sure either way. The only way we could tell is for people to add more capacity and we would see oil production increase. It would seem to me if its a true refining bottle neck we would see the price spread between crude and finish products widen but the price of crude should not be high. Crude prices would have staid stable or declined. While a premium would have been paid for refining.
So I don't see this proves any thing either way. Refining is tighter than in the past yes but its actually higher than pre 1970 oil shocks so ...
With regard to refining and production related to price, additional insight might be possible if the mix between light-sweet versus heavy sour in both refining and production could be shown. There appears to be increasing conflict between available refining capability and mix of production.
Joe
Not really the countries with the ability to refine heavy sour crudes tend to buy it because of the price advantage. The US has fairly decent heavy sour capability.
The interaction of refining and supply is complex but globally its not clear that refining capacity is a bottle neck. If it was oil would be 20 dollars a barrel and the minimal OPEC cuts would not have mattered. The assertion that its THE bottle neck and peak oil is not happening does not seem to fit.
Now we are seeing refining problems potentially crude quality problems etc etc. Especially in the US but the US imports a significant amount of gasoline and we have not seen that this is a issue. If refining capacity was that tight we should have seen at least some problems importing.
I'm not saying that refining is not and issue but the claim that its the major problem does not seem to be true.
At peak one would not be surprised to see refining capacity tight since by definition we are producing the maximum amount of oil. But since the peak a few years ago oil production has slowly dropped and capacity has held steady or increased worldwide. Thus capacity could have only been the determining factor back in 2004-2005 time frame. If we had the capacity then and we are producing less oil now then by definition we have more spare capacity now then in the past.
We have had no indication from the market that they cannot accept more oil because they lack the ability to refine it.
With the high prices you would think that Non-Opec countries would be producing like mad and they certainly have had enough time to increase production to some extent. We have had high prices for what 4 years or so. And no response from the market ?
Excellent work, as usual ... but what does it all mean?
The IEA demand prediction line is what the supply will have to be if the world economy is to continue to grow as normal ... they say ~1.6% a year ... which is probably not far off.
Interestingly, if you draw a line from 2002 supply rate with 1.6% growth they are bang on target now!
However, if you draw the line starting in 2005 they are already several million barrels a day too optimistic! This implies world growth has been declining for two years or so.
The area under the IEA demand line is how much oil, in total, will be required if the world economy is to continue to grow as we have been used to ... as growth is vital to our way of life the IEA is tasked by the OECD to ask 'is there that much oil left in the world?' ... answer, Yes! ... but importantly, can it be got out of the ground at the rate required and supplied at a profit? Not at the moment it seems, so far (for two years) 'peak oil' or 'peak-lite' as predicted by TOD is correct, not the IEA!
Because of the steep rise in prices over the last 9 years or so we know that supply is constrained at the moment ... in the rough general direction of all the other lines on the graph ... either for geologic reasons or above ground reasons (or most likely a bit of both!)
If it continues like this, diverging from the IEA prediction, the graphs show world economic growth can be expected to fall away rapidly.
Geologic peak production is 'best case' ... the amount of oil available for import predicted by WestTexas' ELM is also 'best case' ... let's hope that above ground (political?) contraints that adversely affect both aren't too severe.
Clearly, from the graphs, we can expect negative economic change but it is the rate of change that is important ... to fast and we have disaster ... recent financial and global climate chaos events don't bode well!
Xeroid.
Actually, that's not true.
Cumulative production through the first half of 2007 was 70m barrels higher than the same period in 2006, even while a mild winter lowered the oil consumption of rich countries by 60m barrels - unsurprisingly, oil prices were (cumulatively) lower than in 2006, even before adjusting for inflation and a weaker US$. Up until recently, there was no incentive to pump more oil - OECD stocks were higher than in 2006, prices were lower, and putting more crude on the market would likely just depress prices and end up costing money.
That's changed recently, with the sharp spike in oil prices. If prices stay up, one would expect to see increased oil production. If that's possible, of course.
(Links for these numbers are here.)
Actually it is true and you are the one who is dead wrong! Average produuction through the first half of 2007 was 260 thousand barrels per day less than the same period in 2006. Using 181 days for the first six months, this means that 47 million barrels more oil was produced in the first six months of 2006 than in the first six months of 2007. The data can be found here:
http://www.eia.doe.gov/emeu/ipsr/t11d.xls
You perhaps were talking about "all liquids". But when we are talking about the price per barrel one must only consider crude oil. There is no such thing as price per barrel of all liquids.
If fundamentals are driving the price of crude oil then only crude oil can affect the price of crude oil.
Ron Patterson
Of course; it doesn't make sense to use anything else when talking about total supply.
Not true. If there is an oversupply of liquid fuels, that will drive down the price of all liquid fuels, including crude oil. That was exactly the situation we were in for the first half of 2007.
Not true. From the market's perspective, it's irrelevant whether those extra barrels are one liquid or another; they're all roughly the same to the consumer, so any oversupply means price pressure on all. Had anyone pumped more crude in the first half of the year, all it would have done was push prices down even further.
Just think about it for a moment - if someone pushed another 5mb/d of NGL onto the market, either the price of crude would have come down or refineries would have used that NGL, lowering the amount of crude sold. Either way, a non-crude product is directly affecting the market for crude, since there exist other products that are largely substitutes for crude oil.
That is an absolutel wrong. The additional oil to crude when all liquids are added is mostly bottled gas, primarily propane. Propane is used mostly for cooking and heating in places that do not have natural gas lines. Consumers of crude oil use it for transportation. That is 70% of crude oil is refined for transportation, gasoline, diesel and airline fuel. The rest is used to make plastics, asphalt, and other products that cannot be produced from bottled gas or ethanol.
The market for bottled gas is an entirely different market from crude oil and the price of these two commodities do not move in lock step together. When the supply of crude oil goes down the price will soon move in the opposite direction, regardless of what the supply of propane does.
And just what would those substitutes be? What other products can you use to make jet fuel, diesel fuel or gasoline. Or for that matter asphalt or plastics. Pitt, that is what the great debate is all about. Are there alternatives that can replace crude oil? You seem to think there are. I just flat don't believe it. If there were then no one should be concerned about peak oil. I am concerned.
Ron Patterson
I think PItt is right. Most liquid fuels can be substituted for each other, certainly more than they are right now. For example, ethanol is currently substituted for around 5% of our gasoline supply, could be at least 15%, so increased ethanol production will continue to reduce our need for traditional crude/gasoline. Clarifying this further, it was the peak in all liquids in jul/aug 06 that pushed crude stocks to a record high and price down by 1/3 over the following several months... Note that it is not necessary for ethanol (or bio-diesel, NGL's, or whatever) to be able to make all things that crude makes (those random length hydrocarbon chains are certainly versatile) as long as it displaces one or more of the major uses.
Of course, politicians and others are learning that there are limits, eg surging corn planting for ethanol production is reducing our production of all grains for food and export, just as droughts world wide are slashing production, and thereby driving up consumer prices for most foods. Happy farmers leads to unhappy consumers... Well, what's a pol to do? You can't please them all all the time anyway, might as well focus on the donations.
ethanol is currently substituted for around 5% of our gasoline supply, could be at least 15%
Not true.
The correct figures are 3% and 9%, not 5% and 15%, because ethanol has 60% of the energy density of gasoline.
So when 1 gallon of ethanol is produced & consumed it displaces 0.6 gallons of gasoline and 0.4 liters of air.
Orimulsion is 30% water, a none energy source as well.
So, total liquids includes considerable quantities of air (or it's equivalent) and failure to account for this loss in energy leads to errors of analysis.
Alan
Orimulsion isn't produced anymore (link).
I dug around a bit to check. What I found was:
In other words, there appears to be strong competition between some crude products and some NGL products, and hence a strong correlation between their price.
Hence, as I said, the extra barrels of liquid fuels produced in 2007 vs. 2006 and the lower prices they fetched meant that there was no incentive for crude producers to pump more.
One of the components of NGL is natural gasoline, a gasoline blending component, and those industries using ethylene feedstocks NGLs compete for include plastics.
So one of those substitutes you're looking for is NGLs.
False dilemma fallacy. Even if there are products which can substitute for crude oil - and there certainly are - then that doesn't solve all the problems. As is said on here about 10 times a day, there's concern about the rate at which those alternatives can be produced.
Very nice, thanks Khebab. That 2007 column in your tables is a real eye-opener.
Great work, Khebab.
A question, I don't know if you or someone else can chime in with an answer:
I get the distinct impression, based upon the significant revisions made to data going back a decade or more, that recent production numbers are far from being absolutely "hard" and reliable. If they, too, will be subject to revision and thus must be understood to be somewhat estimated, is it possible to calculate (or at least make an educated guess) as to what a statistical margin of error might be? For example, you indicate that annual average production for all liquids for 2007 was 84.28 mbpd. Might we infer that to be +/- what?
This question obviously has some relevance for determining when exactly when the peak has occurred. For example, if the margin of error (within one standard deviation, let's say) should happen to be something like 2 mbpd, then that 85.54 mbpd for July 06 might or might not hold up as being the actual peak month. It would be helpful for some of us, I suspect, to get a handle as to what margin of error we are actually looking at here.
I agree, a box plot/candlestick chart dating back at least 15 years would be very nice, but where to get the data for that?
One idea: going back historically to previous production AND forecast data and plotting those against actual revised production along with a confidence interval of each (not necessarily technically a confidence interval, but showing the margin of error against actual actualised production).
Then again, who has time for that, even if somebody had all the data? :)
However I do agree that it would be most interesting, possibly even very telling (the spread of margin of error as a function of time for various entities, like IEA/EIA).
Regarding precision, there is a large uncertainty (probably the second decimal is meaningless). Just look at the disparity between the IEA and the EIA from the last OilWatch:
or uncertainty in Saudi Arabia production which is almost 0.2 mbpd:
IMO, The precision must be around 0.5 mbpd for total liquids.
Also, there is a significant variation between countries about the exact volume contained in one barrel of oil.
Thanks, that is helpful info
Great work - wonderful to see all the guesses and speculate on which ones look best at predicting the future.
Suggestion: why not show when projections were made in the table for all punters, instead of just a few?
Bakhtiari looks good because, in addition to being on target, his slope is consistent with the current plateau... ASPO/Chris are close, but clearly expecting a real surge to have started Jan this year... somebody somewhere must be disappointed. Well, they could be just a year late, after all... or, maybe we just need a few more rigs...
The second table listed, World Production, helps explain why the markets aren't too concerned that we are down from the world production peaks. It has happened before, post 9/11, in the late 1990s, and the steepest decline in the early 1980s. They are probably just looking at it as something that happens now an again for a few years, and then production bounces back up.
I think oil in the $80's suggests there is indeed a lot of concern - but not yet panic. Having prices this high with nothing extraordinary (gulf war, major hurricanes, SA terrorism) happening is MAJOR - how quickly we become desensitized to what was a moment ago seen as the extreme! I agree, however, that the fact of past periods of production flatness or decline, together with adequate supplies (for now) of oil in the developed world have taken the edge off what otherwise might lead to panic.
Excellent work, as usual.
The two-year long plateau wasn't foreseen by any of the models. Is this because the HL method only applies to an aggregate of mature fields and thus isn't really applicable in a world in which lots of relatively small new fields (eg Angola) are coming into production all the time ?
I understand that the MegaProjects ansatz is meant to deal with this phenomenon, but then his numbers look systematically too optimistic, so there must be something wrong there as well.
All in all, things are beginning to look worse than all but the most pessimistic predictions of a few years ago. For this reason, whilst I reckon governments have been PO-aware for at least a decade, they may nevertheless have been caught out by the rapid deterioration since 2005.
Re: why not show when projections were made in the table for all punters, instead of just a few?
You're right, I can add a column.
http://science.reddit.com/info/2s3pw/comments
http://digg.com/business_finance/September_2007_Production_Forecasts_and...
http://slashdot.org/firehose.pl?op=view&id=296991
please help us spread Khebab's work around the web. thanks.
Excellent. Thanks for keeping us up-to-date Khebab.
One question:
Would you be willing to release a limited data set publicly for others to play with?
For example, EIA/IEA total liquids and similar for
ASPO, Skrebowski & Bakhtiari.
Something in common excel/cvs/xml form that one could plot in various other ways to find possible correlations (and hints for causation).
Not that we can improve on your wonderful statistical processing, but it would be a useful tool for learning.
Yes, I will. It just a question of formatting.
Thank you for your hard and vast work, Khebab. Very much appreciated by everybody around here I think.
I just ran the MER data from a previous version (several months ago when they changed the from monthly dat for OPEC to "not available") and other than changing some of the non-OPEC production over to OPEC production from 1973 to 1993 for a net change of "zero", the non-OPEC numbers dropped by about 500,000 barrels per day (in '90,'91, and '92) while OPEC picked up 500,000 barrels per day. The magitude was somewhat lower in the late 80's.
As for 1994 onward, OPEC "gained" more than non-OPEC lost...not alot but the swing between the two IS pretty dramatic. The net increase per year (and this is calculated for each month) are as follows (new total average is also included:
Note: for each of the above years the increase in OPEC over non OPEC is equivalent to the "new" annual production numbers as well as corresponding for the individual months. But this change is only ~0.3-0.4% of the total. So, we see a "slight" increase for all these years
After 2004, although the shift from non-OPEC to OPEC is large, the effect on the total production number (so far) is small.
What has changed is the slope of the curve in the post May 2005 era is somehwat more negative than it was with a more pronounced downslope than we saw for previous iterations.
And so the new conclusion is? That at some point production of a finite resource is going to decrease? That many forecasters will be wrong? That if someone makes enough forecasts that one of them will be right or somewhat close? The interesting news would be something like a new technology for discovering oil, or improvements in processing and recovery, or changes in consumption habits, or changes in government policies, or successful nuclear fusion, or a 100x increase in the efficiency of solar panels or,... a myriad of things. But playing with the graphs doesn't do anything. In the scope of the problems that are being unleashed by decreasing energy supplies it really doesn't matter in the slightest whether the peak occured in 5/05, 6/06, 7/07 or 10/10 or even 12/12 or even 2025. The bleak future is starting. And the best we can do is play with graphs?
Which is why I think the most important speaker at ASPO-USA is Alan Drake.
Why? Who is he?
Flavius Aetius
Electrification of Transportation
http://www.energybulletin.net/14492.html
Streetcars 100 Years Ago
http://www.familyoldphotos.com/tx/2c/chadbourne_street_trolley_san_an.htm
Cities Rediscover Streetcars
http://www.usatoday.com/news/nation/2007-01-08-streetcars_x.htm
AlanfromBigEasy
Don
Well, for those that think that the peak is some years off, it matters a lot to them. As I tell the most adamant of peak oil deniers is all they have to do is produce 6 continous months at more than 74.3 million bpd to prove that the peak has not yet occurred.
Know something? I don't think it's going to happen, in which case we're nothing more than "historians" and anow it's a matter of the steeepness of the slope and what the descent will look like.
We can try to show (with graphs) what we think and what options may be available. But until the issue of getting food and shelter (via the energy issue) outweighs OJ Simpson, Brittney Spears, and Survivor (but people will be indoctrinated into the concept of being "voted out"), no one will really be able to break through the noise machine (at least not in the Ulcered Sphincter of Asserica).
Oscar,
this is an interesting comment, in light of the fact that the MSM is using terms like "peak oil pranksters" to divert attention from the hard facts contained here.
What else is there to do, but present the data along with the best available models?
Ideally, we'd like to really know the shape of the FF demand and supply schedules, so that we could infer from Khebab's exhaustive analysis just how much the price will spike, versus how much demand destruction to expect over time.
And even those price projections could be dismissed as "playing," since the markets actually turn on unknown-unknowns, from weather to wars. But information is power, even when imperfect, and it allows us in the community to:
- spread the word
- make our plans
- know when, and whether, to bail.
Khebab,
1. I do not see Ace listed in your tables though his forecast is present in one of your graphs. Am I missing something?
2. Excellent summary as always. Thank you!
"The greatest shortcoming of the human race is our inability to understand the exponential function." -- Dr. Albert Bartlett
Into the Grey Zone
Good catch, I forgot to modify the table and add a reference for Ace. I will make a modification later.
I just modified the table and added a reference.
Love the graphs, Khebab (the links to the ASPO newsletters are broken)
Oups! the ASPO keeps moving around their old newsletters.
Good work really appreciate all the contributions to the site from everyone especially those with time and thought behind them.
This partys in full swing but more people are arriving and drinking the beer faster than the crates are turning up. A group of people want to make a punch with something they found under the sink and there is a very uneasy feeling growing in the kitchen, but the people in the lounge have the music turned up so loud they can't hear the raised voices.
Nice analogy...add to that, everyone is hoping the party will continue, at least for a few more hours (let me get mine! then I'm out...).
Looking at the production charts I can't help but notice that past plateaus/declines seem to correlate fairly well with economic activity, for example the recessions in early 1990's and 2000's seem to be reflected in the production numbers.
Is the current plateau just a reflection of the true weakness in our economy for the past few years (despite the stock market histrionics)? I know this is probably asking alot, but it would be fascinating to see the production charts correlated with GDP.
Cheers,
Jerry
It has been noted here before that this plateau or decline is unusual in that all previous declines and plateaus can be accounted for by economic activity.
Put bluntly, there has never been a period of broad economic growth while at the same time experiencing a decline or flattening of production.
The longest "flat spot" is in the 1990-1993 time frame around Gulf War I (and the impact on fuel prices) and the economic weakness recession that transpired.
The question will be a chicken and egg type of question: what causes economic conditions to stall this time? High energy costs or lack of growing energy supply? In either case it porbably won't make much difference simply because they'll both look the same to most people as are the outcomes.
US gdp growth has been quite robust since 2002, tho maybe next year not so good. The real story is asia, especially china, now the #2 oil consumer (partly because goods that used to be produced in the us are now produced there, meaning we are exporting our conusmption even as internal oil growth is around 1.5-2%). It is not US growth that is the story, it is china, imports up around 1%/month.
An even better way of looking at it is price. If plateau is on accountof lack of demand (why produce what consumers don't want) then price is stable or falling. In the current epoch price is surging. OPEC used to be happy with price at 22-28, we are 3x this level, indicative that demand continues to outpace supply. And, healthy us stocks are not a good indication - to maintain stocks at this happy level we must bid against consumers in other countries; current price is simply todays result in the marketplace.
Variations in the GDP and in the oil production/consumption are correlated:
Year-on-year variations of the GDP per capita (in blue) and the consumed oil barrels per capita (in red). The light dotted gray lines indicate recessions. src.
Khebab, this is a most interesting graph as it shows that even during the shocks of the 70s and 80s GDOP impact was modest. This indicates that there must have been a large amount of slack (inneficiency) in the system.
It remains to be seen what impact a semi-permanent decline in GDP has on society...
Regards, Nick.
An Excellent summary. The next few years will be very interesting as we better understand where all this is going.
When I was putting together my presentation on peak oil, I recall that I found that Laherrere changed his peak oil date this year (2007) to 2012 from 2018 which was his estimate in 2006.
Retsel
Do you have a reference?
The following are Laherrere's graphs from his presentation "Uncertainty of data and forecasts for fossil fuels and annex on Climate Change" at:
http://www.hubbertpeak.com/laherrere/Castilla200704.pdf
I think his "crude oil" (excl. extra heavy) for 2Tb remains at c. 2012 on both years (2006 and 2007). Only his 3Tb all liquids model shows a peak at c. 2018, AFAIU.
Interesting that Laherrere's referenced paper concentrates on the uncertainty in the data sources, driven to polar opposites by technical and political pressures.
For example, if you look at the discovery data published by Shell Oil, the overall averaged profile is between 30 and 40% higher than Laherrere's discovery chart pictured above. But as noted, this features the small print "boe", which is the ambiguous "barrels of oil equivalent".
from
http://www.theoildrum.com/node/2712
Right! The BOE is why it differs from that other commonly seen C&C discovery plot:
Interestingly, both of those plots show peaks far enough in the past that the typical observed lead time from peak of discovery to peak of production (about 40 years) places peak right now or in the very near future.
And further, just as with Hubbert's initial plot, increasing the total URR significantly, which actually happens when we consider BOE vs pure C&C (I think WHT once remarked that the Shell plot came out somewhere just over 3 TB of liquids versus just over 2 TB for C&C) only moves the peak forward by a few years! WHT showed that with the shock model a while back too, as I recall. The difference was not so much in when we peaked but the shape of the downslope. And that is a major question facing us today. A steep downslope could be catastrophic. Of course, from a climate change perspective, a mild downslope could be catastrophic so we might be damned if we do and damned if we don't. ;)
"The greatest shortcoming of the human race is our inability to understand the exponential function." -- Dr. Albert Bartlett
Into the Grey Zone
Here is an overlay with a discovery curve (in blue) that I reused from the Shell discovery data.

If I used the same extraction rates as for the Shell fit the production curve will get suppressed from Laherrere's maroon curve, and as you say, if I up the extraction rate to fit production better, then, yes, the downslope would come out more severe.
Ok, this is the same result presented by Lahèrrere in 2006 and included in my analysis. I find his forecast for all liquids very unrealistic. If I understand his chart correctly, his red curve represents NGL, ethanol and other biofuels. It's very unlikely that this category will reach 40 mbpd.
I read the curves as blue: all liquids, green: crude oil-extraheavy, red/magenta: liquids-(crude oil-extraheavy), the numbers don't add up otherwise. I assume extraheavy would include tar sands and oil shale. Also included under this curve would be natural gas liquids ,gas to liquid, coal to liquid, and various biofuels.
Superb work, Khebab.
Could you confirm that Canadian Tar Sands are included in Other Liquids? (I'd think so but I'm not sure.)
Beach Boy, Canadaian Tar Sands are included in C+C. That is, the oil from the tar sands is just curde oil and counted as such. Therefore they are included in all catagories.
"All liquids" is C+C plus "Other Liquids." Tar sands oil is not "Other Liquids", it is crude oil. Other liquids is natural gas liquids, ethanol, biodiesel, palm oil, Orimulsion and anything else the IEA or EIA can think of to count. Tar sands oil is not "Other Liquids", it is crude oil.
Ron Patterson
Hi - How does "other" compare with "unconventional" as used in chart 8 of the lastest Oil Watch?
as Ron said.
Except for natural gas liquids, which is a separate series on chart 8, right? Nice work by the way.
Correct, NGL is not in "Other Liquids".
Here in Europe all is fine, the sun is shining. The gasoline prices are lower than last summer. So what´s the problem with you US doomers? :-)
We use a lot more oil than you do...
Actually the barrel price in euros is not as bullish as in dollars, and part of the current high price can be attributed to the weakness of the dollar. That may be the result of a complex self regulation of oil demand : it's more efficient to reduce first american consumption thant european one. If they lived with a standard european life (which is not that bad ;) ), American could divide their demand by two. But unfortunately this is due in large part to their urbanisation and ground allocation, and it is not easy to change rapidly. European cities are much more concentrated and easily connected with electric trains than American ones.
BTW Khebab, excellent summary as usual ! I am astonished that in France at least, the media never mention that oil production has been stalled for two years. They speak a lot of hurricanes, Nigerian guerilleros , or Iranian nuclear facilities (although all these explanations are not working very well these days, so they simply don't give any ! ) , but never of this simple, obvious fact : oil production does not increase anymore despite a strong potential demand. Is it the same in US?
well in any case, it seems likely that the great dive is planned around 2012. mayas fans will surely be happy with that ;-).
Oh I forgot : interestingly, EIA's figures for 2007 are now 84.64 Mbd on average, compared with 84.5 for 2006. They're now only 0.14 Mbd away of recognizing officially that 2006 could be the year of the peak. That would be a scoop wouldn't it?
http://www.eia.doe.gov/emeu/steo/pub/3tab.html
Gilles, it appears that the left hand does not know what the right hand is doing here. The more accurate figures, in my opinion anyway, are found in the EIA's International Petroleum Monthly. There, for all liquids, the average for 2007 is already 332,000 per day below the average for 2006.
http://www.eia.doe.gov/emeu/ipsr/t14.xls
But then again, that is "all liquids". Oil, that is crude oil plus condensate is another story altogether. Crude oil actually peaked in 2005. The average crude oil produuction for 2006 was 233,000 barrels per day below the average for 2005. However the average for 2007 is even lower. The average crude oil production, so far, for 2007 is 647,000 barrels per day below the average for 2005.
http://www.eia.doe.gov/emeu/ipsr/t11d.xls
Ron Patterson
right, the IPM does not coincide exactly with the STO... although they give them now with two digits after the period ! but IPM does not give a forecast for the whole year does it?
The US media is pretty much brain-dead. We're far too interested in what Britney is doing to be bothered with peak oil.
Indeed. Even though we´re all too much dependent on oil, the US is way too depedent on it.
25 barrels/year*person for the US and
12-15 barrels/year*person for the European countries
speaks for it self.
After living in the US for a year and visiting a number of different times, I´ll never figured out why americans WANT such a car dependent country.
Walking, bicycling, trains, light-rail; it´s not only more energy efficient, it helps create better, more livible citys. And by walking and bicycling you lose weight in the meantime...
Btw, I know there are exceptions. Portland is a good example.
And CO2 taxes are going up in Sweden with 0.06 sek per kg CO2, close to one cent. Index compensation, eg inflation compensation, CO2 tax and sales tax add up to an increase of 0.2875 sek per l, about 4.4 cent per l or 16.6 cents per gallon if I got the funny unit right. Diesel taxation increases with 8.4 cents / l and fuel oil with $44.8 per m3. This is calculated with the dollar at 6.52 sek.
This is done to finance about an additional $153 million in various anti CO2 measures in the government budget for 2008. In addition to that all energy and environmental research budgets I have seen so far in the budget are inflation compensated. This is not much compared with private research and investments but it probably helps with making more private investments possible.
Higher fossil fuel taxes are a logical way to finance anti CO2 measures but it do hurt politically since half of the governing right wing parties had lowering the fuel taxes as an electoral promise in last years election.
Total government debt were amortized with $10276 million 2006 and the 2007 prognosis is $13343 million. The government debt were 43.1% of GDP in 2006 and the prognosis for 2007 is 35.6%. This has made it very hard to explain why the government dont spend much more money on environment, infrastructure, military, healthcare, and various groups dependant on government money. One of the major reasons for not spending billions on infrastructure has been the white hot building market, there is hardly any unemployment within building and very little in other "hard" industrial sectors.
The main focus have been and still is on lowering taxation on work, especially low paying work to get people back in the labour pool. This is also helped by lowering government benefits to unemployed etc and that is extremely unpopular with manny unemployed and our leftish media. More people working and less money used for uneployed have added to the budget surplus but more importantly we will enter the next economcial downturn with more people doing productive things and a fairly strong budget. The total taxation level is going down significantly, I dont remember the exact percentage but we are approaching the european medium in taxation.
We have even done some small simplifications of the government organization within the first year. The goal is significat savings in internal authority cost and simplification of the bueraucracy resulting in a 25% saving in the business cost for handling government and municipiality bueraucracy. There is hope this also will make it easier to start new businesses when 1/4 of the red tape is gone.
Overall it has been a great year since the election. The left wing opposition is shell-shocked, media is screaming blody murder, manny people hate change and the polls for the governing right wing parties are close to a disaster but I think we are on the road to restarting the old dynamics of the Swedish society. Getting people once again used to change and doing new things is extremely important. Hopefully the next three years will be prosperous and change accepted.
American and European energy consumption
There was a study on this in Science about two decades give or take ago. T make a long story short, the author concluded that the largest differences were:
(1) America has a far more extreme climate. For example, many residents of Germany or France would be taken aback by temperatures that reached -40 for a day, but this happened twice while I lived in Michigan. I was out in it--the 40 knot wind was also impressive. However, I dressed very carefully. Even on the Mediterranean, many allegedly modern hotels lack (functional) air conditioning, but in much of America in the Summer hotel rooms would be unusable (say, Temperature above 90 F, humidity the same) for months at a time without it.
(2) America is much farther from East to West and from North to South (though when the study was written there was still an iron curtain, so "Europe" was smaller), so shipping investments are larger.
Phillies: It appears the Science authors missed the incredible sprawl of suburban wasteland. They obviously haven't heard of Kunstler.
Yes, this is why there were no hotels, office buildings, department stores, or large public buildings of any kind in the US until air conditioning was invented. Before that, no one could survive south of the Mason-Dixon line.
Look at an old Hotel sometime - there is a window that opens above the hallway door called a transom, and the outside windows open too. The problem is that we've been building structures that cannot be ventilated for decades now.
EDIT: Should have been a reply to Phillies.
Twilight,
I would urge examination of the economic history of the southern United States before and after WW2, Carrier having introduced practical home air conditioners in that period. Prior to World War 2, much of the South was something of an economic backwater. Air conditioning changed all that. There are parts of the country and seasons in which ventilation is helpful, but they are a bit limited.
Yes, there was cross ventilation before WW2, but cross ventilation is basically worthless when the temperature and humidity get above 80 or 85, especially in areas that are relatively windless in Summer such as the American south. (This windlessness issue came up on these pages a while back, in that places in America that are most suited for wind power do not include much of the American South.)
With respect to degree days, I would urge comparing with the original article, to which I no longer have access.
George
I would have a hard time accepting that AC was the cause of the massive demographic and economic changes that have occurred regarding the US South. There are simply too many varuiables to make that claim.
Someone quoted numbers here on the heating/cooling degree days for a variety of major European and American cities a while back. I crunched those through a bit, and it turned out that the US was only higher by 10-20%, which is not enough to directly account for much difference.
Air conditioning is probably more used in US than in Europe (I remember having seen air conditioning switched on in US hotels when the outer temperature was 25 °C, which is for me a perfect temperature to feel comfortable ! ) , but it is more linked to electric power consumption than oil consumption. Electricity is mainly produced by coal,natural gas and uranium in both sides. I think the difference in oil consumption is mainly due to transportation : more commuters, longer distances between home and work, more goods transported and more air travels between distant cities. The real problem is that modern USA have been built during the oil era, whereas European cities are much older...
Massively so.
Probably true; however, little of that is due to the physical size of the US, and certainly almost none of the private-vehicle consumption. Plenty of US states have sizes and population densities comparable to EU countries (e.g., California has a density between France and Germany), but the states are much more similar to each other in fuel efficiency and oil consumption than any of them are to EU countries.
The US uses more oil than Europe because it wants to, not because it needs to.
Yes and no. Many European cities were heavily damaged in WWII and underwent extensive reconstruction. Certainly, the remaining parts of the cities were denser, but I would argue a great deal of the difference is due to the price of gas (first due to lesser wealth, then due to taxes) and policy decisions (such as the heavy investment into public transit in many Soviet-bloc countries).
It's not so much that US cities were built when oil was available as built when oil was - and still is - cheap. People in the US have little incentive to conserve oil, since it's so cheap, and that leads to wasteful behaviour. Until the one changes, I don't really expect to see changes in the other.
Khebab,
Thank you for another fine post. I have one question:
In the notes for your top graph, you say,
I only count 12 models in parentheses. Is there a model missing, or are there really only 12 (or am i misreading this).
The only reason I ask is that an incorrect divisor could change the curve.
In fact I used 14 forecasts because I included Staniford's Low, middle and high estimates.
For review:
Ghawar is expected to do a nose dive. The most optimistic recent news out of Ghawar was a 300,000 barrel a day project in an area that was previously set aside as a lower quality reservoir. Most of the northern superporous reservoir rock was wet from water injection.
Cantarell production is in deline and KMZ is expected to follow by 2012.
Burgan oil production peaked.
The UAE is going into EOR processes that should produce a brief gushing of oil. The nationwide in the UAE oilfields is expected to occur by 2012. Dubai production is falling as I write.
One of Iran's fields was discovered a hundred years ago and is not yielding oil like it used to.
Russian internal oil consumption may be growing faster than new production increases.
In spite of favorable predictions for the revival of North Sea oil production, the declines were coming faster than some predicted.
The United States cannot cut back on consumption even though the price of oil has doubled within about three years. Chinese auto purchases were growing more than 20% per year; from sources posting news on the web.
The devaluation of the dollar by loose FED monetary policy and big government spending increases financed by treasury securities instead of taxes will cause pain at the pumps. The usual suspects will be blamed; the oil corporations who have not added three trillion dollars worth of debt in less than seven years.
Khebab/all....as usual, awesome work and comments.
re Rothman/Barrons 9.17.07
http://online.barrons.com/article/SB118981090977228146.html?mod=article-...
guy throws around alot of numbers and statements....(Liers number but numbers never lie :<).....specifically his comments on supply growth and Saudi production:
What about the demand from China and India and the notion that supplies have peaked?
The data doesn't show it. If you look at the International Energy Agency industry data and you do an apples-to-apples comparison of non-OPEC supplies, supplies from all of the countries outside of OPEC, you will see growth rates are running substantially higher than people believe to be the case. Growth in non-OPEC supply this year looks like it will be about 1.3 million barrels a day, and that number is about twice what people believed would be the case. And the Saudis clearly have the barrels available. They are bringing on new fields. Khursaniyah is coming on in the fourth quarter, Nuayyim next year and Shaybah next year and Khurais in 2009. These are fairly big additions.
Why is it when I read the US financial press, I feel like I'm reading the tabloids? Anyway, can someone steer me to the most recent work on TOD on SA new production? Ghawar depletion is pretty clear, even to the likes of Rothman. TIA
So far you are off by almose 1 million barrels per day. If you go here: http://www.eia.doe.gov/emeu/ipsr/t11d.xls and subtract "OPEC 12" from "World" you will get Non-OPEC supply. So far this year Non-OPEC supply is up 383 thousand barrels per day over last year. That is a long way from 1.3 million.
Ron Patterson
That depends on which data you look at.
I would argue that the most appropriate table to use is the one labelled "World Oil Supply" (i.e., all liquids), and that the most appropriate time periods to compare are first-half to first-half, in order to avoid bias due to seasonal factors. Accordingly, then, non-OPEC oil supply is up by 1.5% over 2006.
All of those are well below 1300kb/d, though. The trend on the month-to-month increases is that they're increasing, but I still doubt we'll see a sustained 1300kb/d improvement over 2006, much less a year-on-year average difference. That being said, Jun06 to Jun07 increased over 1100kb/d, so it's not impossible we'll see 1300kb/d for a few months.
Don't forget that the first half of 2006 was still significantly impacted by the hurricanes of 2005. Some of what you see just reflect recovery, not addtnl production.
Oh, absolutely - increased production from the US accounted for half of that extra 70m barrels.
The point is, though, that overall production was up, consumption was down (due to the mild winter), stocks were higher, and prices were lower. We can't say that the world could have increased production, since we don't know for sure, but what we can say is that there wasn't much incentive to do so.
OPEC's production in the first half of 2007 was 130m barrels lower than the same period in 2006. Was that because they weren't able to produce more? Or because they didn't want to put more price pressure on an already-weak market? Opinions vary, but as far as I can see the latter interpretation is the simplest one, and requires the fewest assumptions.
Your ref seems to be using bad data. First, as noted by ROn, although some peak oilers had been expecting substantial new non-OPEC oil this year and thru 09, this wall of oil has yet to appear. Non-OPEC supply is nearly unchanged while c+c peaked on May 05 and all liquids in jul/aug 06, supplies down since then, and sufficient, for me, to explain the rise in price once the jul/aug 06 bulge was drawn down.
Regarding demand, he sees oil demand growth in china of 3-6%. Well, crude imports are growing 1%/month while their refinery product exports are crashing, with no end in sight, and while car sales are so high that the world's auto makers are all rushing into the chinese market. Does he think the new buyers plan to park their cars on the curb?
THe big change is from SA... they cut 1Mb/d so that the rest of OPEC could boost maybe 500k/d. I wonder why, given that they continuously say oil is too high? Maybe they couldn't help it. THey do indeed have new projects coming on line; the question is, will they generate a net gain given the substantial declines in North Ghawar and their other very old fields? They themselves said decline is 6-8%, or over 600k/y. IMO they will never avg above 9Mb/d for six months or longer, indeed each coming project will only temporarily arrest the decline.
Your source thinks current high price is on account of hedge fund bulls buying; if this were true the futures markets would reflect this investment, with future crude prices higher than spot (contango). However, markets are in backwardation, futures are lower than spot, the markets seem in fact to be in line with your source and are betting on lower demand/higher supply...
REfiners are of course aware they can buy the future at lower cost, presumably they are buying at spot because they really want the stuff... Note too that tapis price has been higher than nymex for months, reflecting high asian demand... frankly, if US refiners didn't bid as high as they are, they simply wouldn't get what they want. Fairly typical supply and demand.
Dave: All that Barron's article displays is the unprecedented level of ignorance surrounding this subject, that a BS artist like that can spew such nonsense and get away with it. OTOH, no one has to read it so good for him.
This rocket scientist throws out a price target of $45-what is his Euro target price- 25 Euros, maybe 35 Cdn dollars?
Thanks, Khebab!
Would you or anyone else know the reason for the jump in the other liquids, bold in bottom right corner in the table below?
click to enlarge
Other liquids is calculated by subtracting the sum of C&C and NGPL from total liquids. From Jan to Apr the other liquids is about 3 mbd but then jumps suddenly in May and June. Other liquids includes refinery processing gains, biofuels and some XTL/GTL.
There is a seasonal pattern for "Other Liquids" probably because of Ethanol blended with gasoline, production is always maximum in Q3 and minimum in Q1:
We could go above 4 mbpd in July 2007.