| Moving Forward - Towards A Kinder Gentler (Smaller) Oil Drum | The Oil Drum | South America Enters the LNG World |
Middle East OPEC reserves revisited
Posted by Euan Mearns on December 3, 2010 - 10:32am
According to the BP statistical review of world energy 2010, the big six Middle East OPEC oil producers (Saudi Arabia, Iran, Iraq, Kuwait, Unite Arab Emirates (UAE) and Qatar) had 743 billion barrels (Gbs) of proved oil reserves (1P) between them, representing 56% of reported proved global oil reserves. Knowledge of this bounty provides OECD governments with much comfort. The trouble is there is no chance these figures are correct. A simple analysis of the published BP data that corrects reserves for historic production and questions reserves revisions that took place during the 1980s points to a proved plus probable (2P) reserves figure in the range 160 to 545 Gbs for this group of countries. It is high time that BP noted in its statistical review that the reserves reporting standard of ME OPEC countries is different to that used by the OECD.

Figure 1 ME OPEC reserves history from BP statistical review of world energy 2010. Chart is copied from an earlier version produced by Rune Likvern.
What is wrong with ME OPEC reserves reporting?
Many regular readers of The Ol Drum will be all too familiar with the following arguments raised against the validity of ME OPEC reserves as reported by BP, this post is written for those who have not heard the story before. Issues with reporting standard fall into two categories, 1) large upwards revisions to reserves that took place during the 1980s and 2) flat line reporting of reserves over time (Figure 1). I will deal with flat line reporting first, but first a few words on reserves reporting standards and mechanisms.
It is important to know that there are two very different reporting standards in operation. The Security Exchange Commission (SEC) guidelines (pdf warning) are very conservative and will normally lead to gross under reporting of reserves in immature oil fields and provinces. The Society of Petroleum Engineers (SPE) guidelines (pdf warning) are much more flexible, with multiple categories, offering companies and countries the opportunity to estimate what may reasonably be expected to be recovered ultimately.
BP specifically reports proved oil reserves (1P) attaching this definition to the spread sheet:
“Proved reserves of oil - Generally taken to be those quantities that geological and engineering information indicates with reasonable certainty can be recovered in the future from known reservoirs under existing economic and operating conditions.”
This is paraphrasing the SEC guidelines and yet it is quite clear that ME OPEC countries are reporting figures more allied to SPE 2P category that includes proved + probable and are non compliant with the standard adopted by BP.
Flat line reporting
A simple scheme for annual adjustments to reserves is as follows:
reserves at start of year
+ new discoveries
± revisions
- production
reserves at end of year
Since 1980, the 6 ME OPEC countries in question have produced 198 Gbs of oil between them, and yet the flat line annual returns (Figure 1) demonstrates beyond any reasonable doubt that reserves have never been adjusted down for this production. Adjusting reserves for production produces the picture shown in Figure 2 suggesting that ME OPEC oil "reserves" are at most 545 Gbs, well below the declared amount.
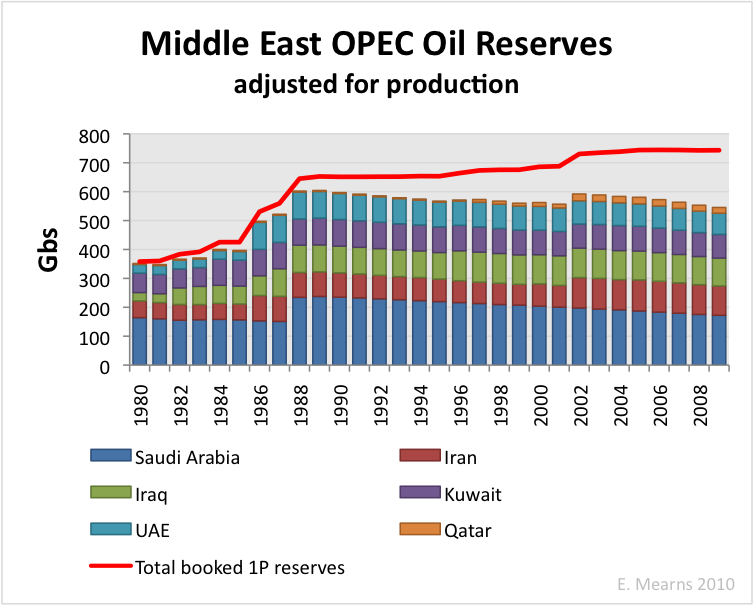
Figure 2 ME OPEC reserves history from BP statistical review of world energy 2010 adjusted over time for cumulative production.
1980s revisions
All companies and countries are entitled to revise reserves estimates in light of new technical data. The most recent revisions in Middle East OPEC took place in 2002 where both Iran and Qatar presumably booked natural gas liquid reserves in the North Field / South Pars Field that spans the Qatar - Iran border. There is nothing wrong with that. What is more often contested is the validity of large upwards revisions to reserves made in the 1980s, starting in 1982 and ending in 1988 (Figure 1). Prior to this time several of the large multi national oil companies operated in the Middle East and with the nationalisation of the oil industry reserves estimates were revised by the National Oil Companies (NOCs). On the one hand, it is sometimes argued that the upwards revisions were justifiable to take into account higher recovery factors expected through application of new technologies such as horizontal wells. On the other hand it is often argued that the reserves adjustments were entirely politically motivated as countries vied for OPEC production quotas. It seems likely that both arguments may be valid and it is impossible to know exactly where the truth lies.
It is worth observing some of the history between Iran and Iraq. The Iran - Iraq war began in 1980 and ended in 1988. In 1980 Iran had 58 Gbs and Iraq 30 Gbs of reserves. In 1982 Iraq raised its reserves to 59 Gbs giving it a narrow lead. In 1986 Iran retaliated with a rise to 93Gbs giving it a clear lead. But in 1987, Iraq retaliated with a knockout blow raising its reserves to 100 Gbs. The war ended in 1988 and the reserves of these two countries have barley changed since. By 1988 the reserves of Iran, Iraq, Kuwait and UAE were all roughly the same, approximately 100 Gbs each, only Saudi Arabia was permitted to bid higher with 260 Gbs.
How much of this is real and how much of this is fantasy it is impossible to say apart from in Kuwait where more details emerged from an unlikely source in the form of IHS Energy. At a conference I attended in 2006, IHS energy presented their view of Kuwaiti reserves based upon their proprietary database of fields. They showed this chart (Figure 3), suggesting that the large upwards revision in Kuwait in 1984 was bogus and that the pre-nationalisation figures from the 1970s were a more faithful reflection of reality. I wrote a post on this rather important information that can be read here.

Figure 3 IHS Energy estmate for 2P Kuwaiti reserves.
It would be wrong to assume that all of the 1980s revisions are equally bogus. The more than 3 fold uplift in Iraq is certainly questionable, however, Saudi Arabia uplifted their reserves by only 50% after reportedly conducting much technical work. It is however reasonable to assume that the pre nationalisation numbers provide a lower bound since these were compiled with the participation of international oil companies (IOCs) who tended then to be conservative in reserve reporting conventions employed. In Figure 4 the pre-nationalistion reserves figures from 1980 are adjusted for production.
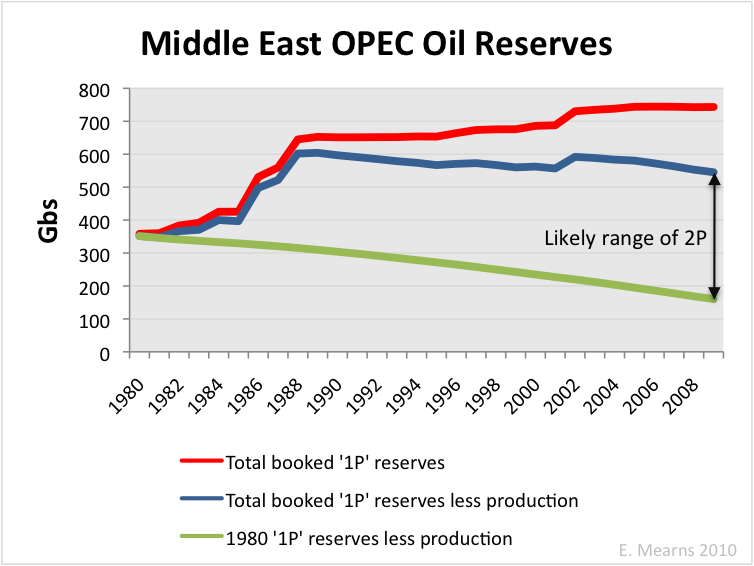
Figure 4 Comparison of official ME OPEC reserves with official reserves adjusted for production and pre-nationalistaion reserves figures adjusted for production. The arrow gives the likely range of 2P reserves.
This exercise provides likely upper and lower bounds for ME OPEC reserves that lie between 160 and 545 Gbs. My best guess would be that reality lies somewhere in the middle at around 350 Gbs, less than half the official figures.
Conclusion
It has long been held that ME OPEC countries are reporting as reserves what would normally be regarded as ultimate recoverable reserves (URR) give or take a few 100 billion barrels of politically motivated revisions. It must surely not be beyond the wit of very smart folks who work at BP to see that it is wrong to classify ME OPEC reserves as "proven" and to give these same weight as the OECD reporting standard. It is high time BP (and other government agencies) got its house in order and noted on the Annual Review spread sheet the anomalies in the ME OPEC reports that are so glaringly obvious.
Note added 13:00 GMT Monday 29th Nov
In the comments Phil Hart linked to this earlier analysis he did of OPEC reserves stating:
Claimed OPEC reserves are overstated by approximately 340 Gb.
Phil arrived at this conclusion via a different route, and it applies to all OPEC, but the 6 ME producers discussed here do dominate the OPEC accounts.
Contact
- Content: editors at theoildrum dot com
- Tech support: support at theoildrum dot com
License

This work is licensed under a Creative Commons Attribution-Share Alike 3.0 United States License.
I'm not quite sure what a reasonable depletion rate for OPEC-6 countries would be, but let's say it's 5%, which would give the following production numbers:
743 Gb = 102 Mb/day
545 Gb = 75 Mb/day
160 Gb = 22 Mb/day
Now which one of these hypothetical production numbers is closest to reality? You guessed it, it's the bottom one.
I just checked and the sum of these six countries average daily production in 2009 was 22.8 mmbpd. Saudi and Iraq probably have a bit in "reserve". Applying depletion to supergiants and the way they are developed also requires some caution. The 160 Gb number is likely too low.
I agree with this statement. On the other hand, there's cause for suspicion when a region's depletion rate is much lower than other places in the world. Either OPEC-6 has fields that are very difficult to extract, or they are severly holding back production, or their reserves are much lower than stated.
All three are true - heavy sour fields, reserve capacity, reserves over stated.
So, the oil is difficult to process, they do have some reserves (and can extend the 'plateau'), and production will decline much faster when that held-back reserve is exhausted?
Craig
Do any of these oil producing countries have the leeway to play a game of last man standing?
UAE per capita annual income=$19,198.30 per person
Probably not.
I am guessing that the are producing to capacity, in order to stay in one place.
Just like the Red Queen in Alice in Wonderland.
It is all the people.
"If you have got people you have got troubles.
"You have got to get rid of the people"
Joseph Stalin.
From the first issue of the Hubbert Center Newsletter by the late L. F. Buz Ivanhoe - 1996
-------------------------------------------------------------------------------
... the much-quoted
annual ‘BP Statistical Review of World Energy’s’ tables and graphs on ‘Distribution of oil reserves in 1994’ contains a
fine-print footnote:
“...(reserve) estimates contained in this table are those published by the Oil and Gas Journal
(O&GJ) in its issue of 26 Dec. 1994, plus an estimate of natural gas liquids (NGL) for North
America.”
O&GJ RESERVES
One must go back to the O&GJ annual year-end reports to check each of the oil producing nation’s oil and gas
reserves / production. On close examination, one soon runs into problems with the O&GJ numbers. The O&GJ merely
compiles the RESERVE information provided annually by each country’s government source. There is no way for the
O&GJ to check on the accuracy of foreign reports. To many foreign ministries, the O&GJ requests for reserve data was
either a sensitive state secret or a nuisance chore that no one was critically concerned about. Due to lake of guidance or
ignorance, a common answer was apparently “same as last year”. (52% of the 67 nations listed in O&GJ’s 25/12/95
report gave the identical oil reserve numbers as on 26/12/94; many for several years.)
Some nations’ numbers are obviously gross approximations. IRAQ doubled its reported reserves from 47 Bbo to
100 Bbo (Billion barrels of oil) in 1987, the number that IRAQ still lists for its reserves. Who could prove IRAQ wrong?
And what difference did it make to IRAQ if the world’s economists and planners were misled? By 1989 all of the OPEC
nations had raised their reported reserves to maintain everybody in line for their “oil quotas”. All of this increase was
creative bookkeeping “political reserves” rather than new oil discovered. These are the figures that bolster the apparent
change as reported by The Economist, that the world potential of reserves / production (R/P) increased from 35 years in
the 1970’s to 43 years in 1995.
Operating oil companies pay only limited attention to details of the O&GJ reserve numbers which are the domain
of academic planners. It is simply impossible to check foreign reports. Caveat Emptor! If the USA / UN will not trust
IRAQ’s Saddam Hussein to correctly report details of his military might - how can they trust his report on IRAQ’s OIL
RESERVES (his economic might)? The same question might be raised for all nations who get foreign government and
World Bank grants and loans based on large reported RESERVES. In summary - don’t trust the O&GJ (or BP’s) reserve
numbers implicitly - some 300 Bbo of political reserves may need to be subtracted therefrom.
In short - OPEC nations’ claimed reserves are intended to increase their “OPEC PRODUCTION QUOTAS” -
not to evaluate their oil as in other countries. Consequently, relating OPEC’s with other nations’ oil reserves is like
comparing apples with oranges (see Figure 1)...
http://hubbert.mines.edu/news/Ivanhoe_96-1.pdf
Maybe we can build some 'political refineries' to produce some 'political gas?' Oh, wait! They already do that in Washington, D.C.
Craig
Craig - Sadly this may be an update of the old Communist Russia joke: "They pretend to pay us so we pretend to work".
Today the exporters pretend the reserves are there so the consuming countries can pretend to plan the future. So the politicans are re-elected, the masses are somewhat content and the TPTB continue BAU. All works well...until pretend time end, of course.
Most of Kuwait's increase in reserves are meant to be from the Burgan field, yet Michael Lynch puts Burgan in decline in this article from last year.
http://www.glgroup.com/News/Burgan-fabled-Kuwait-oil-field-in-irreversib...
Shame there are no Wikileaks with the real situation.
Actually you can make a reasoned assessment here.
First, the Iraq reserve figure is likely between 30Gb and 59Gb. When they did their 1982 reassessment, they ended up with 1Gb more than Iran. Obviously politically motivated, but if they had added in new technology and got a figure of 63Gb, they would have reported that instead. It would then be a number they could stand behind and justify. The fact that it was 1Gb more suggests they couldn't concoct a plausible reason for a better figure. It basically screams politics and places the true number less than 58Gb.
Similarly the 100Gb is too round a number for anyone to take seriously.
The 93Gb number is interesting. Is it a true assessment of where Iran thought it was with new technology and higher recovery factors? Possibly, but it's noticeable that it's a round 60% more than their previous number. Therefore the possibility is that they were signalling what they thought was the true possible uplift in Iraqi reserves - 48Gb.
If I had to put numbers on the true reserves, I'd go with Iraq 48Gb and Iran 58Gb - for a total of 106Gb, rather than the claimed 193Gb. Still all guesswork, but I'd suggest you can gain information from inference to actions taken.
"Similarly the 100Gb is too round a number for anyone to take seriously."
I don't think a "round" number is indicative of anything except its being a round number. Would 99 Gb, or 101 Gb be more believable? Even so, the numbers are not believable to me. It would be interesting to see how OPEC reported reserve figures, year by year, compare with those of non-OPEC countries. Would we see a fairly flat series of figures there? Does anyone have that kind of graph?
It is not the 100 that is hard to believe. If you have above 100 and starts to consume, at some point you must pass 100 on the way down. What is hard to believe is they stay on 100 year after year. It is very hard to believe 100 is not just a number they made up.
Interesting to revisit this topic again Euan. I had a look at the World Energy Outlook 2010 reserve assumptions. The IEA assumes 850 billion barrels of OPEC reserves per 2009, of which 450 billion barrels will be produced between 2009 and 2035. In case of your upper bound for Middle East (Approximately 80% of OPEC reserves) their base case scenario will be too optimistic as most middle-east OPEC reserves will have been produced by 2035, not half as assumed by the IEA.
Rembrandt
Agreed.. thanks Euan for a new post on this issue.
Like you, I can't believe how so many people can ignore so much simple evidence for so long.
The oil companies have reams of data prior to nationalisation to know the situation as it stood thirty years ago. We know that discoveries since then are not on the same scale (you can't hide Ghawar's even from a rock hammer!). Yet we got ourselves so addicted to their oil that now nobody can call their bluff.
In this post I used similar evidence and a lot of extrapolation to estimate reserves were overstated by 340GB, which would put it smack in the middle of your 2P estimated range. If we could add this one bleeding obvious correction to everything else the IEA is now getting right they would have the perfect piece of peak oil analysis.
Phil
that seems to be at odds with what saleri stated in feb '04:
it appear your figure 4 totally ignores reserve additions. the popular view seems to be that new reserves are not being found. where does this idea comes? an uncritical reading of 'twilight' ? certainly not true for saudi arabia.
since 1989, saudi arabia has announced more than 50 named fields or new reservoirs in existing fields. here is a list of fields in the hawtah area, the published reserves where available and the source.
hawtah area
field		year	eur	      source
hawtah 	        89      1.5 gb           1
dilam		89	n/a
ginah		90	1.0  gb          1
raghib		90	.60 gboe         3
nuayyim	        90      1.0 gb           4
hazmiya         90      .75 gboe         3
hilwah(gas/c)   90       n/a
unm jurf	93  	 n/a
nisalah		93	 n/a
abu markhah	94	 n/a
layla		94	 n/a
abu rakiz	95	 n/a
usaylah		96	 n/a
abu shidad	96	.617 gboe        3
shi blah	96	 n/a

Total			10-30 gb         1
                        15    tcf        2
1- SAUDI ARABIA - The Main Fields Producing Heavier crudes
http://www.allbusiness.com/mining/oil-gas-extraction-crude-petroleum-nat...
2 - SAUDI ARABIA - The Geology Of Saudi Arabia.
http://www.allbusiness.com/mining/oil-gas-extraction-crude-petroleum-nat...
3- Giant oil and gas fields of the decade 1990-1999(google books)
4 –kingdom of saudi arabia oil and gas, Mideast oil and gas(pdf)
http://oilandgasdirectory.com/2009/research/Saudi.pdf
the research goes on........
I think you got the boot on the wrong foot. It is Saudi Arabia that totally ignores revisions to its reserves for new discoveries, but of course adding in revisions would make the absence of adjustments for production even more glaring - but Qatar and Iran got away with it in 2002.
Saudi are reporting what most would view as 2P or 3P. You just have to consider Ghawar. The whole of the southern third of the field (Haradh) stood undeveloped for decades. No wells, no process facilities etc. But the oil in Haradh was still included in their reserves - no way that complies with SEC 1P definition.
There's a good debate to be had about Saudi reserves and production and I will return to this theme sometime soon. These charts are pretty old now, but still quite relevant I think.
Forecast numbers are production capacity. Actual production may be lower depending upon demand. Click all charts to enlarge
http://europe.theoildrum.com/node/2910
let me try this again. clearly, saudi arabia has been finding oil and gas, how this fits into reserve additions on a year to year basis is another ballgame.
i doubt saudi aramco books reserves on each new discovery, until ooip is at least delineated. i also doubt that saudi aramco reconciles reserves on every field every year, more likely, imo they update their modeling results(and reserves) on major fields on a rotating basis.
as long as the ooip was delineated and technology exists to produce the oil economically, proven undeveloped can be included in 1p by sec guidelines. i also note that bp used the term 'reasonably certain' as opposed to the new sec adopted guideline 'likely to increase or stay the same in the future'.
don't we have a hubert linearization more recent than '05 ? production has been more or less flat.
KSA producing below capacity so production data dropping a bit below the line. Quite sure that will come up again at some point in future.
As you know, new field discoveries and field development programs don't stop when a region peaks; the problem of course is offsetting the declines from the older larger oil fields.
A case in point is the North Sea. Sam Foucher found that if we just look at new oil fields whose first full year of production was in 1999 (when the overall North Sea peaked, within a broad seven year plateau), the new oil fields had a production peak in 2005 of about one mbpd, versus an overall North Sea peak of about 6 mbpd in 1999. However, this one mbpd of new production, equivalent to about one-sixth of the peak rate, only served to slow the overall decline down to about 5%/year (1999-2009, EIA, C+C).
Regarding Saudi Arabia, for me the smoking gun is their rapid increase in production and net exports from 2002 to 2005, in response to rising oil prices, versus lower annual production and net exports in the 2005 to 2010 time frame (relative to 2005), in response to generally rising oil prices. Annual oil prices in the 2006 to 2010 time frame have all exceeded the $57 level that we saw in 2005 and four of the five years showed year over year increases in oil prices. This decline in production, relative to a prior peak, in response to rising oil prices, is what we also saw after Texas and the North Sea peaked.
Here are the average Saudi net oil export numbers per day by year, versus average annual US spot crude oil prices (EIA):
2002: 7.1 mbpd & $26
2003: 8.3 mbpd & $31
2004: 8.6 mbpd & $42
2005: 9.1 mbpd & $57
2006: 8.4 mbpd & $66
2007: 8.0 mbpd & $72
2008: 8.4 mbpd & $100
To the extent that there is excess capacity worldwide (that can be delivered to markets and refined), I suspect that it largely consists of what Matt Simmons called "Oil stained brine."
saleri claimed that saudi aramco had 80 fields with 23 on production in '04 and that 1/2 their proven reserves were in the undeveloped catagory.
my guess is they have some room to run.
i find saleri's discussion entirely plausible. many on here acknowledge that producing wells at too high a rate can result in reduced recovery and more water production but don't seem to connect that with a low depletion rate resulting in better recovery and reduced water production.
In any case something changed in 2006, either: (1) The Saudis decided to voluntarily cut production and exports, and to support higher oil prices outside of their specified price range* (contrary to what they generally did in previous years and decades) or (2) They were at least temporarily unable to keep increasing their net exports, in response to higher oil prices.
My vote is Door #2:
http://www.energybulletin.net/node/16459
Texas & Lower 48 oil production as a model for Saudi Arabia & the World (2006)
Peaks Happen (Texas & Saudi Arabia):
http://farm1.static.flickr.com/55/145186318_27a012448e_o.png
*In early 2004, the Saudis were on record as supporting the OPEC price band of $22 to $28, and they significantly increased their net exports in 2004 and 2005.
Wasn't Robert Rapier arguing that there is a door #3?
I believe he argued that KSA observed rising levels of oil storage in 2006, and believed that oil prices in 2006 were in a bubble. An expected imminent popping of the bubble in prices meant that they reduced production in order to prevent a complete collapse in prices.
The Saudi oil minister in early 2006 claimed that they couldn't find buyers for all of their oil, "Even their light/sweet oil," and presumably the upward trajectory in oil prices, from an average annual price of $57 in 2005 to $100 in 2008, was evidence of this lack of demand?
We have seen Five Years of Saudi net oil exports well below their 2005 rate of 9.1 mbpd, while annual oil prices have exceeded the $57 level that we saw in 2005 for Five Years, with four of the five years showing year over year increases in oil prices.
There is of course the simple explanation, i.e., Peaks Happen (except of course on Fantasy Island, where oil fields don't deplete, and where Michael C. Lynch lives).
The Saudi oil minister in early 2006 claimed that they couldn't find buyers for all of their oil, "Even their light/sweet oil
KSA was saying that they didn't see excess demand. This is consistent with the "fear of bubble" theory, right?
an average annual price of $57 in 2005 to $100 in 2008, was evidence of this lack of demand?
Price increases after 2006 don't tell us anything about KSA perceptions in 2006. Except, of course, that they were wrong about an imminent price collapse: the price bubble didn't pop until 2008.
where oil fields don't deplete, and where Michael C. Lynch lives
He's not part of this discussion: this theory was suggested by Robert Rapier.
------------------------------------------
You may not agree with the "fear of bubble" theory, but it does constitute a 3rd door, right?
Maybe if they had just curtailed production for a few months, or a year or so, but to show five straight years of lower annual production, and especially dramatically lower net exports (relative to 2005), versus annual oil prices all higher than 2005, with four of the five years showing year over year increases in oil prices?
This is especially noteworthy given their obvious efforts to curtail the rise in oil prices in the 2002 to 2005 time frame.
As noted up the thread, Peaks Happen. From our May, 2006 paper:
http://www.energybulletin.net/node/16459
But the lower production levels since 2008 could be accounted for by the world wide recession, right?
Yes, I think that's likely. Saudi Arabia probably does have some spare capacity now.
They might still be able to raise production, even. I believe Stuart Staniford came to the conclusion that the Saudis were not at peak, but could not rapidly raise production when prices spiked (due to infrastructure issues). It appears they are using the current lull to build that infrastructure (to take advantage of the lower prices for labor, steel, etc.) So if there's another crunch, they may be able to ramp up production a bit more than last time.
I think the Saudi Arabian "spare production capacity" is largely hypothetical in nature. Certainly, they can drill extra wells and build extra production facilities, and then not use them, but as their fields undergo a steady decline (and they are all declining), that surplus capacity will gradually get used up as the extra wells and production facilities are put into use to offset the inherent production decline.
The problem is that the decline in production capacity is masked by the fact that the production levels are remaining constant. They don't notice that their reserve capacity is disappearing since they aren't using it.
This is what happened in Texas during the 60s, and led to the American energy crises of the 1970s. It could be happening in Saudi Arabia now.
I agree that the Saudis may have some spare capacity now, but as noted up the thread, I suspect that it largely consists of what Matt Simmons called "Oil stained brine." But I am principally basing my production/price arguments on the 2002 to 2008 inclusive production/price data. More importantly, I think that the net export/price data really tell the tale.
Here are the average Saudi net oil export numbers per day by year, versus average annual US spot crude oil prices (EIA):
2002: 7.1 mbpd & $26
2003: 8.3 mbpd & $31
2004: 8.6 mbpd & $42
2005: 9.1 mbpd & $57
2006: 8.4 mbpd & $66
2007: 8.0 mbpd & $72
2008: 8.4 mbpd & $100
I haven't tried to estimate the 2010 net export number yet, but it is almost certainly going to be below 8.0 mbpd, versus an average annual oil price that will be the second highest in history.
the Saudis may have some spare capacity now, but as noted up the thread, I suspect that it largely consists of what Matt Simmons called "Oil stained brine."
There is a strong suspicion that the biggest Saudi oil fields are watering out, and all this frantic drilling of horizontal wells and building of water injection facilities is just an attempt to hide the fact that their biggest oil fields are going to go south in the near future.
The bad thing is that the Saudis may be lying to themselves about what is going on. The trouble with large, bureaucratic state organizations is that they have an ability to hide the truth from their political masters until eventually the roof falls in on them. At that point, heads start to roll (in SA, maybe literally) but that doesn't really help anybody who counted on them to be honest and aboveboard.
If you had access to the Saudi geological, well, and field data, you could figure it out for yourself, but unfortunately those are Saudi state secrets. We need to get the CIA on the case, backed up by some experienced petroleum geologists.
As I have previously noted, I think that it is interesting that the Saudi stock market crashed at the same time that the Saudis started having trouble finding buyers for all their oil, in early 2006 (as annual oil prices were going from $26 in 2002 to $100 in 2008):
It would be interesting to plot Saudi net oil exports against the stock market chart.
...I think that the net export/price data really tell the tale.
Why use net exports, rather than total production? How does including Saudi domestic consumption in the data help us analyze their production capability?
I'll answer a question with a question. Why did they net export 9.1 mbpd in 2005, at an average annual oil price of $57, but only 8.4 mbpd in 2008, at an average annual oil price of $100?
Again, I'll answer with 2 questions:
Why focus on net exports, when we're looking at production? What does Saudi domestic consumption have to do with Saudi production abilities?
and,
Why ignore the recession in 2008 and Robert Rapier's "fear of price bubble" theory?
I know you disagree with Robert. Why not acknowledge that his theory exists, when you're describing alternative theories (doors, above)?
It's not their consumption per se, it was their apparent inability (or refusal) to meet demand, despite the highest annual oil prices in history. They net exported 8.3 mbpd at $31 per barrel in 2003; they net exported 9.1 mbpd at $57 per barrel in 2005 and they net exported 8.4 mbpd in 2008 at $100 per barrel.
There are only two real choices: The Saudis were unable to meet demand, and oil prices had to rise to equalize supply and demand, or they chose to curtail their net exports, in a deliberate attempt to increase oil prices far above what they have very recently stated was their price target.
As noted several times, Peaks Happen, and often the simplest explanation is the best. I suggest that we wait and see if Saudi Arabia ever exceeds their 2005 annual crude production rate of 9.6 mbpd or their 2005 net export rate of 9.1 mbpd (total liquids). My prediction is probably not for the annual crude rate and almost certainly not for the net export rate.
There are only two real choices
No, there's a 3rd choice: that the Saudis chose to curtail their exports because they were afraid that they would put more product on the market just as a price bubble started to pop, thus causing a price collapse that would do enormous harm to their economy.
Wouldn't you agree that the Saudis up to 2005 had a great deal of experience from 1986 to 1998 with prices that they considered catastrophically low? And, much less experience with very high prices?
Now, all in all, I tend to to agree with you that KSA couldn't ramp up quickly enough in 2005/2006. And, I tend to think that the idea that KSA can't really raise their production much above current levels for a really sustained period is a little more likely than the idea that they just got used to higher prices. I think that KSA would be more comfortable with prices below $60, and is quite uncomfortable with prices above $80.
After all, they're very nervous about alternatives. KSA has been acutely aware of the potential for CTL after Carter's Synfuel project; they're nervous about biofuels; and they're acutely aware of how quickly EV/EREV/PHEVs are ramping up.
OTOH, they're under a lot of pressure from their population, and from other producers, to maximize revenue. They may be thinking in the short term, price-wise.
All in all, I think it's unrealistic to say we know for sure, and unfair to your audience to not let them know that there are other plausible theories.
So they curtailed net exports because of a fear of a price drop as oil prices, for five straight years, have all exceeded the $57 annual level that we saw in 2005? And this significant reduction in net exports, in response to rising oil prices, was exactly opposite of the pattern that they showed from 2002 to 2005? I agree that you seem to believe this, but I suppose some people believe in unicorns too.
So they curtailed net exports because of a fear of a price drop as oil prices, for five straight years
Come now. We had a recession in 2008 (the 3rd of the 5 years you refer to), and it's perfectly clear that KSA curtailed exports to support prices in 2008. Right?
I agree that you seem to believe this
Did you read what I wrote? I specifically said the opposite.
The price bubble option doesn't make sense to me. In 2008 the price ran up to what? Something like $147/bbl? I tend to believe the Saudis know enough about the world economy to understand that the rapid run up in oil price would cause the major recession. They kept saying in 2008 that they had plenty of extra production, but in their opinion the oil price run up was just due to the markets and price speculation. I remember thinking at the time, why don't they just show the world some of that plentiful excess capacity and take the steam out of the price bubble and speculation? If they would have done that then oil price would have fallen to what? Maybe $70 to $80/bbl and we all could have just gone on with BAU. Instead they choice to voluntarily cut back production and cause a major recession, which in turn took oil price much further down and lasted for a couple of years? Again that does not make sense to me and I think the Saudis are way smarter than that.
i think saudi aramco has given up on the idea of supplying(or never intended to supply) all the oil the world wants. that is essentially what al-husseini told aspo in '08.
In 2008 the price ran up to what? Something like $147/bbl?
That was the absolutely highest spot price. The average price for the peak 2 months, per EIA, was $133. Prices were in that neighborhood for a very short time.
I tend to believe the Saudis know enough about the world economy to understand that the rapid run up in oil price would cause the major recession.
I don't think they believe that oil prices were the primary cause of the recession. Very few people do.
I remember thinking at the time, why don't they just show the world some of that plentiful excess capacity and take the steam out of the price bubble and speculation? If they would have done that then oil price would have fallen to what? Maybe $70 to $80/bbl
In fact, prices fell much further than that, and rose only because of a sharp curtailment of exports.
These national oil production curves tend to follow a standard pattern which inevitably looks like some kind of bell-shaped curve (or variant thereof). M. King Hubbert wrote the defining papers in the field and gets full marks for predicting the peak and decline of US lower 48 production with considerable accuracy.
I did some computer "what if" simulations some years ago and convinced myself that under any reasonable set of assumptions, national oil production curves will look much like that of Texas. I used to design oil production prediction programs for oil companies, so I have considerable experience in this field. (I derive considerable satisfaction from the knowledge that many of my designs were stolen by software pirates and are now in widespread use throughout the oil industry. My former employers aren't making any money from them, but why should I care since I cashed in my stock options years ago:)
The disconcerting thing about it is that the peaking and decline of oil production in Texas came as a complete surprise to the oil men of Texas. They assumed that if the price went up, and they drilled enough new oil wells, that production would continue to climb. That turned out not to be true and the result is the Texas oil production curve is as it is shown in the graph.
Most likely the oil production curve for Saudi Arabia will follow the same pattern as Texas. The real problem is that the peak and decline of SA oil production will probably come as just as big surprise for the oil sheiks of SA just as it was for the oil men of Texas. That's just a gut feeling, but it's a gut feeling based on past experience.
Great insight RMG.
Thanks
Any chance those programs you authored can be GPL'd?
http://en.wikipedia.org/wiki/GNU_General_Public_License
Any chance those programs you authored can be GPL'd?
No, I signed away all my rights to them. But feel free to steal the code if you can find it. I won't stop you.
The fear of an imminent price drop requires a sustained period of holding back production? Oil producers can cut production far more rapidly than they can raise it. If oil prices start dropping the Saudis could cut production in half or more in just a month, no?
The fear of an imminent price drop requires a sustained period of holding back production?
That's Robert Rapier's theory. Keep in mind that storage levels were rising during the period in question, which would normally suggest a rising over-supply. If a monopoly producer thinks that there is a continuing over-supply situation, they should continue to restrain production.
Oil producers can cut production far more rapidly than they can raise it.
If production is below maximum current production capability, than raising production is as easy as lowering it. More importantly, KSA doesn't have control over other countries, and their overproduction.
If oil prices start dropping the Saudis could cut production in half or more in just a month, no?
There are large lag times, in part from shipping times, and rising storage levels were a factor. I don't know all of the details, but these are fairly sensitive, volatile systems. For instance, what if falling oil prices causes all other producers to sell every scrap of oil they can find, and disregard all quotas? It's a race to the bottom.
Oil revenue is vitally important to the Saudis. The price crash in the period of 1986 to 1998 was very, very painful for them. They're going to be much more risk-averse than a superficial outsider's analysis might suggest.
No, because raising production requires carrying capacity - reducing production idles ships. So it's not "as easy."
That's a good point. I hadn't heard of any oil-tanker capacity problems in the 2004-2008. Have you seen some evidence of that?
Euan,
if the lower 160B number is correct, what are the implications for production going forward?
Since 1966, these six countries have produced 287 Gbs. Now I don't think they are close to two thirds their way through their URR. My preferred number would be in the vicinity of 350 Gbs remaining, suggesting they may be getting close to half way through. Consequence of this is it's unlikely we can expect these 6 countries to significantly ramp production in future, there is perhaps 3 to 5 mmbpd spare at present. At some stage they will struggle to maintain plateau with ever more expenditure required to maintain production.
I would suggest that they are well past half way through.
Ravensworth-Saudi Arabia Information contained in this report is the best available as of August 2005.
But in November of 2006 they claimed to have gotten that decline rate down to almost two percent.
Saudi Arabia’s Strategic Energy Initiative: Safeguarding Against Supply Disruptions
What they are talking about is new horizontal wells that takes the oil right off the very top of the reservoir. That way they can keep production high until the water gets right to the very top, then production is likely to drop off a cliff. With an average natural decline rate of 8 percent my guess is that they are well past 60 percent depletion, perhaps even higher.
Remaining recoverable reserves is probably in the range of between 60 and 75 billion barrels.
Ron P.
Ron, you are confusing the issue a little here by applying your view on Saudi to the 6 countries I am looking at. Our positions are probably not that far apart - you thinking Saudi is more than 50% through their URR, my thinking that OPEC 6 are likely short of half way through.
Re horizontal wells. Some of these are targeting attic oil in mature areas like Abqaiq, Ain Dar and Uthmaniyah - these may well "collapse" when the water hits. Others are drilled into virgin areas like Haradh and Khurais and will produce for very many years before water encroachment becomes a problem.
Euan
Euan, sorry for any confusion my post presented. However I believe Saudi is actually in better shape than the other five Middle East countries with the possible exception of Iraq. And I remain skeptical about Iraq. Iraq will likely increase production by about one million barrels per day by 2015.
Saudi is in better shape because of Khurais, Hardar and Shaybah. The question is: Will production in these three fields offset the sharp decline they are already feeling in their older fields? Yes, that is likely through 2011 but questionable thereafter.
Within two years, or perhaps three, I expect something shocking to come from OPEC. It will start with a "Call on OPEC" and OPEC will not pick up the phone. That will start the ball rolling. More and more energy analysist will start to question those vast claimed reserves. Then someone will figure out they were a myth.
Ron P.
Here is what we came up with for global net oil exports* versus US average annual oil prices:
2005: 46 mbpd & $57
2006: 46 mbpd & $66
2007: 45 mbpd & $72
2008: 45 mbpd & $100
I would argue that there has already been a call on OPEC, and they were unable to restrain the rise in oil prices--so prices had to go up to equalize supply & demand. And note this is contrast to a large increase in global net exports from 2002 to 2005.
*Net exporters with 100,000 bpd or more of net exports in 2005 (99%+ of total global net exports), principally BP data, with minor EIA data contribution.
Saudi is actually in better shape than the other five Middle East countries with the possible exception of Iraq. And I remain skeptical about Iraq.
Saudi Arabia is actually in better shape than almost anybody else, but I don't think that's particularly encouraging since I don't believe SA is in particularly good shape.
Iraq? Nobody really knows how much oil is in Iraq because nobody has drilled their western deserts. It's hard to drill exploratory wells under combat conditions, and they've been fighting for decades. The experts have made the assumption that the western deserts are just as good as eastern Iraq, but that's a rather rash assumption. They might drill them, and find nothing. That's always a possibility.
Within two years, or perhaps three, I expect something shocking to come from OPEC. It will start with a "Call on OPEC" and OPEC will not pick up the phone.
The smart money will invest in railroads. That's what Bill Gates and Warren Buffet did, and you don't meet many investors smarter than them. Stay away from GM stock. The US government will get sick of bailing out automobile companies eventually.
Two trends to watch:
(1) From 2005 to 2009, the Consumption to Production (C/P) ratio for oil exporting countries* rose from 26% to 29%.
(2) From 2005 to 2009, Chindia's combined net imports as a percentage of global net exports* rose from 11% to 17% (BP).
*Net exporters with 100,000 bpd or more of net exports in 2005; these countries' net exports fell slightly, from 46.0 mbpd in 2005/2006 to 45.2 mbpd in 2008 (BP), in response to rising oil prices.
Note that net export declines tend to be front end loaded, with the bulk of post-peak net exports being shipped early in the decline phase. Sam's best case is that four years from now Saudi Arabia, Russia, Norway, Iran and the UAE will have shipped about half of their combined post-2005 CNE (Cumulative Net Exports).
I wonder if not the Chindia fear is a bit over rated. Yes they are an oil,gas and coal eating monster, but lots of this consumption is to supply production wich in turn goes to export back to us. What if there is an oil crisis, followed by ressession, folowed by reduced inport from China, wont it cut down on their demand? I have never read any analysis of this scenario or its consequenses.
China and India shouldn't IMO be lumped together as Chindia. They are completely different. Of the BRIC that stand to benefit from comparative advantages wrt the more developed world I would tend more to lump Brazil and India together and China and Russia together.
India and Brazil have vibrant domestic economies. Far healthier than China's, and Russia's export dependent economies.
Brazil is more developed so possibly has less remaining potential than India, however it is not hamstrung by overpopulation issues as India is. Both these are friendly democracies which is heartening.
Perhaps China's effectiveness at being the exporter of cheap industrial stuff made with cheap labor of choice for the importing world has left India to sustain itself with what turns out to have been a healthier diet in the long run.
China and India shouldn't IMO be lumped together as Chindia.
No, they shouldn't be lumped together as they are completely different countries with drastically different economic circumstances. People who lump them together as one unit probably aren't aware of all the differences.
The key similarity is that they are both developing countries with rapid increases in net imports. China's net imports increased at 9%/year from 2005 to 2009 (on track to double in 8 years), while India's net imports increased at 7.1%/year from 2005 to 2009 (on track to double in 10 years).
Their combined net oil imports increased at 8.3%/year from 2005 to 2009 (on track to double in 9 years).
China gets 70% of its energy from coal.
China's oil consumption is shifting toward being much more heavily weighted toward their consumers than its electric power consumption. China is making more cars than the United States and that car production bakes in a very large future rise in Chinese oil demand.
Chinese car production is rising fast. OTOH, average VMT is very low compared to the US (I wonder what the average speed is on crowded Beijing streets), and MPG is substantially higher.
It is interesting to note what the WEO 2010 writes about OPEC reserves:
with this footnote:
In earlier versions of the WEO, the IEA described the OPEC quota wars:
18/10/2009
OPEC reserves revisited
http://www.crudeoilpeak.com/?p=355
My latest update on this topic was:
11/6/2010
BP Statistical Review June 2010: Oil reserves and production don't match
http://www.crudeoilpeak.com/?p=1591
The correlation between reserves and R/P is stunning - its a pity Canada decided to book so much bitumen. Anyone seriously believe Saudi Arabia can go on producing at current levels for another 75 years?
Not 75 years, but I think Saudi Arabia might be able to keep going for another 15-20 years at their current level.
See http://www.energybulletin.net/node/38327 for H Groppe's take on SA's oil production capability.
From the EB article:
What Mr. Groppe left out is the "C" word, consumption. Here is a chart showing Saudi consumption increasing at 5.7%/year, versus a flat total liquids production rate of 11 mbpd:
Note that BP puts the Saudi's 2005 to 2009 rate of increase in consumption at 6.9%/year (on track to double about every 10 years). So, at the current rate of increase in consumption, and assuming flat total liquids production of 11 mbpd, the net export picture would look like this in 10 year increments:
2015: 11 mbpd - 4 mbpd = 7
2025: 11 mbpd - 8 mbpd = 3
Incidentally, Saudi net exports in 2010 are going to be somewhere below 8 mbpd (versus 9.1 mbpd in 2005) despite 2010 having the second highest average annual oil price in history.
Isn't KSA oil consumption already at US levels? How could household consumption rise much further?
A large % of KSA oil consumption is industrial, especially generation. They're pretty aware of this problem, and I can't see them letting it fester for decades. From the 11/30 Drumbeat:
Saudi Arabia, the world’s largest oil exporter, and neighbor Kuwait seek to add natural gas supply to avoid burning crude and refined products to generate power, officials from the two nations’ state oil companies said. “We are picking up gas exploration,” Ahmad Al-Sa’adi, vice president of gas operations at Saudi Aramco, said today at a conference in Doha, Qatar. “Any liquid fuel we are burning comes at the expense of our exports.”
I believe that the average Saudi family has about six kids. And in any case, BP shows their consumption going from about 2 mbpd to 2.6 mbpd in only four years.
I think a better analogy for what Saudi average consumption could go to is to look, not at average US consumption, but at the average consumption of a US trust fund family.
a better analogy for what Saudi average consumption...is to look...at the average consumption of a US trust fund family.
See my comment above: industrial consumption and electrical generation appear to be the bigger problems.
Oil consumption in the US does rise proportionately with income. OTOH, that's straightforward to change with price signals and cultural changes (e.g., Priuses sell better to high income families).
It's uncomfortable to remove fuel subsidies, but it's enormously unrealistic to suggest that KSA will allow net exports to disappear in order to retain price controls and fuel subsidies.
the average Saudi family has about six kids.
Yes, that's a problem. OTOH, it's not that hard to reduce personal consumption with HEV/EREV/EVs. Is KSA really stupid enough to stick with SUVs and heavily subsidized gasoline when everyone else is moving to electric transportation?
BP shows their consumption going from about 2 mbpd to 2.6 mbpd in only four years.
Yes, that's the history. The question is, does it make any sense to forecast similar continuing growth for 20 years? This is what the EIA said for 2008:
"In 2008, Saudi Arabia consumed approximately 2.4 million bbl/d of oil, up 50 percent since 2000, due to strong economic and industrial growth and subsidized prices. According to independent analysis quoted in industry reports, demand is expected to rise by eight to 10 percent through 2010, mostly in the area of electricity and NGLs for petrochemical production. Saudi Arabia also does direct burn of crude oil for power generation during summer months."
Electricity can be generated from gas and solar. Petrochemicals still contain the same amount of embedded energy, so a shift to internal production doesn't really reduce net exports.
Matt I saw something interesting in your link.
http://www.crudeoilpeak.com/wpcontent/gallery/misc/disconnect_oil_reserv...
Look at the red area of the graph.
And look at mine the blue line is calculated oil production you have to click through can't hot link it seems.
http://mike-emmel.blogspot.com/
http://1.bp.blogspot.com/_tpFxjJpWUbM/S2Ukg_XW0SI/AAAAAAAABVc/YW3K-J06mN...
For all intents and purposes the red part of the production graph simply scales up.
Looks like some recent FSU production is also questionable.
Other than that the fit is really interesting. And it also fits my assertion that all oil producers are actually quite similar and the 30% or so that are known to have peaked are representative of the total. All other claim are simply bogus.
Its not that 12% of the reserves produce 45% of the oil 45% of the reserves produce 45% of the oil.
And it puts remaining global reserves in the 300-400GB range or so.
My point is you have no reason to believe any of the claims the sample size where data is reasonably valid is large enough to use as a baseline and simply assume similarity.
Anyway I glad to see my "curve" developed using a completely different method.
Looks like I need to add several FSU countries to the liars category but thats not surprising.
Do a creaming curve on FSU reserves and all the additions later after the fall of the Soviet Union are probably bogus.
Iraq is the next in line to revise their proven reserves if they want to increase their quota and stay within OPEC.
Also this strange accounting coincidence in the last OPEC report ((page 141, WEO 2010):
(c)=(b)-(a) which is a very unlikely occurence.
It suggests proven reserves are only around 600 Gb (OPEC-12) and not 1Tb.
Sam, this is a mind bender i just don't get - interested to see what others make of it. At any rate, reserves growth is a phenomenon associated with SEC reporting standard that OPEC most certainly are not using. And I'd be interested to know how long it will take OPEC to discover another 260 Gbs at the discovery rate of last 20 years.
It does seem like b = original endowment in OPEC's case.
IMO, the OPEC figure is a coincidence. As you can see, in both Non-OPEC and Total world, c=b-a is not true. Though it is, as you noted, quite unlikely. Not impossible however.
If we view all of the OPEC figures in b & c as suspect, why do we trust those in Non-OPEC? In the long run, it seems that the principals all have the same motivations, so why do 'we' believe it is just OPEC giving out bad numbers?
Just wondering.
Craig
The 347 figure is much like the 300+ growth figure from the 1980s. Pure political reserve growth. Not much of the supposed 260 of future finds will be in the middle east.
The mystical non-depleting proved reserves of 1027 are a joke too. They pump 30 million barrels per day and the reserves stay constant.
The reality is closer to 1027-420-300 = 307. The OPEC reserves were never 1500 billion barrels. These numbers are clearly not including Venezuelan liquid bitumen in the Orinoco belt.
i think they are saying: a + b + c = e(endowment)
Four years ago I used the Hubbert linearization techniques to find the World Conventional Crude Oil ‘capacity limit’. The upper and lower values of 95% confidence limits were estimated to be 1689-2320 GB, mid value 1979 GB. I used these figures in a Matlab/Simulink computer simulation model to predict the peak year and the peak production rate. The peak year was not very sensitive to these figures, 2005 plus or minus 3 years, however, the peak production figures were much more so, 71 mb per day plus or minus 12 mb per day. The uncertainty over ME OPEC reserves makes it uncertain for forecasters to estimate the World Crude Oil productive capacity, if and when the demand for crude oil accelerates.
Here's a plot of year-to-year differences in claimed reserves (up through 2006) which highlights both the 1980's reserve adjustments and the flatlining of reserve growth from the mid-1990's onward. This isn't anything new, just a different way of looking at the data. If true, 1988 was a remarkable year for discoveries by OPEC nations, and since about 1995 all of the "noise" in discoveries has been somehow perfectly smoothed away.
Nah... It's obvious that what happened is that a strange fluxuation in the vortex of the space time continuum enabled the ME producers to exactly match production to discovery, but just since about 1993. I mean, just look at the figures... And those big spikes? Obviously those are the fluxuations.
Craig
Thanks Dr. Who! I knew you'd rescue us just when it looked like the world was ending. ;-)
There doesn't even seem to have been any coordination among the OPEC countries. With just a little bit of planning they could have slowly raised the numbers over a five or ten year period and made it look a little more plausible. It's almost as if they were daring someone to call their bluffs, or more likely they have no reason to be concerned about being called on it.
To be fair, it is possible they found the additional reserves prior to 1998, but just couldn't be bothered with the admin exercise of updating the figures. Was there some kind of deadline in 1998 that the updates had to have been formalised by, for quota purposes?
It still looks shady and is in no doubt over exaggerated, but probably not complete fiction.
In other words they found the new oil in a filing cabinet in the back of the Oil Ministry that they hadn't bothered to look at before 1998.
Who knew what was in it? But fortunately it saved their butts from a sharp decline in oil production quotas, so it's all good.
And, I'm told that there is an opportunity to buy shares in a bridge in New York City. Somebody found the title to it in the bottom of an old bedroom dresser, left there by his grandfather, and is now willing to accept money from investors. Don't wait because this might be your last chance.
again, what saleri said in 2004:
so in other words, production from abqaiq exceeded 45 % of ooip ten years ago.
ghawar is already up to 38% recovery (of 170 gb ooip) from aramco estimates. 38% ultimate recovery of ooip from ghawar is the maximium, according to many experts.
My wife was watching at this graph, she asked to me what's the meaning of these peaks and after an explication she said: "ah ok, that's it : we are really doomed".
Look at the game in action. Each OPEC nation starts the dominoes in motion. First Iraq ups the ante to boost their quota, then Kuwait, then Iran et al. amazingly at the same time, and finally the big Whale --SA-- comes in with a big splash to drive all the other gamblers off the table.
Makes sense that SA comes in last to make sure they are still represented properly in their quota as the others grossly inflate their share.
Seems like fraud to me, but I am no expert.
What is the minimum reserves consistent with OPEC production +/- 4mbd and consistent with what non-OPEC production is reporting ?
My best guess is its in the 100-200GB range with 100GB as a reasonable estimate of the absolute minimum capable of giving production levels that are plausible.
Another way to look at it is what is the minimum reserve level consistent with 16mbd-25mbd.
Looking only at non-OPEC production numbers. 16-20 mbd seems easy to hit against 100GB of remaining reserves.
So what does OPEC pretty much have to have first and foremost then why could it be higher than that ?
The have to have number is in my opinion quite small.
You could use this post and simply assume OPEC R/P ratios are similar to non-OPEC.
http://www.theoildrum.com/node/7149#comment-747502
Basically assuming they are not special then what must they almost certainly have.
Obviously a reasonably constructed minimal estimate using facts is substantially different from claims in my opinion at least when I try to do it. This is a estimate of P2P using the rest of the world as a model. And I'd argue it would leave room for constructing some valid reserve growth from the minimum. How much makes sense is and open question.
Answers which are probably correct would then be extrapolation of this minima and they don't need to depend on OPEC reserve claims. I don't think its hard to figure a very easy to defend minimal reserve level using known industry R/P data and I think its the best approach to dealing with OPEC.
Sure on top of this there are valid arguments for reserves being higher but whats important is constructing these arguments from a firm and agreed upon basis. This minimal reserve argument is in my opinion the best starting point.
in other words, make up your own.
'industry' operates on a 'maximize pv(present value)' driven model. gut the field, paint your wagon and move along. this has been the model for 150 years.
saudi aramco operates on a 'maximize ultimate recovery' driven model. i don't know about the rest of opec 6.
all indications are that iraq is being developed based on a 'next quarterly report' driven model.
Why do you believe that ? Because they say so ? Obviously Saudi Arabia says a lot of things but whats real ?
I'm simply saying that that statement amongst many others is one that needs review. Thats not to say that its completely wrong and I'm not saying that.
However I am pointing out the obvious that OPEC and Saudi Arabia could readily achieve current production levels with the technology they are using
against a substantially lower reserve base than they claim and easily match industry standards for oil extraction.
That in my opinion is and indisputable fact and its one that should be established as a baseline. I'm not making anything up.
I'm simply suggesting lets start with what we can know pretty much for sure. And we have enough information on the oil industry to
create a baseline model off the simple assumption that OPEC is the same.
After that and only after that does it make sense to consider if there are differences and if so are they materially important.
Most models I've seen that cover peak oil show that the peak date is fairly insensitive to total URR. At best a more contrained program
might have bought them a decade of oil production at a lower rate if they indeed pumped using a model that was even close to the norm.
Given their reserve claims even if you cut them down substantially your still effectively buying into a radically different production model.
Yet real world production does not require you to do so. There is little supporting evidence in the production data to suggest that their claims
are justified at all.
At best a slight extrapolation to the minima or industry standard model is all thats required to get results consistent with reasonable production estimates.
As far as I can tell in my own reading it seems that known fields where not produced in KSA because of problems with producing the fields not some maximum extraction plan. Not that they did not try to produce the fields but technology advances along with substantial capitol investments seem to play and important role in field development not some high level mandate that left easily developed fields fallow. Big fields with big problems and big investment if you will. Not to mention increasing maintenance problems in existing fields. Plenty of examples of this around the world also. Saudi Arabia is not the only place where oil extraction is difficult.
Heck go up to the Caspian sea region to see numerous large fields that have languished for technical and political reasons.
http://en.wikipedia.org/wiki/Tengiz_Field
I did not want to into the details but I guess I must. I just don't see any large differences esp once you consider how the rest of the industry has handled technically challenging fields.
To be clear I'm not suggesting that the minimal model is 100% correct simply its a good minima and can be easily supported and correcting it requires some fairly simple perturbations not some dramatic fundamental change. In general you need only correct for the technical challenges and overall investment requirements and funding capacity. So yes there are corrections which should be applied and they are reasonable and most importantly fairly small and well within industry norms.
Given such a model the next step is why is it wrong ?
It accounts well for production rates and also oil prices. In particular the inability of KSA to maintain any sort of price band for any length of time.
Indeed the slightly perturbed minima model fits history very well and is backed by known facts not claims.
As far as I can tell any other model is faith based and has no basis in fact. Just attempts to rationalize and accept some highly questionable claims.
In the end the Middle East is not particularly special certainly it the top region but not and extreme anomaly. The worlds largest oil field has to be somewhere.
Its not a shocker its in a region that seems to contain primarily a few large fields.
I just don't see any reason to drop a rational argument in exchange for belief in what are probably highly political announcements disguised a fact.
I've got no problem if it turns out that my approach is wrong simply that any rational person should approach the problem as I've outlined and prove its wrong.
All I see is faith.
facts about the future are hard to come by.
the model i am using starts with history, abqaiq for example and applies it to a similar* reservoir such as ghawar.
yeah, go ahead and create a low case, a high case and a most likely case and
make a wild a$$ed guess at theassign a probability to each.*similar in terms of oil density and viscosity, permeability, reservoir dip and depletion rate
I quote only that part because its all thats required. Where do you get your depletion rate from ?
Applying industry standard depletion rates paints a very different picture.
The depletion rate comes from reserve claims its a circular argument. The question is about URR.
I'm simply saying assume depletion rates near industry standard ones. Its not exactly radical.
The only thing radical is obviously reserves could easily be substantially lower and depletion rates much higher.
Eventually at some point if true then production will fall sooner rather than later.
As far as being scientific about it presuming industry standard practice as a reasonable first guess should
not be some sort of extreme position.
As far as production levels go a tenfold increase in production using horizontals vs vertical wells is the norm not the
exception.
This is natural gas however oil production profiles are similar. Its all I could find in a quick google.
http://www.theoildrum.com/node/2194
The original link was dead it seems but found this its the same paper.
http://www.graemeklass.com/economics/horizontal-vs-vertical-wells/
And this.
http://www.beicip.com/index.php/eng/content/download/631/4657/version/1/...
And of course with shale drilling natural fracture patterns are getting a lot more attention. Ghawar is heavily fractured
and so is Abqaiq.
http://www.searchanddiscovery.net/abstracts/html/1995/intl/abstracts/123...
http://www.theoildrum.com/node/5882
Its very likely that the fabulous flows out of many of the Middle East oil wells in the past had a lot to do with fairly simple vertical wells intersecting with and extensive fracture system. In effect a sort of natural extreme multi branched horizontal well.
I mention it because its does a good job of explaining the high flow rates without necessarily having massive reserves.
http://www.onepetro.org/mslib/servlet/onepetropreview?id=00005084&soc=SPE
That last sentence is very interesting....
If you want to be objective about it there is plenty of information on the subject and again I see no real reason to resort to claims of massive reserves in Saudi Arabia or the Middle East. Now that does not mean they are not large indeed the region would still have the highest concentration of oil in the world for a given basin even with my argument.
Just its not super special or super unique vs other producing regions. No magic need be invoked. No 70% recovery rates etc.
Indeed as far as I'm concerned the only thing really unique is that peripheral water injection coupled with production from a highly fractured reservoir allowed fairly simple horizontal wells to produce at rates that took decades to achieve with technical advancements.
They happened to get natural super straws in some of the worlds largest reservoirs. And they work till they don't.
gravity stable displacement is the most efficient way to deplete a fractured reservoir.
if you assume ghawar is completely depleted, the maximum depletion rate* is about 3 %/yr.
cumulative production: 65 gb (ultimate recovery)
maximum rate = 5.5 million bpd
= 2 gb/yr
depletion rate = 2/65 = 0.03 or 3%.
* saleri's definition
You making and assumption here. First as far as I know gravity stable is generally the most efficient method of production.
It does not yield the highest production rate. According to my link it seems that such reservoirs are capable of significant surge production for a limited amount of time before they need to be rested. You can pulse them. If they are large i.e Ghawar I'd argue one hell of a pulse is possible. This fits very well with how KSA has positioned themselves as a swing producer. They are a natural for the role.
Now 5.5 mbd is probably the max rate at surge. Dunno what the stable production rate is I'm not a reservoir engineer perhaps one could enlighten us. But a reasonable guess for illustrative purposes would be say 3mbd or so. If so then then the URR is lower by say 30% from your calculation or about 45 GB. It can for a period look substantially higher. For Ghawar at least the original URR estimates might have been high.
http://www.gregcroft.com/ghawar.ivnu
This fits except of course constrained production would not have been market reasons simply they had no choice.
Furthermore rates approaching this would have been possible throughout most of the field life at least for short time periods.
As far as cumulative production goes the average production rate as I said has probably been substantially lower than peak thus GB produced is lower. However good chance the real URR is lower also. Later on horizontal and esp multi-branched horizontal wells in such a fractured reservoir could easily keep production rates up. These are literally the worlds best production wells.
As far as URR goes the next observation is that the southern end remained undeveloped until recently. I don't know the exact numbers.
Numerous posts have been done on the subject at the oil drum. But 45GB in the north and 20GB in the Haradh increment is a good guess without doing a lot of digging. This would bring it up in line with the original URR estimates and yet still fit what I'm considering makes sense.
As far as your "facts" we don't have field production data after 1980 or so for Ghawar. Saleri's statements are just that statements you have to believe. As I said what can you reasonably figure out without having to take anything on faith.
The above is a fairly good guess without invoking any "faith" based analysis. Ghawar is of course not the only field in Saudi Arabia.
And many of them have similar surge profiles. Overall production could easily be managed it really depends on the real production history of each field. If needed Saudi Arabia would indeed have what they have demonstrated in the past which is significant surge potential. I'd not be surprised if at one time they did not have 5-6mbd of surge capacity. They way they are forced to produce their fields they pretty much always have some fairly significant increment I'd guess at least 1mbd over their normal production levels.
What I find really interesting myself is it seems that Saudi Arabia may not have actually produced nearly is much oil as they claim.
Perhaps its 20% less perhaps more. It seems highly likely that estimates of cumulative Saudi production could well be way off.
Soviet Union/Russia has probably been the worlds top oil producer for a long time now :)
You can look here.
http://www.eia.doe.gov/country/country_energy_data.cfm?fips=SA
Certainly would take more thought than can be done in a simple post. I don't know any real way to prove Saudi oil production without large error bars. If some engineer can give some info on how you would pulse a fractured reservoir that would help a lot.
My best guess so far is when they where claiming 8mpd they probably where really doing 6-7 mbd on average. However it could readily swing a lot from perhaps as low as 5mbd to over 8mbd over a year.
Seasonal global demand varies by like 2mbd or so I'd guess they would adjust the pulsing to meet demand swings.
I don't get a picture of some super producer but one forced to adopt a fairly erratic production regime given the nature of the fields.
Sometimes gravity stable sometimes not. Most importantly a natural swing producer at least periodically. Thus probably neither the gravity stable low depletion rate producer they claim nor did they produce at absolute maximum levels all the time.
Instead they probably average somewhere in between but first and foremost with extreme variability.
And if what I'm thinking is reasonably correct then we have a very good underlying physical reason for the oil price spike up to 140.
As oil prices rose Saudi Arabia opened the flood gates and surged production in 2007. By 2008 they literally had taken their field to the point of damage if not beyond. They had no choice but to cut back substantially price of oil be damned. Perhaps they rested their fields for six months at some low rate then where able to surge again.
Regardless what happened in 2007-2009 goes a long way to making me feel I'm closer to being right than wrong.
And last but not least if so I have nothing but admiration for the Saudi's they took the cards they were dealt and played the game like a master. Basically they bluffed everyone. Indeed to suggest that this might be the case on a fringe website devoted to oil depletion is met with disbelief. This if anything supports just how good they are.
Eventually however in the end they will be forced to show their hand geology cannot be hidden forever.
Maybe I'm wrong maybe they did not play the worlds greatest bluff. Maybe I'm right. Sometime probably sooner than later oil prices will again rise to economic damaging levels and the Saudi's will be forced to respond. I'll certainly watch with interest.
And in the end in a lot of ways it does not really matter its only 2-3mbd of production that are at issue some in the past some in the future. I used to worry about it now I don't. Saudi peak whenever it happened just means peak exports are pretty much certain.
But export land is still at play and its impact is similar. Perhaps the only real importance is Saudi swing production probably can no longer rise to the occasion on near the scale it could in the past. Daily normal production declines simply add to the price of oil as it does with any producer again nothing special. We will I think find out just how important their ability to be a swing producer was.
that is not what i said at all.
the 65 gb is what has already been produced (by press report) from ghawar. that figure corresponds to 38% recovery of pre-saudi aramco ooip of 170 gb.
i used that figure to show that ghawar's depletion rate has never exceeded 3% *.
for whatever it is worth, my guess of ultimate from ghawar arab d is 120 gb, that leaves 55 gb remaining.
saudi aramco recently stated their estimated remaining from ghawar was 88 gb. i suspect they were talking about 2p and 3p there.
* depletion rate used here is annual production as a % of ultimate. this is how saleri defines depletion. a depletion rate based on remaining is essentially meaningless, although in widespread use.
And like I said I don't buy into the press reports of 65GB of production out of Ghawar I suspect its lower.
I don't think they have done 5mbd day in and day out for decades. Before you even begin to calculate URR you have to consider
Saudi production claims.
One claim that I've never denied is their ability to act as a swing producer. They can and in my opinion routinely do cycle their production using any number of algorithms. Round robin to burst mode. The nature of their fields and the fact they produce large amounts of lower quality oil suggests that adjusting production levels periodically is the norm not the exception.
Does this production chart make sense ?
And don't give me the excuse that its all the data we have its not. We do have import data into the US for KSA and you can look at that as a first pass at guessing Saudi production.
I've not found data for KSA back into the 1980's however we do have this.
We also need to consider export land since we question production your forced to look at population.
http://www.indexmundi.com/saudi_arabia/population.html
This chart is actually very interesting also as they underwent a sharp change in percentage growth rate.
More info on the causes here.
http://www.ameinfo.com/123859.html
And this is just obviously a quick post but my point is once you start looking at data point after data point
it seems highly unlikely that published Saudi production numbers are reliable. Even if they held exports constant
growing internal demand would have forced and overall steady production increase.
All kinds of data need to be looked at when fields where brought online. Agreements made with various oil companies etc.
For internal consumption Natural Gas production plays and important role.
Perhaps one can also look at VLCC rates etc to try and get a handle on overall exports.
Certainly looking at oil production through the Iran/Iraq was, Fall of the Soviet Union and Gulf Wars is useful.
Looking at the Saudi budget year after year and including population changes is also useful.
http://news.bbc.co.uk/2/hi/business/2523937.stm
Simply looking at the budget while assuming a static economy is wrong.
http://www.bechtel.com/jubail_industrial_city.html
Also obviously spending on oil project and activation of the projects plays a big role.
http://www.gulfoilandgas.com/webpro1/MAIN/Mainnews.asp?id=2639
I don't have the silver bullet set of secondary data required to estimate Saudi production.
However enough data does exist for me to question the Saudi production profile.
A the least its much more complex then is portrayed probably varying by several mbd over any given year.
It seems likely that any attempt to estimate actual cumulative oil production for KSA would have huge error bars.
On the order of +/-20% if not higher.
And last but certainly not least it should be obvious that attempts to find ferret out complementary data concerning Saudi
Arabia is met almost everywhere with unknowns. They are extremely secretive Kuawit, Iran, Iraq are practically open books
in comparision heck even Libya is much easier. This is not a fact that should be dismissed out of hand. It generally indicates
that a country has something to hide. Paranoia on my part perhaps but the more I look the more it seems justified.
And last but by no means least back to my original statements. Simply assuming that the Saudi's produced their oil in a manner similar to the rest of the industry but also including some sort of significant pulsing of production does not require that they have reserve levels anywhere near what they claim.
If one looks at the US and Russia and what those two countries accomplished with their oil reserves in general then looks at KSA at best Saudi reserves are similar. If you take a closer look at total GDP and oil production Saudi Arabia falls distinctly into third place on par with Iraq and Iran with all three probably significantly lower than the much larger geographical regions represented by the US and Russia/Soviet Union. This does not mean that KSA is not well endowed with oil reserves. They certainly are. And the concentration is impressive. However one can easily rank economic activity in KSA against the US, Russia, Canada, Mexico etc etc. In the end oil production creates wealth and it gets distributed into the economy.
Saudi Arabia does not stand out of the crowd to any significant degree indeed its overall economic development is comparable to any number of countries depending on how you want to compare. You can do things like compare it to Nigeria or Texas or Iran or Canada.
Adjust for population and its oil centric nature. Compare to say Kuwait and thence Kuwait to Mexico or Canada.
Regardless of how you do it its hard to get a result that the Middle East in general and KSA in particular are dramatically different from the rest of the world. Yes the field distribution is uniquely concentrated because of geology but thats about it. This fact is born out by the discovery profile. Once oil was found in the region almost all the fields where rapidly found as they generally lie in a set of related basins and the fields themselves are large.
And last but not least all this means is that KSA are the masters of politics the House of Saud has blown the doors off every other country including the US. I have to imagine that dealing with external politics must be trivial for them compared to what goes on behind closed doors. No other country in the world has this sort of long term unified political apparatus in place. I have to imagine that once you rise to the top in internal KSA politics its a cakewalk in comparison. Machivelli is probably required reading for any royal prince.
And last but not least again I don't have the answers I have guesses but most importantly I'm convinced that KSA is probably much closer to one of the top producing provinces self similar to all the others. There is no magic in the Kingdom outside of adroit political prowess.
memmel,
Going back to your first post where you say that you think the starting point should be at the minimum reserve number, to me it seems that Euan did this in Figure 4 of the original post. I also think the way he did it makes more sense then trying to pull some analogy for other producing areas in the world. We know that originally these fields were developed by international oil companies before they were nationalized. I am highly skeptical that the original estimates of oil in place that the IOC's did were that far off. I have worked many fields and I have obviously seen where reserves are continuously updated based on new studies and new data, but from my experience on big fields that were studied extensively the earlier estimates are not often off by the amounts that the OPEC countries increased reserves in the 1980's. I obviously don't have the data to prove it, but I think Euan is completely right to start with the original IOC estimates and call them the low case estimate.
Now as far as comparing Ghawar to shale gas drilling I think that is completely off base. I am no expert on the Arab D reservoir, but I seem to recall from papers I read several years ago that it is a Jurassic carbonate. I also remember the paper giving details on just how special and unusual the reservoir is. It is truly a one of a kind field based on its size and reservoir properties. I am not sure if it is highly fractured, although I do not doubt that it is, but I am sure that the matrix rock itself has excellent permeability and porosity, which the contemporary shale gas reservoirs certainly do not.
Finally, the exert you posted from the article at onepetro.org does not completely make sense to me. I spent a pretty big part of my career working historic fractured reservoirs and I do not necessarily agree with the exert. It says that "for a given fracture flow capacity, the producing water-oil ratio is a unique function of oil remaining in place and present producing rate." This is not completely true. It might be a function of the oil remaining in the particular fracture that is producing, but it is definitely not a function of the oil remaining in the matrix rock and overall reservoir. I know of many fractured reservoirs that initially produced very high oil rates, peaked extremely early due to water break-through in the fractures, and then went on to produce for many decades at much lower, but relatively stable rates. These fields where no where close to being depleted when the fractures watered out, but their high flow rate days were over.
I do not think this exactly relates to Ghawar because it has such high matrix permeability and it was historically developed more prudently and in what seems to be a gravity stable manor. However, I do agree that a day will come when it's oil column will be depleted to a stage that it will see a steep decline. I just have no way of knowing when that will be. Based on all the horizontal drilling they have supposedly been doing maybe that day is not so far away? I am also pretty sure that it will continue to produce for decades or centuries at a much, much lower and eventually insignificant rate.
Well to be clear I don't think there estimates are all that far off. I question how much if any reserve growth occurred. In general I have a lot of faith in the early estimates of reserves up through the 80's. Euan's mistake is claiming that they are 1P or proved they are not they are proved plus probable. Now thats not to say in the end they might not have been high to begin with. I threw that out because its not something that can be dismissed. If they do turn out to be high then it won't be by that much.
As far as Ghawar the Super K fractures are well known.
http://www.onepetro.org/mslib/servlet/onepetropreview?id=00079048&soc=SPE
A long quote but its relevant.
Yes I might have a flair for overstating things but I'd argue not nearly as much as you seem to think.
Next
Prove it. As far as I can tell this is hearsay and its not the first time I've questioned this assertion.
Heck my attempts to search google for it seem to just end in oil drum threads where people bring it up and I ask for proof.
I'm suggesting that a period of gravity stable production is part of the production cycle for these fields they are rested and pulsed.
Heck all the surge capacity has to come from somewhere unless your suggesting they are throttled way back and only approach gravity stable production at the peak of surge. I don't think you are. This surge production cycling is quite doable with these sorts of fields and would generate the maximum production rate with the least amount of damage.
To come back to your permeability statement yes the field also has high permeability. This simply further supports the fact that production rates are probably unusually high in the field. Add that to the fracture network and what I'm trying to say that a vertical well in Ghawar is equal to a modern multi branched horizontal well in your average reservior is even truer. The newer horizontal wells would be super mega duper wells :)
However I'd argue that if anything this suggests that the URR for Ghawar and similar oil fields in KSA is probably overestimated to some extent not underistimated. The shear productivity of the formations because of their nature was probably not fully recognized for a while.
I'd suggest the decline of Abqaiq http://www.energybulletin.net/node/50439 woke the Saudi's up to the real nature of their reserves.
And more on the field.
http://www.theoildrum.com/node/5882
And
http://www.onepetro.org/mslib/servlet/onepetropreview?id=00077778&soc=SPE
In general, The Arab-D dolomite and limestone differ in the following aspects (Cantrell et al., 2001).
Its obvious decline by 1981 gave the Saudi's real data about their fields. I suspect it played a big role in deciding how future production would play out. On the face of it we have every indication that they where actually dealing with a downward revision of reserves significant enough to shock the Kingdom. In short they freaked out. Abqaiq is basically a isolated pool of the Ghawar structure. Ghawar will follow its little brother. Also its practically a religious icon for the Saudis. Later on I suspect they grew overconfident as technology worked its wonders time will tell.
And last but not least yes Ghawar could potentially produce for a long time. However imagine just 2 mbpd at a 90% water cut. The amount of water handling would be enormous. The same holds for almost all the fields in the ME. Producing them at high water cut is enormously expensive and technically challenging. Small wonder that Saudi Arabia's is comfortable with the price of oil rising ever higher.
I've got no real idea how much it would cost to produce Ghawar at a 90% water cut but it would have to be close to 100 a barrel. So yes technically these fields have the potential for a long period of twilight production I'm just not sure its profitable. Unconventional resources can be developed for similar costs. Who knows for sure the scale of the required build-out is staggering.
Also of course Aramco is a NOC it has financial demands beyond simple profitability and I'm sure despite their claims also ineffiencies.
The Saudi's are almost certainty looking at production costs rising substantially and probably already are.
And obviously once they reach that state one has to question what the market would be for oil. The rest of the world won't be doing well when Ghawar reaches a high water cut much less 90%. They are looking at a tremendous cost and very uncertain market in the not to distant future or even perhaps the past.
And of course I don't know what the real truth is any more than anyone else. However the longer I look at the problem the more I realize that a sort of minimum scenario is not ridiculous as it seems at first.
Indeed one would think if oil rose over some ridiculous price like 70 a barrel and the Saudi's failed to respond people might finally start considering minimalist scenarios as credible. To be clear it does not mean I'm correct simply that I might not be that wrong.
Surprisingly thats happened twice and few seem willing to question the situation. The price of oil and economic turmoil alone should at least cause a few more people to become skeptics.
Indeed only if Saudi Arabia is looking at producing at high water cut and high cost in the very near future does current prices make sense both at a production level and at a economic level. Not only can they probably not do anything about it they also need to know if there is a market for expensive oil or they have no future. On that note I suspect that they will for now at least simply shut down wells if they reach high water cut and cannot be reworked. This will continue until they see some real financial stability. Later perhaps the future you envision for Ghawar will happen or maybe not.
It seems to me you have either not read or not understood the article.
ok, as long as you assign zero probability to that case, at least one reservoir, abqaiq, produced that volume ten years ago.
Primary dry oil recovery in Abqaiq was virtually over 4 years ago. Any remaining reserves are wet where they don't have the water handling facilities. So question is do they want to afford major investments in secondary recovery, more expensive to get oil, when the country runs on profits they make from producing cheap oil.
Figure 5. The "Linux" map showing oil saturations in Ghawar (hat tip Bob Shaw). The blue areas are interpreted to represent dry oil at the top of Arab D Zone 2. The yellow areas are interpreted to be swept, water wet at the top of Arab D Zone 2. The effects of 50+ years production in northern Ghawar are there for everyone to see (Linux Clusters driving step changes in interpretation simulation. (pdf).
If you want to read up on Saudi Arabia and Ghawar, this is pretty good place to start:
Further articles on The Oil Drum about Saudi Arabia:
by Stuart Staniford
by Euan Mearns
by Heading Out
by Ace
dry oil recovery for ghawar was over in about 1976 by saleri's slide 18.
petroleum engineers can solve that problem.
Euan, Thanks for all the links and this recent article. I really enjoy the work you guys do and find the discussion very interesting.
elwoodelmore,
I still think Euan's attempt at framing the lower bound for reserves in Figure 4 is very reasonable. In the original article above he says that it would be wrong to assume that all of the 1980 revisions were bogus. Go back and read it. He also says that it is reasonable to assume that the pre-nationalization estimates provide a lower bound. I take this to mean the low end estimate in a probability distribution, and therefore, it by definition has a very low probability of being true! Is it the the P1 case or the P10 case? Probably more like a P1 estimate, but it is still a reasonable lower bound.
Also, this estimate is for all of the big six Middle East OPEC reserves. Just because one field in one of the six countries has already passed the original pre-nationalization estimate does not make the probability of the estimate drop all the way from 1% to zero.
Again, great write up Euan. I personally think your upper and lower bounds are very reasonable.
ok 1 % then.
And that is exactly what the low end of a probability distribution is supposed to represent.
I think there is a very simple way to resolve this whole question - we simply need to get WikiLeaks to turn their attention to it - at least then they would be doing something useful!
Here's a good source for Iraq's reserves.
"Ultimate recovery from the giant fields of Iraq is estimated to be 85 BOE; for comparison, the estimate for North Dome Gas Field in Qatar is 160 BOE, and 97 BOE for Ghawar Oil Field in Saudi Arabia. Remaining recovery, or reserves, for the Iraqi giant fields is estimated to be 41 BOE (Horn, 2003), or approximately one-half of the ultimate recovery.
http://www.searchanddiscovery.net/documents/gong03/index.htm
Interesting as always, Euan. Thanks. However, I have a question. You write:
Isn't it possible that there were *some* downward revisions (adjustments) with regards to production in the 19820-2010 period, which were overshadowed by the (rather bogus) reserves additions in the mid80s and eary 2000s?
I mean it is theoretically possible (even if not likely) to have a downward adjustment (see the graph) of 5-10Gb while adding 30Gb or even 100 Gb for 'revision of reserves'. I think you have a good chance to be right, but I'm not sure it stating 'Figure 1 demonstrates beyond any reasonable doubt' is correct.
What do you think?
The completely flat reserve figures that runs for that amount of time seems absolutely "and beyond a reasonable doubt" bogus to me. How do you find reserves every single year that exactly match your production for that year? There is no way this is happening. If they were actually finding reserves or revising their estimates, which I am sure they are, it would a least fluctuate from year to year. For them to keep their reserves completely flat all those years indicates to me that they don't really care what number they are putting out. It seems to me that they are basically saying it is nobody business except theirs.
Fair enough.
I was not even sure such a small year to year adjustment shows up in a graph scaled like the one in the article. I found the BP excel sheet though, and the raw 'data' on reserves seems rather 'strange' to the extent I would not even call it data. :-)
This information is helpful round the world, because civilization depends on vision (foresight) to make effective decisions about the energy future.
What Euan points out, then, is that reserve estimates are reckless or negligent in the sense that effective, efficient planning is being thwarted:
How can governing bodies cope with figures that act like desert sand dunes being blown about willie nillie all the time?
Lives are at stake too.
Planners take note, plan as if the oil depletion will happen significantly sooner than expected, and get new technology online as early as possible.
Your grandchildren and mine will be thankful for your vision.
Like the lives of the Saudi Royal Family and oil industry executives which requires them to keep the world hooked on their products to the bitter end.
Hi all.
A few things:
(1) Can anybody please cut it short for me and provide me a ballpoint range of the remaining reserves in middle east as per today or start of this year or start of next year?
(2) Please don't forget that middle east all through the second half of 20th century till today is practically slave of america. In the second quarter of the 20th century it was slave of the british empire and before that it was part of (but not slave of) the great ottoman empire. A few evidences for that:
(i) Existence and continued rulership of the same handful of people and their offsprings who supported the british empire in the first world war and after that and were awarded by dividing the middle east into small countries.
(ii) Existence of israel. A continued threat and british and american way of keeping the rulers of middle east in check.
(iii) Brutal crushing down of any popular movement by the people of middle east that oppose the rulership of the american-supporting-and-american-supported elites. Examples are:
(a) Muslim brotherhood in egypt.
(b) 1953 general elections in the persian kingdom.
These are the examples I remember right down. There may be more. Please note that both the egyptian elites and persian elites supported the west. Egyptian elites are supporting the british empire and then america since 1880 till date. In 1880 the egyptian king break down from the ottoman empire. The persian empire supported the british empire since atleast the start of 20th century and only when the revolution of 1979 converted the empire into a democracy the west favouring elites were put out of power.
Yes there were exception. Notable ones are King Faisal of saudi arabia, Anwar Sadat of egypt, General Qazafi of Libya, King of Jordan, all leaders of hamas. All of these have one thing in common, they fought israel. So, very simply, any leader in arab that is not doing any physical harm to israel is most probably west favouring.
Once its clear that except a few leaders, the entire history of middle east since the fall of ottoman empire till today has the middle east being ruled by west favouring elites, its not hard to understand the false reporting of oil reserves by these elites. They desperately need a reason to remain in power. They were installed there by the british empire and then heavily supported by america because they had one duty to perform, keep supplying the west with oil. Once they declare their inability to do so, they will lose support of west. Once they lose support of west, they can't handle popular (and very democratic) uprisings. Persian empire fall and converted into a democracy through popular uprising when persia was no longer able to supply west with same oil as it used to AND it became clear to west. America never invaded persia to support the persian king who was a very close allie of the west. West left the king on his own and he died pennyless after sometime of tasting hard life. No saudi king, uae ameer, kuwaiti ameer, egyptian "president" etc want the same to happen to them.
Let me tell a very particular case here. In the 1980s middle east countries claimed to have more reserves than the formerly claim. It was all plan of a grand scheme and was not an event in isolation. Please don't forget the geopolitical situation of the world at large of that era and particularly that decade. Cold war was at its peak. Hot and very severe war was going on in afghanistan. America was doing all it can to kill the soviet union. Given that scenario and the puppet role of the elites of middle east, its not hard to decide that the decision to increase the reserves in paper was basically an order by america that the elites of middle east had no choice but to obey.
(3) I agree and support the decision to have a smaller tod. I have these reasons:
(i) This site, given its name and the expertise of most of its contributors should focus on fossil fuels.
(ii) When a lots of articles are posted, the audience quickly jump to the newest one and after a few days its hard to comment on any article slightly old because nobody would be reading it anymore. Having a fewer articles we can delay commenting in an article till the weekend holidays.
Thanks for reading.
Saudi Arabia May Double Oil Use by 2023, Cut Exports, ACWA Says
Obviously if Saudi had the natural gas they would use that instead of their very expensive oil, which they could export. But just as obvious is the fact that they don't have the natural gas to run all their power and desal plants on. And just as obvious, from this article, is the fact that don't ever expect to have enough gas to generate all their power.
And by the way, there is no need to argue about the amount of gas Saudi has. One can tell by the amount of oil they are using to power their power and desal plants. With Natural Gas prices two to three times that of oil it makes no sense not to burn gas instead of oil if you really have the gas. The Saudis would have to be extremely stupid to burn oil for half their power if they really had the gas. If there is one thing you can say about the Saudis it is that they are not stupid.
However Saudi is not the only OPEC Middle East country that will see oil consumption rise because of a shortage of natural gas: ‘Kuwait to keep relying on fuel for power; gas shortfall 1b cfd’
Ron P.
The Saudis would have to be extremely stupid to burn oil for half their power if they really had the gas.
Yes, in the long run. In the past they've kept the domestic price of NG far too low in order to subsidize domestic industry, which they're desperate to expand. That has depressed NG production.
one thing you can say about the Saudis it is that they are not stupid.
But they can make mistakes. Remember growing wheat in the desert? OTOH, they do learn from their mistakes, which is why they killed the subsidized domestic farming program, and why they'll eventually decontrol gas prices and substitute gas for oil generation.
Ultimatately, the argument that KSA is not stupid is an argument against the ELM argument, right?
No, that is not the case. The largest Saudi consumer of natural gas is the Saudi Government... by a very wide margin. In fact the government is about the only user of natural gas in Saudi. There is no gas infrastructure in Saudi that distributes natural gas for private use. What private domestic industry they do have runs primarily on electricity.
Saudi, in 2009, produced 77.1 billion cubic meters of natural gas and used it all themselves. They did not export one single cubic meter. ARAMCO is wholly owned by the Saudi Government. And of course the entire petrochemical industry, power industry and desalination plants are also wholly owned by the Saudi government.
In the last decade they have made heroic efforts to increase their natural gas production. They have had some success but they could not increase production nearly as fast as their consumption increased. And the increase was not due to private use but the increase was due to their expansion of power plants and desal plants. And of course all plants in Saudi are wholly owned by the Saudi Government.
EIA-Saudi Arabia Natural Gas
The Red Sea??? My God, they are getting desperate for natural gas.
No, it is an argument FOR ELM if it is anything. They must produce electricity and they must produce fresh water and they do not have nearly enough natural gas to do that. So they must use their very high priced oil at the expense of exports. I only said they are not stupid to explain the fact that they have no choice but to burn oil to produce electricity and water. It would be extremely stupid to burn oil if they had another choice... natural gas. Obviously they don't because they do not have the gas.
Ron P.
That's interesting, thanks.
they've kept the domestic price of NG far too low in order to subsidize domestic industry, which they're desperate to expand....No, that is not the case. The largest Saudi consumer of natural gas is the Saudi Government
Now, I think you're assuming that when I say "domestic industry", that I mean only private industry - that's not what I meant. I just meant domestic industry, whatever it's ownership.
In the last decade they have made heroic efforts to increase their natural gas production. They have had some success but they could not increase production nearly as fast as their consumption increased.
I've read several discussions in which the authors said that said that the subsidies got in the way in a big way. It does seem a little surprising that subsidies would interfere with a state planning process, but there you are. I'll see if I can find sources...
Well I googled it and couldn't find a thing but if you find something please post it. Several Middle East countries do subsidize natural gas but I could find nothing that mentioned Saudi. However gasoline is subsidized highly. Gasoline in Saudi is $.91 per US gallon. (Perhaps that's where you heard that "gas" was subsidized.) That caused their demand to grow. I don't know if electricity is subsidized but I would bet that it is. When I was there in 80 to 85 we got our electricity for nothing. Of course I lived on an Aramco compound.
My point was that the Saudi government is the primary user of natural gas. And they are the only producer of natural gas. So they would have every incentive to produce every cubic meter possible. Subsidies or not, they would have no effect on Saudi trying to produce as much gas as possible in order to free up more oil for export.
Their exports are dropping because of ever increasing internal consumption. That is ELM! And one of the main reasons that their consumption of oil is increasing is the increasing demand for electricity and water.
Ron P.
Several Middle East countries do subsidize natural gas but I could find nothing that mentioned Saudi.
The discussions were less about subsidies, and more about price controls. Where refiners and other intermediate users of FF have to sell at lower-than-market prices, they require subsidies. A state entity (with it's own domestic supply) wouldn't need explicit subsidies.
Gasoline in Saudi is $.91 per US gallon. (Perhaps that's where you heard that "gas" was subsidized.
It was definitely NG. Here's some discussion:
"Pricing
In addition to facing domestic supply shortages, Saudi Arabia has also come under pressure internationally for its subsidized natural gas prices. Generally, the price for natural gas for industrial and petrochemical use is set by the ministry at $0.75 MMBtu, some of the lowest in the Gulf. This low price was set when most of Saudi Arabia’s gas production came from inexpensive associated gas, but is inconsistent with the much more expensive high-sulfur gas production coming from offshore fields expected to cost from $3.50 - $5.50 MMBtu. The low natural gas price is also a challenge to the foreign operators in the Kingdom looking to discover and exploit resources in the Empty Quarter. "
http://www.eia.doe.gov/cabs/Saudi_Arabia/NaturalGas.html
I don't know if electricity is subsidized but I would bet that it is... increasing demand for electricity and water.
If a state electricity generator isn't charged internally at the proper market price for it's NG and oil, then the electricity it produces will be under-priced. That's a very large, indirect subsidy. The same thing applies, of course, to power used for desalination. Desalination is very power-hungry, and much less cost-effective than water conservation.
Subsidies or not, they would have no effect on Saudi trying to produce as much gas as possible in order to free up more oil for export.
That all depends on internal accounting, and (possibly perverse) bureaucratic incentives. We don't know how those work.
Apparently, KSA is relying on foreign firms:
"Upstream Activities in the Empty Quarter (Rub Al Khali)
The Saudi domestic natural gas market, traditionally the sole domain of Saudi Aramco, is slowly being opened to private investment both in exploration and distribution, and increasing competition in the market. The backbone of the non-associated gas exploration strategy relies on foreign consortiums exploring for onshore gas and condensate (natural gas liquids) in the Rub al-Khali, which officials hope will produce some 2 Bcf/d by 2011, although success has been limited."
http://www.eia.doe.gov/cabs/Saudi_Arabia/NaturalGas.html
The King of Giant Fields
http://www.geoexpro.com/hydrocarbo/ghawar/
pay attention to the map of ghawar and abqaiq.
and from aapg memoir 74 "petroleum provinces of the twenty-first century"(google books)
some 'hot' shale.
Elwoodelmore, we all know about the Khuff etc. Joules has written posts about differentiating between Ghawar oil wells and Khuff gas wells etc. Where have you been? Do you even know what a hot shale is?
I can't see that your involvement in this thread has added any useful information. If you want to find something out then ask a question. If you want to provide information then provide well referenced comments taking care to ensure that it is well researched and check to see how it links into the existing knowledge base contained in the link list i posted up the thread.
Most of all, in 2 or 3 sentences, what is the point you are trying to make? And why do you seem to disagree with my analysis?
how much gas and condensate in place in the ghawar paleozoics ? i would like to know.
i have been doing my own research, that i disagree with what you have said does not mean that i havent read nearly everything that has been written about saudi arabia. plain and simple, i don't buy it.
one that has the potential to generate trillions of barrels of oil and 10,000's of tcf of gas ?
what i have posted is referenced and when not, i have identified such as my opinion. have you bothered to read my references ?
you expect conformity ? again, i have read through all your "knowledge base" - i dont buy it. it seems tod is up to their chest waders in confirmation bias.
i disagree with your analysis for the following reasons:
a) you claim that opec me is using 2p reserves and calling them 1p. that is your opinion and not supported, at least for saudi arabia, by what saleri has stated.
b)your opinion that opec me reserves were artificially inflated is not supported by facts. that saudi arabia'a reserves were understated pre 1989 is documented for at least abqaiq and ghawar in saudi arabia.
c)your assertion that opec me countries have not found reserves to replace production is not true. i documented(with references cited) 10-30 gb oil and 15 tcf gas found in the '90's in the hawtah trend of saudi arabia. condensate contained in saudi arabia's proven gas reserve additions(including paleozoic gas) could easily account for an additional 7 gb. i've just got started.
d)and last but not least, i disagree with your analysis because your analysis starts with 'they are lying'.
A hot shale is actually a radioactive shale rich in Uranium. Oil source rocks are often hot, not by coincidence since the reducing conditions that preserve the organic matter destined to become kerogen are also conducive to reducing U, which in its oxidised state is highly soluble in water, in its reduced state highly insoluble.
i'm aware of the gamma ray signature, don't you also consider a source rock capable of generating trillions of barrels of oil and 10,000's of tcf gas - hot ! ?
imo, your condescending manner adds nothing to the discussion.
You haven't explanined why, when they have all this gas, they are burning oil for power. I thought your reasoning was that they hadn't had time to build the infrastructure yet, but if the finds were made in the 70's, 80's and 90's, this couldn't be the reason.
take a look at saudi arabia's gas production since 1980.
http://www.eia.doe.gov/country/country_energy_data.cfm?fips=SA
the increase in gas production is predominately non-associated gas. nearly a 10 fold increase since 1980. so apparently development has been steady for 30 years. why is it so surprising that demand has exceeded supply ? and what production growth rate were you expecting ?
why not ? north dome/south pars was discovered in the '70's and didn't really get going until around 2000 ?
why, when they have all this gas, they are burning oil for power.
The divergence of pricing/scarcity for oil and NG is very, very recent. It probably didn't make any difference to the Saudis historically whether they burned oil vs gas.
Historically NG was considered less useful than oil - harder to store, much harder to transport. It was relatively recently in a lot of places, in historical terms, that NG was flared rather than collected for sale (or just released to the atmosphere - flaring was an improvement). Some still is flared, of course. Nigeria is apparently quite well lit at night.
Energizing the future
http://www.stroytransgaz.com/press-center/smi/aps-review-gas-market-tren...
Euan, you get quoted in this article: Oil potential is huge in Iraq: Analysts
The article then quotes you about the Iran-Iraqi war and the bidding war that ensued. Then the author says:
Ron P.
Ron, thanks for the link. It was only when I plotted the chart that the history of quota bidding jumped out at me. And the very bloody Iran Iraq war seems to be overshadowed now / forgotten by western preoccupation with GW I and II.